Chapter 2 - International and domestic trends
2.1
This chapter sets out current trends in private equity activity both
internationally and domestically. It considers some of the drivers of this
activity and briefly outlines Australian bank and superannuation fund exposure
to private equity.
International trends
2.2
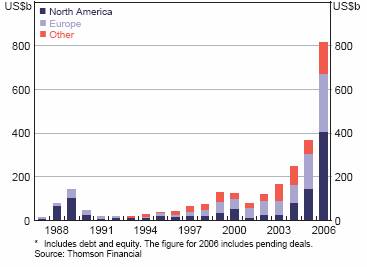
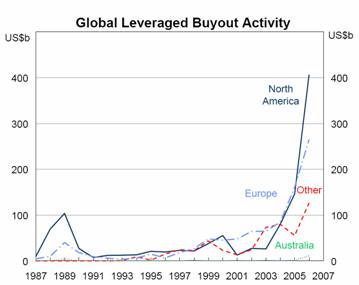
In 2006 there was a global surge in private equity. As shown in the
following chart, global leveraged buyouts (LBOs)[1]
amounted to a little over $US800 billion which was more than double the level
in the previous year and more than six times higher than in 2000.
Global leveraged buyout
activity*[2]
2.3
Despite this very large increase in activity, leveraged buyouts remain a
small part of the overall financing that takes place in the world economy. At $US800
billion, it accounts for less than two per cent of the total size of global
debt and equity markets. Additionally, it comprised approximately 20 per cent
of the total $US3.6 trillion of global merger and acquisition activity in 2006.[3]
2.4
As shown in the following chart, the main increase in LBO activity has
taken place in North America, which in 2006 accounted for half the global
activity. The total value of United States LBOs amounted to approximately three
per cent of the total value of equity in 2006.[4]
Europe also experienced a large increase in LBO activity, and the 'other'
category, which is mainly Asia, had a smaller increase.[5]
The largest buyout markets in continental Europe are France, Germany and the
Netherlands.[6]
Funds raised
2.5
The bulk of the funds raised globally originate in the United States (69
per cent), with a further 29 per cent from Europe.[7]
Institutional investors, including insurance companies, endowment funds and
pension funds, currently account for around 80 per cent of the investor funds
under management.
2.6
The private equity industry raised $US240 billion in the first half of 2007
and in July seemed likely by the end of the year to eclipse the record amount
of around $US459 billion raised in 2006.[8]
The fundraising market has recently been dominated by large and mega buyout
funds.[9]
In 2006, 10 funds of $5 billion or more in size achieved a final close. The
increasing number of large and extremely large buyout funds raised the average
buyout fund size from $700 million in 2004 to $1.13 billion in 2006. Six months
into 2007, a further eight funds of $5 billion or more reached a final close
and there were an additional five funds of similar size in the market. Some
funds raised $15 billion, and a commitment close to $20 billion was achieved
for one fund.
2.7
Real estate funds, which were previously a small component in the
overall private equity fund arena, have grown in importance. They now represent
the second biggest fund type (buyout funds are the largest). $99 billion was
committed during 2006. Real estate funds have relatively low levels of risk in
comparison with private equity funds of other types.
Drivers of the rise in leveraged buyouts
2.8
LBO activity has been a global event and so the reasons behind its rise
are global. Favourable macroeconomic conditions including strong economic
growth, low interest rates, high levels of liquidity and rising asset prices
have driven the increase in private equity activity in recent years.
2.9
Strong corporate balance sheets, along with a reluctance of some publicly
traded companies to undertake new investment, provided good targets for mergers
and acquisition and LBO activity.[10]
The share of profits in GDP began to escalate around 2000 and has risen to
roughly 25 per cent above its longer-term average. Corporate cashflows have
also been strong. The International Monetary Fund (IMF) suggests that
notwithstanding the favourable conditions, the reticence of corporations to
invest may reflect some 'lingering cautiousness stemming from the excess
capacity and overzealous investment of the late 1990s and the high hurdle rates
used by companies in assessing new investments.'[11]
2.10
Additionally, some firms are seen as having capital structures that have
a lower proportion of debt to capital than is optimal in an environment of low
interest rates and ample funds available for investment. The current wave of
mergers and acquisitions can be characterised as an exercise in capital
structure arbitrage. Where such firms are in sectors with relatively stable
earnings and cash flows—such as utilities, consumer goods, and retail—they make
suitable targets for buyouts.
2.11
In some cases, public firms have been 'taken private' to overcome costs
(both perceived and actual) of regulatory compliance and shareholder scrutiny.
The implementation in the United States of the Sarbanes-Oxley Act has been
particularly cited in this regard.
2.12
Finally, the large influx of capital into private equity funds has been
a significant driver of private LBO activity. The private equity industry
raised $US430 billion in 2006, and in April 2007 it was forecast to raise $US500
billion for 2007. In many cases, private equity funds have been boosted by the
distribution of profits and dividends from earlier deals, and these are being
reinvested in new deals. Additionally, private equity funds have been
generating and distributing returns on their investment at an accelerated pace,
as short as 20 months following acquisition, versus a standard length of four
to eight years.
2.13
This surge in LBOs differs from previous cycles in that the size of the
deals is much larger. In part this is due to a larger number of LBOs being
completed by multiple fund managers that pool their resources to back a single
transaction (referred to as 'club deals'). This has enabled a significant
expansion in the size of transactions that may be undertaken. The degree of
leverage in the targeted companies is also rising, although it remains low
relative to the 1980s cycle. Additionally, deal funding has favoured leveraged
loans over high-yield debt.[12]
This in turn has altered the distribution of risks throughout the global
economy.
Trends in Australia[13]
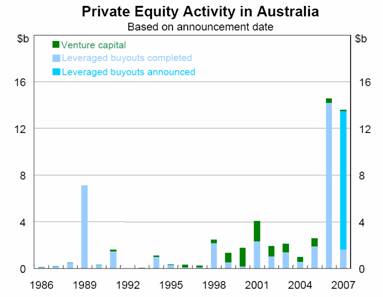
2.14
The growth in buyouts in Australia has markedly accelerated in recent
years. The increase in Australian private equity transactions lagged the boom
in the US and Europe by a couple of years but in 2006, the value of completed
private equity transactions increased to around $14 billion, contrasting
with an average of around $2 billion for each of the previous five years.
2.15
Between the years 1999 and 2005 venture capital investments and
leveraged buyouts were more or less evenly split by value in Australia.
However, in 2006, venture capital comprised only a fraction of the value of
total private equity investment:[14]
2.16
The value of the leveraged buyouts was equivalent to two per cent of the
total assets of the Australian non-financial corporate sector, which the RBA
suggests is similar to the corresponding proportion for the United States.[15]
Additionally, the increase in the value of LBO activity was due to a sharp rise
in the average size of deals, rather than a rise in the number of deals, as is
the case internationally. According to the Reserve Bank, there were only
twenty-eight of these private equity deals done in Australia in 2006.[16]
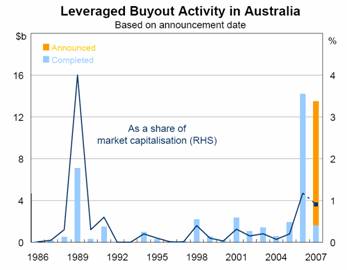
2.17
In 2006, the value of LBO activity as a proportion of Australia's equity
market was approximately one per cent. The following graph shows how this
proportion has fluctuated over the last two decades. In 1989, the figure was
much larger than currently at approximately 4 per cent:[17]
2.18
Recent buyouts in Australia have typically resulted in gearing ratios of
around 250 per cent, compared with pre-buyout ratios of around 50 per cent and
a gearing ratio for the non-financial corporate sector as a whole of 65 per
cent. As a comparison, during the late 1980s LBO boom in the United States,
debt-to-equity ratios exceeded 500 per cent. If the leveraged buyout increases
the purchased company's gearing to such an extent that its credit rating is
downgraded, the cost of the debt is likely to increase.
Private equity fund raisings
2.19
In Australia, as is the case overseas, there has been a significant flow
of money into private equity funds, as shown in the following graph:[18]
2.20
Over the past three years, annual raisings have averaged around $2
billion, with private equity funds now accounting for about 1.5 per cent of
Australian funds under management. Institutional investors account for four-fifths
of the funds managed by Australian private equity funds. Superannuation funds
represent the major investor class, accounting for around half the total funds
committed to private equity at the end of June 2006:[19]
The Committee notes that in 2007 total superannuation assets
reached the $1 trillion mark, backed by strong equity markets and a
guaranteed flow of money that some researchers estimate could double in size by
2015.
2.21
Over the past decade, 35 per cent of investor inflows in Australia have
been through ‘fund of funds’ — pooled vehicles in which a private equity fund
invests in a range of domestic and offshore private equity funds — whereas in
the United States this figure is closer to 10 per cent. As at 30 June
2006, total private equity funds under management in Australia was around $22.4
billion.[20]
Bank
exposures and superannuation fund exposures to
private equity
2.22
The bulk of the funds for Australian LBO activity come from borrowings
from foreign owned banks. Foreign equity contributes about 25 per cent of the
funds. The following graph shows a breakdown of the funding of Australian LBOs.
It takes into account the average funding for the deals completed over the past
five years:[21]
2.23
The Reserve Bank estimates that there is probably about $20 billion debt
outstanding to Australian private equity companies and less than $5 billion is
on the books of Australian banks. This amounts to less than one per cent of
their overall lending. Approximately half of the domestically sourced equity
proportion for Australian LBO funding comes from Australian superannuation
funds, as illustrated in the following graph:[22]
2.24
The available evidence suggests that more than half of the largest
superannuation funds have a portfolio allocation to private equity, with an
average allocation of around five per cent. Many superannuation funds increased
their exposures to private equity and other alternative investments, such as
hedge funds, after the share market correction in 2000 because they were
looking to achieve more stable returns.[23]
In some ways they were looking to copy the successful record that some of the US
university endowment funds have achieved as a result of investing in unlisted
vehicles, such as private equity and hedge funds.[24]
2.25
Any institutional investment in private equity must be viewed in the
context of a fund’s overall asset allocation.[25]
In such a context, for a typical institutional investor, the aggregate exposure
to private equity is small in a relative sense. For example, a typical
strategic asset allocation for the asset class would range between 2.5 per cent
and 7.5 per cent of total assets. For a $5 billion superannuation fund, this
represents an aggregate exposure to private equity of $125 million to $375
million. By way of comparison, if that fund had a 50 per cent exposure to
listed equities, with eight managers in the structure, each listed equity
mandate would be approximately $312.5 million in size.
2.26
However, a survey by Deloitte found that industry superannuation funds
had more than doubled their allocation to alternative vehicles since 2002,
while commercial funds slightly increased their exposure to the largely unlisted
market.[26]
That is, industry funds increased their exposure to alternatives from 7 per
cent of balanced fund assets in March 2002 to 15.1 per cent in March 2007,
while commercial funds boosted exposure from 0.5 per cent to 3.1 per cent.
2.27
Within their private equity exposures, institutional investors further
reduce risk by diversifying their investments by:[27]
- vintage: the portfolio is invested across different vintage years
to avoid concentration at any point in time over an economic cycle;
- geography: to avoid over exposure to any one region or economy,
the commitments to private equity managers are diversified across Australia,
US, UK, Europe and other regions;
- sectors: the portfolio is also invested across all sectors of
private equity. These include venture capital, expansion capital (a subset of
buyouts), buyouts and special situation; and
- managers: by committing to a range of private equity managers,
the portfolio avoids over exposure to any single manager.
Outlook
2.28
There are some indications that private equity activity has approached
or is approaching its peak and that the market cycle is adjusting. Anecdotally,
there are reports that companies in the United States have had to suspend their
plans to raise debt because of its rising cost, and additionally investors may
be becoming more cautious about investing in riskier debt issues.[28]
The private equity model becomes less viable without access to cheap financing
and ready capital.
2.29
The reasons for a reduction in private equity activity include:[29]
- a re-evaluation of risk in response to the problems in the US
subprime mortgage market. This increases the difficulties of private equity
firms obtaining 'covenant lite' financing,[30]
thus reducing the flexibility of their business model;
- the high level of corporate profits suggests there may not be
significant gains that private equity can achieve from businesses;
-
there may be a shrinking pool of viable targets; and
- an increasing spotlight on the private equity industry may tempt
policy makers to take steps to reduce their well publicised profits, or
super-returns.
Navigation: Previous Page | Contents | Next Page