Chapter 4 - Household debt in Australia
I suspect that a significant number of households have taken on a debt
level which makes sense in the good times, but does not take into account the
fact that bad times will inevitably occur at some time or the other.[108]
Introduction
4.1
A significant cultural change seems to have taken place
in the attitude of many Australians towards debt. Twenty years ago Australian households
averaged about $50 in debt for every $100 of income. That figure has now risen to about $150 in
debt for every $100 of income.
4.2
Similar rises in debt to income ratios have occurred in
other countries, particularly in the last decade, although the rise in Australia has been more rapid than in most other
countries. In line with this increase in the household debt to income ratio,
the total amount lent to persons by banks has also risen dramatically, from
$92.4 billion in 1990, to $579.1 billion in 2005.[109]
4.3
From having one of the most conservative approaches to
debt in the OECD, Australians are now amongst the heaviest borrowers and seem
to have accepted much higher debt levels as part of life in the new millennium.
4.4
The large rises in household debt in this country have
aroused concern and provoked comment both nationally and internationally, for
example in the internationally renowned The
Economist:
The
profligacy of American and British households is legendary, but Australians
have been even more reckless...there are now concerns that unsustainable rates of
borrowing will sooner or later end in tears.[110]
4.5
Many of the statistics and graphs used in this chapter
are drawn from material provided to the Committee by the Treasury and by the
ANZ Bank. Other material was derived from statistics compiled by the Department
of Parliamentary Services Parliamentary Library Statistics Group or published
by the Reserve Bank of Australia (RBA) and the Australian Bureau of Statistics
(ABS). The Committee records its thanks for the assistance provided.
The growth of household debt
4.6
Table 4.1 shows the size of household debt or
liabilities in Australia and how it has grown.
Table 4.1: Household liabilities and assets, $ billion
|
Quarter |
Liabilities$ b |
Assets $b |
Liabilities as
% of assets% |
Liabilities as %
of GDP% |
Liabilities as %
of gross
household
disposable
income, % |
|
Non-Financial |
Financial |
Total |
|
Jun-90 |
187 |
873 |
500 |
1373 |
13.6 |
48.6 |
70.6 |
|
Jun-95 |
267 |
1114 |
705 |
1819 |
14.7 |
56.8 |
82.4 |
|
Jun-00 |
473 |
1642 |
1117 |
2759 |
17.1 |
75.8 |
114.6 |
|
Jun-01 |
515 |
1793 |
1219 |
3012 |
17.1 |
77.1 |
114.1 |
|
Jun-02 |
596 |
2106 |
1269 |
3375 |
17.7 |
83.6 |
126.5 |
|
Jun-03 |
685 |
2400 |
1315 |
3715 |
18.4 |
90.4 |
140.9 |
|
Jun-04 |
796 |
2767 |
1477 |
4244 |
18.8 |
98.0 |
153.7 |
|
Mar-05 |
861 |
2912 |
1631 |
4543 |
18.9 |
99.7 |
157.7 |
Source: RBA Bulletin, Table B.20, based on ABS, Financial Accounts (Cat. No. 5232.0) - for household liabilities;
and ABS, National Income Expenditure and
Product (Cat. No. 5206.0) - for gross household disposable income.
Note: 'Non-financial assets' comprise consumer durables and dwellings –
dwellings represented 95% of total non-financial assets for the March 2005
quarter; 'Financial assets' include both households and unincorporated
enterprises and cover bank deposits, shares and superannuation.
4.7
Bank lending to households over the last fifteen years
has grown a faster rate than the economy. Total bank lending to households grew
from 24 per cent of GDP in 1990 to 67 per cent in 2005. It should be noted that
this statistic understates total lending as it does not include non-bank
sources of finance such as credit unions and non-conforming lenders.
4.8
Based on bank lending statistics, the major part of
debt held by Australian households, 85 per cent, is made up of mortgages for
housing. Fixed term loans make up a further 6 per cent, and revolving loans
(which include credit and charge card debt and lines of credit) the remaining 9
per cent.
4.9
Housing mortgages may be further broken down
between owner-occupiers and investors. Borrowing for investment purposes
currently comprises 34 per cent of borrowings for housing.
4.10
Credit card debt totalled $31.4 billion as at June
2005, representing 58.5 per cent of revolving loans and 5.4 per cent of total
household debt. Credit card debt has risen from $4.1 billion (June 1990) to
$31.4 billion (June 2005). [111]
4.11
Growth in fixed term loans (for example, unsecured
personal loans) has been more modest however, increasing from $19 billion
to $33.5 billion between 1990 and 2005. The ANZ submission points out that the
rate of growth of personal borrowing has almost halved, from an annualised rate
of 22% in the December 2003 quarter to 12% in the December 2004 quarter.[112]
4.12
The Reserve Bank of Australia has published the following figures for bank
lending (Table 4.2) which show that while borrowing has continued to grow, the
rate of growth has slowed in the last year.
Table 4.2: Bank lending to persons, June 1999 to 2005, $billion[113]
|
Month/Year |
Housing |
Other Personal |
Total $billion (and change over previous year) |
| |
Owner-occupiers |
Investors |
Fixed loans |
Revolving loans |
|
June 1999 |
153.1 |
60.7 |
21.2 |
21.4 |
256.3 |
|
June 2000 |
169.7 |
75.7 |
22.5 |
26.7 |
294.6 (+15%) |
|
June 2001 |
194.0 |
86.1 |
19.6 |
27.2 |
326.9 (+11%) |
|
June 2002 |
220.5 |
96.9 |
26.7 |
31.4 |
375.5 (+15%) |
|
June 2003 |
254.2 |
123.3 |
28.8 |
37.9 |
444.3 (+18%) |
|
June 2004 |
288.6 |
151.9 |
31.6 |
45.4 |
517.4 (+17%) |
|
June 2005 |
324.0 |
167.9 |
33.5 |
53.7 |
579.1 (+12%) |
Source: RBA Bulletin, August 2005, Table D.5.
Factors contributing to the rise in
household debt
4.13
Most of the evidence available to the Committee
focussed on housing related debt and credit card debt. Contributors to the
inquiry and other commentators broadly agree on the main causes of the rise in
household debt, although opinions differ about significance of the various
contributing factors. The primary factors that have resulted in much higher
household debt levels include:
-
Freeing up of the financial markets, which meant
credit became much more readily available;
-
A prolonged period of low inflation and low
interest rates gave consumers a feeling of confidence in the economy;
-
Increased competition in lending, more
advertising and promotion;
-
A much wider range of products from lenders,
including lines of credit and interest-only loans;
-
The stockmarket boom in the mid-to-late 1990's
followed by the real estate boom and the ability of consumers to borrow for
investment purposes;
-
The growing acceptance of the concept of debt
used for investment as 'good debt', actively promoted by financial advisers
promoting wealth creation strategies based on investment in equities and
property;
-
Increasing financial literacy and the
realisation of the baby boomer generation that it would have to take more
responsibility for funding a comfortable retirement;
-
Rising asset values, especially in residential
real estate, which gave home owners a feeling of increased wealth (so-called
'wealth effect'), and the ability to unlock that wealth through new financial
products such as loans based on home equity;
-
A sustained period of economic growth, low
inflation, low interest rates, and falling unemployment.
4.14
A detailed discussion of these various influences is
contained in Appendix 5.
Distribution of debt across households
4.15
Debt is distributed unevenly across households.
Treasury pointed out that only a third of households have a mortgage, and that
the debt to income ratios in these households will be higher than the average
figure.[114]
4.16
A study conducted by University of Melbourne researchers[115]
found that debt levels do vary significantly. The study revealed that about a
third of households have no debt, and almost a quarter have debts equivalent to
less than half a year's income. However, for 9 per cent of households,
liabilities exceed four times annual income.
4.17
Treasury suggested that there is a strong relationship
between income and debt, those with higher incomes holding most of the debt and
being well placed to repay it. The University of Melbourne study confirms this relationship, showing that
most household debt is held by income rich and asset rich households.
4.18
Using assets as a measure of wealth, 72 per cent of all
debt is held by the wealthiest 30 per cent of households, and 42 per cent of
debt by the wealthiest 10 per cent. The 20 per cent of households that are the
least wealthy in terms of the assets they have account for just 6 per cent of
household debt. The survey found similar results when income is used as the
measure of wealth. Table 4.3 shows the distribution of assets and debt among
the Australian population. This table is divided according to net worth (i.e.:
the value of all assets and savings) and net income.
Table 4.3: The distribution of household wealth and income by
percentile
|
Percentile |
Sorted by net worth |
Sorted by net income |
| |
Assets |
Debts |
Assets |
Debts |
|
1-10 |
0 |
0 |
5 |
2 |
|
11-20 |
1 |
0 |
5 |
2 |
|
21-30 |
2 |
1 |
5 |
3 |
|
31-40 |
4 |
3 |
7 |
5 |
|
41-50 |
5 |
5 |
7 |
7 |
|
51-60 |
7 |
7 |
9 |
8 |
|
61-70 |
9 |
9 |
10 |
11 |
|
71-80 |
12 |
13 |
13 |
16 |
|
81-90 |
18 |
18 |
15 |
17 |
|
91-100 |
42 |
45 |
25 |
27 |
|
TOTAL |
100 |
100 |
100 |
100 |
Source: Table is an extract from Table 5, p14 of
Income, wealth and joblessness: insights
from the HILDA survey,
a paper by B. Headey and M. Wooden of the University of Melbourne presented to the 2005 Melbourne Institute
Economic and Social Outlook Conference, 31 March – 1 April 2005.
4.19
An analysis of the same HILDA data used in the University of Melbourne study conducted by the Economic Group of the
RBA somewhat unsurprisingly confirmed these findings.[116]
This study showed that households that are most highly leveraged (i.e.: have
the highest debts-to-assets ratio) are those most able to bear the debt - mid-life
households with high income.
4.20
This study also found that those households living in
areas described as 'least vulnerable to reversals in housing prices, the outer
suburbs and non-metropolitan regions that have experienced relatively smaller
gains in recent years' and households that are negatively geared on investment
property tend to be more highly leveraged.
4.21
The study found that while young households in general
are less likely to be homeowners, those who do have mortgages are likely to
have particularly high leverage.
4.22
However, the study does appear to confirm that
relatively few households are leveraged at a level considered to be 'high'. The
study estimated that 11.4 per cent of households with housing loans (less than
4 per cent of all households) had a ratio that was 'high' – that is, exceeded
80 per cent - and less than 3 per cent had negative equity in their homes.[117]
Household debt indicators
4.23
How are households coping with increases in debt
levels? A number of ratios provide a picture of the impact of debt on
households. They include: household
saving ratio; debt to income ratio; interest-to-income ratio; and the household
gearing ratio.
Household
savings ratio
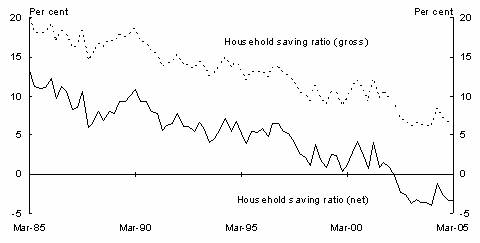
4.24
The household savings ratio is calculated as a
percentage of household savings to household income. The trend for Australian
households over the last 20 years has been one of a diminishing rate of savings
and rising consumption, to the extent that Australian households have now
entered a period of dis-saving as shown in Figure 4.1.
Figure 4.1: Savings ratio of Australian households
Source: Australian
Bureau of Statistics cat. no. 5206.0
4.25
Treasury advised the Committee that although the
household savings ratio has a number of limitations 'the broad conclusion that
households are saving proportionately less of income now than in the past is
likely to be correct'. [118]
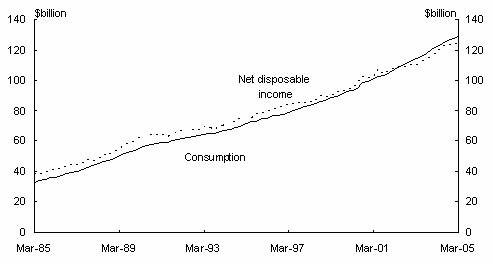
4.26
This trend is also clear when consumption and income
are compared, as shown in Figure 4.2:
Figure 4.2: Household
consumption and income
Debt-to-income
ratio
4.27
The debt to income ratio measures the size of debt as a
percentage of disposable income. However, not all commentators agree that this
statistic is useful. The ANZ, for example, submitted that the gross debt to
income ratios 'offer no reliable guide for assessing the vulnerability of the
household sector and if used alone can provide a misleading view of fundamental
conditions'. The ANZ submitted that to fully understand the issue of household
debt, the level of debt must be examined in the context of a household's
accumulated assets and current income.[119]
4.28
Historically, Australian households were debt adverse
by international standards but in common with many other developed countries,
they now carry much more debt, as shown in Figure 4.3.
Figure 4.3: Household debt-to-income ratio, selected countries
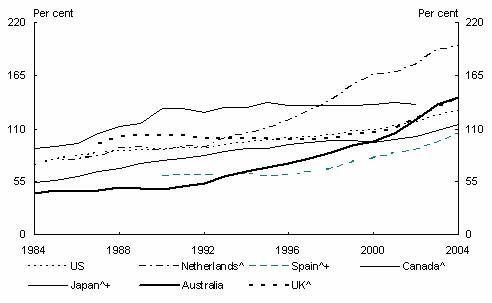
^ Includes
unincorporated enterprises
+ Income is after
tax and after the deduction of interest payments
All data is based on
calendar years, except for Spain,
which is based on financial years
Source:
RBA.
Interest-to-income
ratio
4.29
A useful indicator of debt serviceability is the
interest payments to income ratio. This measure shows what percentage of a
household's disposable income is required to meet interest payments on their
debt.
4.30
Treasury advised the Committee that despite a fall in
interest rates, increased levels of debt means that interest payments now take
up a higher proportion of income compared with the last decade. Figure 4.4
shows how average interest payments-to-income are now above the peaks of the
1980s and early 1990s.
Figure 4.4: Interest
payments-to-income ratio of Australian households
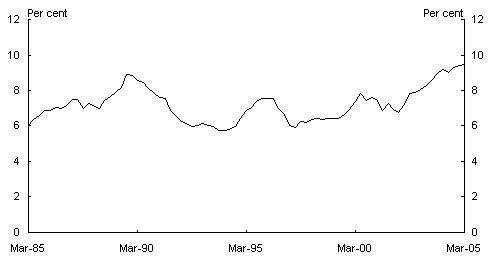
Source: Australian
Bureau of Statistics cat. no. 5206.0.
Household-gearing
ratio
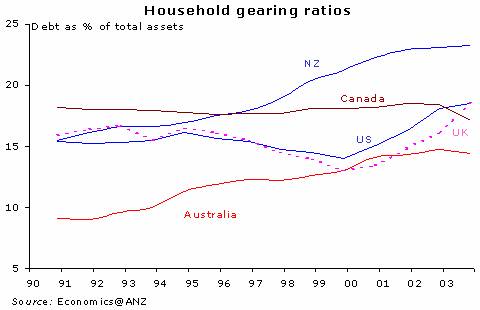
4.31
The household-gearing ratio shows the percentage of
assets encumbered by debt, that is, the amount of debt the household has as a
percentage of total assets. The ANZ advised the Committee that while the
gearing ratio is rising, it remains well below international benchmarks.
4.32
Figure 4.5 shows the gearing ratio in Australia compared to a number of selected countries.
Although the gearing ratio of Australian households is now higher than many
OECD countries, including the USA and UK, because of the substantial increase in house
prices in recent years Australia's household gearing ratio (household debt to
assets) remains relatively low by international standards.[120]
Figure 4.5 – Household
gearing ratio (Debt as a % of total assets)
4.33
The Australian Bankers' Association (ABA) told the
Committee that while debt is high, it is 'still reasonably small compared to
household assets'. The Association advised that debt is equivalent to twenty
per cent of assets, and that this ratio has been stable for a number of years.
The ABA acknowledged that this ratio is around twice
what it was in the 1980s, meaning that households are now more highly geared.
4.34
Again, the RBA considers that this statistic
understates the true figure for those households who hold housing debt. In July
2003, the RBA estimated that when the figure is adjusted to take account of
those households who have no housing debt, the average gearing ratio for those
that do have housing debt rises to about 43 per cent.[121]
A subsequent study conducted by the RBA and released in July 2003 estimated the
ratio to be 48 per cent.[122]
4.35
As pointed out by the Treasury in its submission, all
of these measures have limitations. Perhaps the major limitation is that they
present an average picture, where in reality large variations in debt and
circumstances will be evident between individual Australian households.
How are households coping?
4.36
The household sector's debt levels are now at
historically high levels, and this is reflected in most measures of debt
serviceability. In its most recent report, the RBA reported that:
Both as a result of higher debt levels, and the increase in mortgage
rates earlier this year, the ratio of aggregate household interest payments to
disposable income has increased further to 9.8 per cent, the highest level on
record. The total repayment burden, allowing for principal repayments, is
higher again relative to past experience, given the increase in average loan
size.[123]
4.37
However, the available evidence indicates that most of
those households that are carrying heavy levels of debt are well-placed to meet
their repayments. As both the Treasury and RBA have observed, there are few
signs of financial distress, and default rates on all forms of credit are very
low. The exception is a very small number of households (compared to the size
of the population that has debt) who are undoubtedly in difficult situations,
usually as a result of inadequate income levels.
4.38
Financial counselling organisations agree that most
Australians seem to have little difficulty managing their household debt. For
example, the Care Financial Counselling Service (CFCS) told the Committee that
'Most consumers do not appear to have any problems managing their increased
levels of debt.' However, the CFCS went on to say that it had experienced a
marked increase in demand for its services:
...the disparity between
those coping well and those on the brink or already in crisis is becoming more
marked. For example, CARE noted a dramatic increase in demand for its services
in the first 6 months of 2004. [The number of] clients over 50 seeking
assistance has risen from 12% to 24% in 3-4 years.[124]
4.39
The CCLC questioned the validity of relying on default
rates as an indicator of financial stress, arguing that there are three reasons
why this may mask the true situation:
The first is fairly obvious
- that is, we have had fairly solid economic conditions for some time now so if
default rates are going to be low then now is the time that they will be and
any form of economic downturn might have an effect on that.
The second one is that we
see clients making very creative use of the availability of other credit in
order to mask potential default situations. We have clients who refinance their
credit over and again...roll their credit card debts over into their home
loan...and, at the extreme, use one credit card to pay another. ... They really
have no capacity to make the payment at all; they are using it as a mechanism
to mask their situation.
The final thing, which we
think is perhaps the biggest problem when looking at the default rate, is that
in the last 10 or 20 years we have moved to a completely new scenario whereby,
instead of paying off loans, people are making minimum payments. This is not
something which happened in the past...What we have now are credit cards and
store cards - the most obvious example of continuing credit facilities - whereby
people will sit for many years with their balance fully drawn. ...When we look at
defaults, we are not measuring people’s ability to meet that debt; what we are
measuring is their ability to meet the minimum payment only.[125]
4.40
The Australian Bankers Association (ABA) agreed that
default rates do not necessarily provide the most reliable indicator of
financial stress, but noted that determining financial stress levels was
difficult:
Finding the right indicator
of households’ financial stress is a very difficult exercise, and it is
something that we have given thought to. We never make the claim that because
defaults are at record lows there is no financial stress out there at all. It
is a good indicator that overall things are looking pretty good for the economy
and for households in general. But when you move away from defaults and look
for some other measure, you then get into a debate about judgement and that is
an awkward debate, something which we have not seen any definitive research on
or answer to. It is something we are engaged in and we are looking at it and we
are interested in seeing whether there is something useful we can do.[126]
4.41
People whose financial difficulties force them to seek
the assistance of the many financial counselling groups in the community may be
considered as experiencing financial stress, but it is difficult to obtain a
reliable estimate of the number of people who avail themselves of these services.
The following statistics provide some indication of the number of people who
get to the point that they need external assistance.
-
a survey conducted by members of the Financial
Counsellors' Association of NSW (FCAN) indicated that 2 322 clients presented
for counselling in NSW during 2003;[127]
-
CARE Inc Financial Counselling Service (CARE)
reported that it responded to over 2 200 new requests for assistance in the ACT
during 2004;[128]
-
the Credit and Debit hotline operated by the
Consumer Credit Legal Centre (NSW) Inc (CCLC) took 2 512 calls from the public
and financial counsellors in the first 5 months of operation;[129]
-
the CCLC received between 4 500 and 5 000 calls
in the period Sept 2004 – May 2005[130];
-
Anglicare Tasmania assisted 1 200 individuals
and families during the 2003-04 financial year; [131]
-
in 2002-03, financial counsellors under the
Commonwealth Financial Counselling Program assisted approximately 16 000
clients; [132]
and
-
during 2003-04, one financial counsellor in
Brisbane assisted 679 new clients and 399 existing clients. In Queensland,
demand for financial counselling is increasing, and waiting periods to see a
counsellor can be a few weeks.[133]
4.42
These statistics almost certainly under-report the
number of people who are in financial distress or are approaching that state.
As the Centre for Credit and Consumer Law, Griffith
University (CCCL) noted in its submission:
Other households, who are
currently managing their credit commitments, may be at risk of default or
financial hardship if their financial circumstances or other factors change.
Unemployment, family breakdown, and ill health all feature as significant
causes of financial difficulty.[134]
4.43
The CCLC told the Committee that many consumers in
financial difficulties resort to bankruptcy and other insolvency arrangements,
noting that in 2003-04, there were 16 441 non-business bankruptcies across
Australia, and 5 482 Debt Agreements under Part IX of the Bankruptcy Act.
Excessive use of credit was the second most common cause of non-business
bankruptcies, after unemployment.[135]
4.44
A number of studies show that lower income households
are the most likely to encounter difficulties. A report prepared for the FCAN
found that 76 per cent of the associations' clients have incomes of less than
$30 000 per annum. The primary causes of credit and other debt problems
reported by clients in order of importance were unemployment (27 per cent),
excessive use of credit (19 per cent), domestic discord (15 per cent)
and ill health (14 per cent). Of those who reported excessive use of credit,
credit cards are the principal source of difficulty.
4.45
While excessive use of credit is listed as a less
significant reason for financial problems than might be expected, it appears to
be the issue that causes the most problems when people encounter personal
problems which reduce their earning capacity. The authors of the study
observed:
The typically low income of
the majority of the clients...makes them vulnerable to uncontrollable factors
such as loss of employment, domestic discord and ill-health.[136]
4.46
MasterCard confirmed that this is the case:
One of the major reasons
for debt defaults, as has been reported by a lot of research, is catastrophic
life events such as ill health, divorce or the death of the primary breadwinner
in a family. Almost always these life events are unforeseeable and,
unfortunately, they are also usually totally unavoidable.[137]
4.47
On the basis of the evidence received by the Committee,
it is difficult to sustain an argument that a significant proportion of the
community are in financial distress as a result of excessive levels of
household debt. It cannot be disputed however that there is evidence of a
significant minority who are in distress, and a further group of indeterminate
size who are not currently in financial distress but would have difficulty
coping with a change in personal circumstances. As the CCLC observed:
Probably not the majority
of us but a very significant minority are using credit to mask an imbalance
between income and expenditure. There are probably people who are using that
credit proportion to buy luxury or imported goods and some who are using it to
increase their capital wealth by investing in their own house, but we see a lot
of people who are using credit just to live - people on fairly low incomes who
are using credit facilities to purchase necessaries such as groceries,
electricity, car registration and those sorts of things.[138]
What are the future risks to households?
4.48
The RBA has been warning for some time about the risks
associated with what it sees as unsustainably rapid increases in household
debt. The major risk for many households is that they may have difficulty
meeting repayments if the economic climate deteriorates or their personal
circumstances change. As the Governor of the RBA warned:
I suspect that a significant number of
households have taken on a debt level which makes sense in the good times, but
does not take into account the fact that bad times will inevitably occur at
some time or the other.[139]
4.49
MasterCard
was also among those who warned of the possible consequences of an economic
downturn:
...the existing issues
with managing household debt will blow out significantly when the inevitable
economic downturn eventuates.[140]
4.50
Despite
the fact that there are few signs of financial distress among the household
sector at present, the RBA has continued to warn that the household sector,
through its excessive levels of borrowing and record levels of debt, is
vulnerable:
...the high levels of
household debt make the household sector vulnerable to change in the generally
favourable economic and financial climate. Given this, developments in
household sector finances and the housing market will bear close watching in
the period ahead.[141]
4.51
External
factors appear to pose the greatest risk to the economic climate, for example,
a general slow-down of the world economy. While remaining fairly optimistic
about the prospects of the household sector, the RBA has previously laid out
what it sees to be the major threat posed by continuing rapid rises in
household debt:
...the combination that
would be most damaging to the Australian economy would be if the household
sector were to continue putting itself into a more exposed position at the rate
it has over the past few years, while at the same time a further weakening of
the world economy was starting to feed through to activity and incomes. That
would be a recipe for ensuring that, when the house price correction came, as
it inevitably would if the world economy was weak enough, it would be bigger
and more disruptive than otherwise. I am not saying that this is the most
likely outcome, only that it is a risk we have to take into account.[142]
4.52
The RBA currently appears to be of the view that risks
have abated somewhat due to an apparent slowing of the rate at which household
debt is increasing. This slowing appears to be largely because the housing
market has stabilised and some corrections are emerging as prices fall in some
cities. There has been a marked change in the housing market over the last 18
months, and 'cooling is evident in conditions in all capital cities, although
it is most pronounced in Sydney'.
4.53
The RBA has also commented that households appeared to
be going through a period of consolidation.
4.54
While the overall picture is not alarming at present,
some risks to households remain and in its recently released Financial Stability Review the RBA has
warned that 'there remains a possibility that the adjustment could turn out to
be much larger than currently anticipated'.[143]
4.55
However, the RBA notes that the correction to the
housing market has, to date, proceeded smoothly, and this has helped alleviate
concerns about a potentially more damaging adjustment at some point in the
future.[144]
Interest rate rises
4.56
The Treasury has warned that the household sector is
now more sensitive to shocks such as higher interest rates or lower income and
identified highly geared investors as being particularly at risk:
The increased debt of the household sector is likely to make
their consumption more sensitive to changes in (actual and expected) interest rates.
The extent of the increase in sensitivity will depend on the distribution of
the debt. For example, investors, some
of whom are more highly geared, account for an increasing proportion of the
housing market, and may react differently to owner-occupiers.[145]
4.57
However, the RBA is of the view that this is a somewhat
over-stated risk, pointing out that interest rate rises are less likely in the
more stable economic environment which now prevails:
For a given rise in interest rates, it [households] will be more
affected because the rise will apply to a larger loan. But it is probably not
right to make the assumption about 'a given rise in interest rates'. That is
because in the low inflation/low interest rate environment we have today,
interest rates do not move about as much as before. In the late 1980s, on one
occasion the mortgage rate rose by 3½ percentage points in a year, in the 1990s
we have had nothing like that (the largest rise in a year was 1¾ percentage
points).[146]
Recent borrowers and low income earners
4.58
People who have recently taken out a mortgage tend to
be more at risk in times of economic downturns or if their personal
circumstances change, as their exposure to debt is at its maximum. However,
this has always been the case, as the Governor of the RBA has pointed out:
Of that 30 per cent of
households, a lot have had the mortgage for a reasonable period and, during
that period, their incomes have gone up or they have paid off part of their
mortgage. The vulnerable group is the people who have just taken out a
mortgage, and it was ever thus. The one time in your life when you are
vulnerable, when you have a high amount of debt relative to your income, is
when you first take out a mortgage.[147]
4.59
The RBA also acknowledged the nature of this
risk for recent borrowers and also for lower income earners in its recent Financial Stability Review:
Among borrowers with
housing debt, those with the highest debt-servicing burdens, or the smallest
buffers on which to fall back in adverse circumstances, are often those that
have taken out loans only recently as well as lower-income households and
investors.[148]
4.60
The Consumer Credit Legal Centre (Griffith
University) advised the Committee
that it thought that there were many households who were only just managing:
High household debt
levels pose significant risks for many households and individuals... many
households are likely to be ‘only just’ managing their consumer credit
obligations, and are vulnerable to changes in individual financial
circumstances and/or economic conditions. [149]
Home equity loans and redraw
facilities
4.61
These products have been identified by the RBA on a
number of occasions as a source of possible risk to households that use them.
The RBA has observed that an increasing number of households have taken advantage
of these facilities to top up their mortgages. While this does allow households
to tap into their wealth, it does have the effect that their debt levels stay
higher for longer, leaving them exposed to changes in circumstances for longer
periods.[150]
Investor housing
4.62
The RBA has issued a number of warnings about the rapid
rise of investor housing. This sector's activity has risen dramatically in the
last decade, and investors are often highly geared. The RBA has been
particularly concerned that many new investors do not fully understand the
nature of the risks they face, which are considerably greater than for
owner-occupied housing. As the Governor told the House of Representatives Standing Committee on Economics, Finance and
Public Administration in June 2004, investors are vulnerable to a drop
in property prices:
I think there are a lot of people out there who thought they
were going to get rich but they have this asset which is costing a lot of money
to service and is not going up in price; rather it is going down, and it is
hard to find tenants.[151]
Marginal borrowers
4.63
The other group of households who are identified as
being at risk if circumstances change are those who are described as 'marginal
borrowers', who borrow outside of the normal lending limits imposed by the
banks from non conforming lenders. The RBA notes that 'if economic conditions
were to change, however, marginal borrowers are likely to be more vulnerable
and one might expect them to quickly become distressed sellers in adverse
circumstances'.[152]
Committee views
4.64
The rise of household debt in Australia
has been spectacular, but should be kept in perspective. A similar phenomenon
has been observed in many other OECD countries, and in some, the rises have
been even larger than in Australia.
The rises have almost certainly had similar causes, low interest rates in most
countries being a common feature. Persistent low interest rates in the USA
have also had effects worldwide.
4.65
Household debt of itself is neither a good nor a bad
thing. For many people, debt has provided a way to build wealth. It also allows
people to smooth out their expenditure over their lifetimes. Debt only becomes
a problem if it leads to unacceptable risks for those households who have
substantial debt or to significant misallocation of resources within the
economy.
4.66
The rises in debt that have occurred have been
unsustainable, as the RBA has been warning for some time. They have also had
some unfortunate outcomes, not the least of which is that housing has become
very expensive and is now unaffordable for all but those who appear to hold
most of the debt, that is, well established, mid-life high-income households.
Low income households and younger people are severely disadvantaged in such an
overpriced market.
4.67
Fortunately, the rate of increase has moderated,
although there are no guarantees that it will not resume where it left off.
4.68
Could the rises
have been prevented? The answer is almost certainly no, although some fiscal
policy settings such as the changes to the capital gains tax (CGT) in 1999 may
have contributed to the rises that took place. The coincident factors of
readily available finance resulting from deregulation and major reductions in
interest rates meant that demand in the housing market would inevitably
intensify, with increases in house prices an inevitable result. When the other
pro-cyclical factors of rising incomes, rising employment, increased numbers of
people seeking housing for investment purposes and wealth effects are added to
the equation, a 'perfect storm' was an inevitable result, as could be seen in
the very rapid increases in house prices that occurred.
4.69
Should government policy be changed to slow future
rises? The Committee considers that there is a case for removing some of the
pro-cyclical factors from the housing market, although caution is required to
ensure that over-reaction does not result. The Committee notes that the
Productivity Commission has recommended that the Australian Government
establish a review of those aspects of the personal tax regime that have
recently contributed to excessive investment in rental housing, with a focus on
the capital gains provisions.[153] The
Committee also notes that the Government has rejected this recommendation.
Nonetheless, the Committee considers the recommendation to have merit, as
reviewing the CGT provisions offers one of the few realistic alternatives
available for moderating the excessive demand for investment housing, a
significant distortion in the housing market.
4.70
The Committee
does not consider that it is practical or desirable to wind back the clock on
financial sector deregulation, which despite having had a number of possibly
unforeseen unexpected effects, has overall been beneficial for both the
household sector and the economy. It has led to many efficiencies and made
finance more readily, on a more equitable basis. Re-imposing limits on lending
would not gain any community support.
4.71
However, there is a case for ensuring lending is
conducted responsibly, as discussed in the previous section, where the
Committee welcomed a number of initiatives to address unsound lending
practices. The Committee believes that it is essential that the non-conforming
lending sector be subject to more stringent scrutiny of how it conducts its
business, particularly as it is in direct competition with the deposit-taking
sector which is subject to stringent prudential requirements and supervision by
APRA. The Committee considers that there is a strong case for ensuring that
conforming and non-conforming sectors face the same regulator framework,
particularly in relation to consumer protection requirements.
4.72
The Committee noted with interest a comment in the AMWU
submission that the European Central Bank sets a target for the growth of
credit in the economy equal to the product
of the desired growth in GDP and inflation, giving a rate of growth of between
4 and 5 per cent per annum, and that this target is an objective of monetary
policy. The sole objective of monetary policy in Australia is to keep inflation within the target
range.[154] The Committee has not taken
any evidence on the EU approach and is well aware that it would, if adopted in Australia, represent a major change to what overall
has been a successful policy approach. While the Committee is not advocating
that such an approach is necessarily appropriate for Australia, it suggests that the RBA should consider whether
setting a target is desirable, and how it might be achieved.
Recommendation 4
The Committee
recommends that the Government reassess its decision to reject the
recommendation of the Productivity Commission for a review of those aspects of
the personal tax regime that have recently contributed to excessive investment
in rental housing.
4.73
The Committee is encouraged by the RBA's assessment
that risks to households from rising household debt levels do not appear to be
high at present. However, there are few grounds for complacency, and the risks,
while not yet pressing, require close monitoring and in some cases, action.
4.74
The Committee is of the view that much more should be
done to educate borrowers of the risks associated with investing in real
estate; of borrowing against equity; and of borrowing at debt-to equity ratios
in excess of 80 per cent.
4.75
Furthermore, the Committee notes and supports the
findings and recommendations in the report of the Parliamentary Joint Committee
on Corporations and Financial Services titled 'Property investment advice –
safe as houses?', dated June 2005.
Recommendation 5
The Committee recommends
that through the Ministerial Council on Consumer Affairs, the State and
Territory Governments develop and pass uniform legislation for the development
of educational material focussed on the risks associated with investing in real
estate, borrowing against home equity, and of borrowing at debt-to-equity
ratios in excess of 80 per cent; and that real estate agents be required to
provide copies of this material to prospective buyers at the point of first
enquiry.
Navigation: Previous Page | Contents | Next Page