Chapter 2 - Background to Australia's
current account
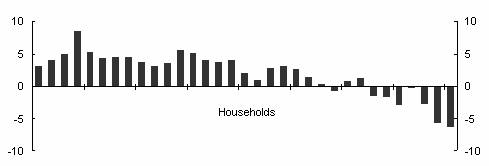
The household sector has
been borrowing (indirectly, via the banking system) from the rest of the world
to fund spending in excess of income.[2]
What is the current account?
2.1
Put simply,
the current account indicates whether a country has absorbed more goods and
services and income than has it produced.[3] A current account deficit means that
total payments exceed total receipts, while a current account surplus means the
reverse.
2.2
Another way of looking at the current account is
through savings and investment. If a country's balance on current account is in
deficit, then national investment exceeds national saving and the country is a
net recipient of investment funds from the rest of the world.
2.3
A current account deficit (CAD) is financed by
borrowing from overseas and/or by foreign equity investments in Australia.
Australia's
current account[4]
2.4
Since 1950, Australia
has had a surplus on its current account in only four years: 1950-1, 1952-3,
1956-7, and 1972-3. The other years all
recorded current account deficits. [5]
2.5
The annual balance on current account from 1959-60 to
2004-05 is shown in Table 2.1. In
2004-05 the balance on the current account was in deficit by $57.2 billion.
Table 2.1: Balance on current account, original, $billion[6]
|
Year
|
Balance on current
account, $b
|
Year
|
Balance on current
account, $b
|
|
1959-60
|
-0.5
|
1984-85
|
-11.3
|
|
1964-65
|
-0.8
|
1989-90
|
-22.7
|
|
1969-70
|
-0.8
|
1994-95
|
-28.4
|
|
1974-75
|
-1.3
|
1999-2000
|
-32.6
|
|
1979-80
|
-2.2
|
2004-05
|
-57.2
|
Source: ABS, Balance of Payments
and International Investment Position (Cat. 5302.0)
2.6
Figure 2.1 shows the movement in the balance on current
account on a quarterly basis since the September 1959 quarter, in value
terms. Both original and seasonally
adjusted figures are shown. Table 2.1
shows the annual results, while Figure 2.1 graphs the quarterly movements.
Figure 2.1: Australia's balance on current account, quarterly (September 1959 quarter to
June 2005 quarter), $m, original and seasonally adjusted
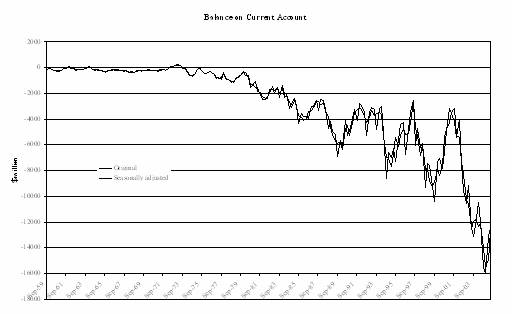
Source: ABS, Balance of Payments
and International Investment Position (Cat. 5302.0)
2.7
The current account is often expressed as a percentage
of Gross Domestic Product (GDP) to put its economic significance into context.
The CAD fluctuated between 2 and 3 per cent of GDP in the 1960s and 1970s and
between 4 and 6 per cent of GDP in the 1980s and 1990s. It has been over 5 per cent for the last 11
quarters (i.e. since the June 2003 quarter).
2.8
Australia's
balance on current account as a percentage of GDP since 1970 is shown in Figure
2.2. Over that period Australia
has recorded a deficit in every year except 1972-3.
Figure 2.2: Current account balance as a percentage of
GDP, quarterly
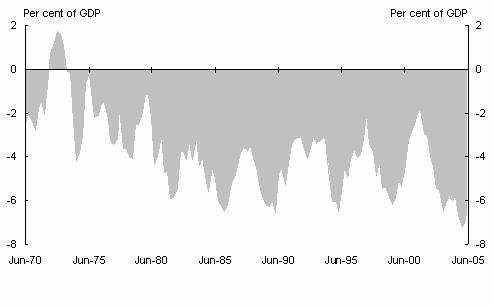
Source: Australian Bureau of Statistics (ABS)
catalogue no. 5302.0 and 5206.0.
2.9
Treasury's submission to the Inquiry explains that
there are two ways of looking at the current account - from a trade perspective
and from a savings/investment perspective.[7]
The current account from a trade
perspective
2.10
From a trade perspective, a country's current account
is the sum of its trade balance (exports of goods and services less imports of
goods and services) and its income balance (interest payments and dividends
received less paid) and current transfers. [8]
2.11
Figure 2.3 shows that the deficit in the income balance
(the broken line in the graph) has usually been bigger than the deficit in the
trade balance (continuous line) thus contributing more towards the overall
deficit in the current account. However, most of the fluctuation in the current
account has been as a result of fluctuations in the trade balance, as the net
income deficit has been relatively stable, or slowly declining, since its sharp
run up in the mid-1980s.[9]
Figure 2.3: Current account balance as a per cent of GDP,
year average
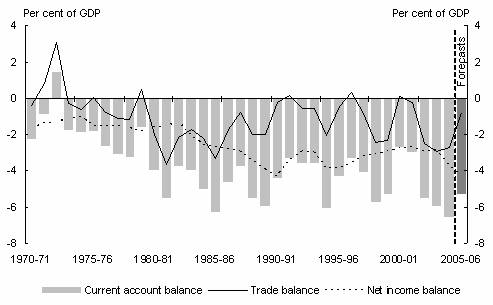
Source:
Australian Bureau of Statistics cat. no. 5302.0 and 5206.0, and
Treasury.
Australia's
trade balance
2.12
Australia
has generally run a deficit in its balance of trade - that is, it tends to
import more goods and services than it exports. Figure 2.4 shows that the gap
between imports and exports has usually been relatively small. However, the value of exports of goods and
services has exceeded the value of imports of goods and services in only 6
years since 1970.
Figure 2.4:
Australian imports and exports of goods and services, 1971 - 2005
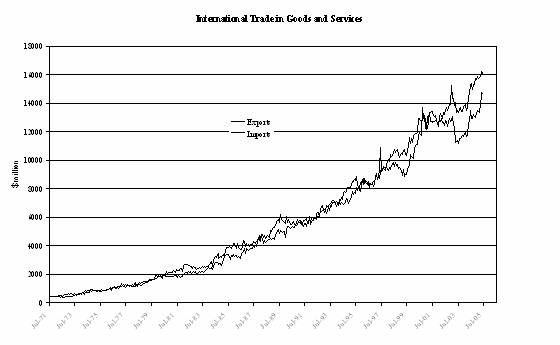
Source: ABS, International Trade in Goods and
Services (Cat. No. 5368.0). Monthly
figures are seasonally adjusted.
2.13
Small balance of trade surpluses were achieved in 1996-97
and again in 2000-01, but then significant trade deficits were recorded in
2002-03, 2003-04 and 2004-05. Figure 2.5 shows these changes on an enlarged
scale for the period June 2001 to June 2005. The trade deficit narrowed
slightly in the June 2005 quarter as higher export prices for minerals and
energy took effect and exports grew faster than imports, but then widened again
in August 2005, when exports slowed more than imports.
Figure 2.5: Australian imports and exports of goods and services, 2001
- 2005
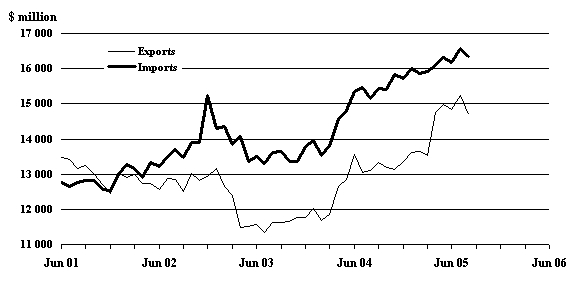
Source: ABS, International Trade in Goods and Services (5368.0)
2.14
Predictions are that export volumes of minerals and
energy commodities are beginning to pick up, as infrastructure constraints are
eased. The combination of high export
prices and higher export volumes should result in the gap between exports and
imports closing over the next few months.
2.15
The Treasury submission notes that the trade balance
tends to move with the economic cycle. When domestic demand grows faster in Australia
than in the rest of the world, import volumes tend to rise more than export
volumes and so the trade deficit becomes larger (as has happened recently).
During the recession of the early 1990s (and the slowdown around 2000), import
volumes were more subdued and the trade deficit was correspondingly smaller.[10]
Australia's
income balance
2.16
The income balance shows the annual cost of servicing Australia's
net foreign liabilities. The change over the last 20 years in Australia's
net foreign liabilities is shown in Table 2.2.
Table 2.2: Australia's net foreign liabilities[11], current prices, $billion
|
As at 30 June
|
Net foreign debt (borrowing), $b
|
Net equity liabilities, $b
|
Total net foreign liabilities, $b
|
|
1985
|
-53.1
|
-25.9
|
-78.9
|
|
1990
|
-130.8
|
-42.0
|
-172.8
|
|
1995
|
-190.8
|
-64.7
|
-255.5
|
|
2000
|
-272.6
|
-56.1
|
-328.8
|
|
2005
|
-430.0
|
-86.9
|
-516.8
|
Source: RBA monthly bulletin,
Table H5 Australia's net
foreign liabilities
2.17
Since 1950 Australia
has always had deficits in its income balance - that is, Australia
has paid more in interest payments and dividends on foreign borrowings and
foreign investment in Australia
than it has received from money Australia
has lent and invested overseas.
2.18
The main components of the income balance are payment
of interest on foreign debt (borrowings) and payments of dividends and
reinvested earnings on equity investments.
These are shown in Table 2.3.
Table 2.3: Major components of Australia's income balance at current prices, 1999-00 to 2004-05, $billion[12]
|
Year
|
Net interest payments
|
% of total
|
Other net income payments[13]
|
% of total
|
Total net income payments
|
Total %
|
|
1999-00
|
-13.4
|
74%
|
-4.8
|
26%
|
-18.3
|
100%
|
|
2000-01
|
-14.6
|
78%
|
-4.1
|
22%
|
-18.7
|
100%
|
|
2001-02
|
-13.6
|
70%
|
-5.7
|
30%
|
-19.3
|
100%
|
|
2001-03
|
-11.6
|
54%
|
-9.9
|
46%
|
-21.5
|
100%
|
|
2003-04
|
-12.5
|
53%
|
-11.2
|
47%
|
-23.7
|
100%
|
|
2004-05
|
-15.4
|
49%
|
-15.8
|
51%
|
-31.2
|
100%
|
Source: RBA Monthly Bulletin,
Table H7 Australia's service
payments on net foreign liabilities
2.19
Figure 2.6 shows how the major components of the income
balance 'net interest payments' and 'other net income payments' have changed
since 1990, on a quarterly basis.
Figure 2.6: 'Net interest payments' and 'Other net income payments',
quarterly changes, $m
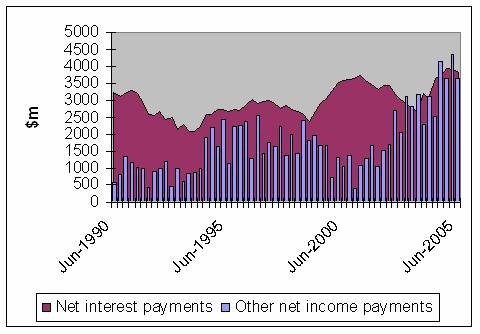
Source: RBA Monthly Bulletin,
Table H7
2.20
Until recently the 'Other net income payments'
component of the income balance (shown as bars in Figure 2.6) was less
significant than the 'Net interest payment' component within the total income
balance. However, as Figure 2.6 shows
that is changing with both components now representing about 50% each of the
total. Changes in the income balance are discussed in more detail in Chapter 3
(paras 3.49 to 3.68).
The current account from a
savings/investment perspective
2.21
The Treasury submission explains that while the CAD is
most commonly discussed from a trade perspective, it is best understood within
a saving/investment framework. [14] This is illustrated in Figure 2.7.
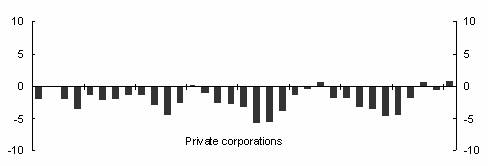
2.22
The first three panels of Figure 2.7 show ‘net
lending’ (when saving exceeds investment) or ‘net borrowing’ (when saving falls
short of investment) by government, corporations and households in Australia.
The final panel is the current account balance (which can be thought of as ‘net
borrowing’ by Australia
from the rest of the world). The numbers in first three panels add up to the
current account balance shown in the final panel.
Figure 2.7: Net lending, year average
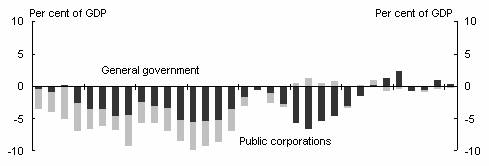
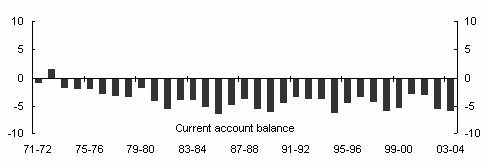
Source: Australian Bureau of Statistics cat. no.
5204.0, 5302.0 and Treasury (original data).
2.23
Figure 2.7 shows that for most of the period since 1970
the public (or official or government) sector (panel 1) was a net borrower, but
it has now become a small net lender - that is, the public sector is in overall
budget surplus.
2.24
The private sector is made up of private corporations
and households. Panel 2 in Figure 2.7 shows that while private corporations
have traditionally been borrowers, in recent years they have become net lenders
as high profits exceed investment. In
contrast, households (panel 3) have traditionally been net lenders (due to
strong savings) but in recent years they have become net borrowers. Households have been borrowing (indirectly,
via the banking system) from the rest of the world to fund spending in excess
of income.[15]
2.25
Over the past 15 years the household sector has changed
progressively from being a net lender to the rest of the economy to being a net
borrower. This reflects both an increase in household investment and a fall in
household saving (see Chapters 4 and 5 for a detailed discussion of household
debt in Australia).
2.26
The graphs in Figure 2.7 show that, from a
savings/investment perspective, since about 2000-01 Australian household
spending/debt has been the principal contributor to the current account
deficit.
How does the CAD impact on net foreign liabilities?
2.27
Australia
has nearly always had a deficit on its current account, although it wasn't
until the 1980s that these deficits were associated with a build up of foreign
debt (borrowings). Earlier deficits were relatively small and the capital
inflow to finance those deficits was largely in the form of long-term equity
investment. However, from the early 1980s the size of the average CAD almost
doubled, to 4.4 per cent of GDP, over the next 20 years.[16] Almost all the capital inflow which
financed these higher deficits was in the form of overseas borrowings rather
than equity.
2.28
While current account deficits contribute to a nation's
net foreign liabilities, the CAD for a given period does not necessarily equal
the change in net foreign liabilities that occurred over that period. For
example, in 2004-05 the current account deficit totalled $57 billion, but net
foreign debt (borrowings) increased by $35 billion and net foreign equity
increased by $11 billion, giving a total increase in net foreign liabilities of
$46 billion over that 12 months.
2.29
The relationship between the CAD and net foreign
liabilities is quite complex. A detailed
explanation is provided in Appendix 3.
How does Australia's
current account compare with other countries?
2.30
In 2004, of the 30 countries included in the bulletins
of the Organisation for Economic Cooperation and Development (OECD), thirteen
had current account surpluses and seventeen had deficits. The overall average for the OECD was a
deficit of 1.2% of GDP.[17]
2.31
Of the countries with surpluses, only Austria
(0.3%) had a current account surplus of less than 2.6%. The highest surpluses were recorded by Sweden
(8.0%), Luxembourg
(8.8%), Switzerland
(12.0%) and Norway
(13.8%).
2.32
Of the countries with a current account deficit, the
lowest was France
(0.3%) and the highest were Australia
and New Zealand
(both 6.3%), Portugal
(7.8%), Iceland
(8.1%), and Hungary
(9.4%).
2.33
Figure 2.8 (below) shows the movement in the current
account as a percentage of GDP of six OECD countries since 1970: Japan,
UK and Canada
are shown in the first panel, and the USA,
the Netherlands
and Spain in
the second panel.
Figure 2.8: Current account balance as a per cent of GDP,
quarterly, selected countries
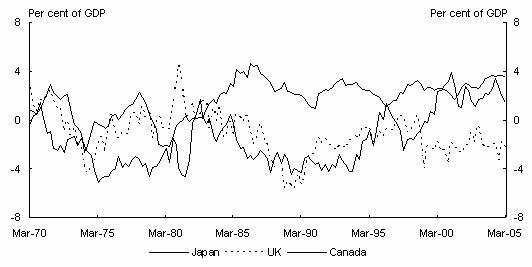
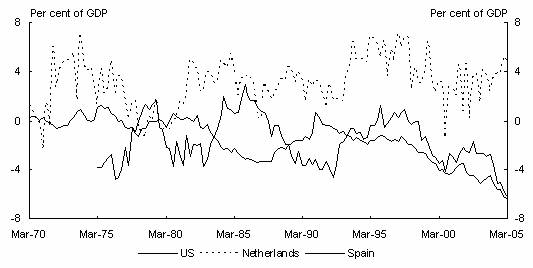
Source: OECD
Economic Outlook Bulletin
2.34
The graphs suggest that the early 1980s were a turning
point for several countries. Since then, the USA,
UK and Spain
have experienced mainly deficits in their current accounts while Japan
commenced a period of sustained surpluses. That was also the time that Australia's
average CAD stepped up to a new level (see Figure 3.2).
2.35
Canada
has had an interesting experience with its current account. After recording a number of relatively high
current account deficits in the 1970s and 1980s, in 1994 the size of the
deficits started shrinking and Canada
has recorded current account surpluses since 1999.
2.36
Given the similarities between Australia
and Canada, the
Committee feels that there may be salient lessons to be learnt from Canada's
experience.
Navigation: Previous Page | Contents | Next Page