Appendix 5 - Factors contributing to household debt
The evidence presented to
the Committee focussed on housing related debt and credit card debt. Although
opinions differ about impact of the various contributing factors, most
commentators agree that the primary factors behind the strong growth in
household debt levels include:
-
Freeing up of the financial markets, which meant
credit became much more readily available;
-
A prolonged period of low inflation and low
interest rates gave consumers a feeling of confidence in the economy;
-
Increased competition in lending, more
advertising and promotion;
-
A much wider range of products from lenders,
including lines of credit and interest-only loans;
-
The stockmarket boom in the mid-to-late 1990's
followed by the real estate boom and the ability of consumers to borrow for
investment purposes;
-
The growing acceptance of the concept of debt
used for investment as 'good debt', actively promoted by financial advisers
promoting wealth creation strategies based on investment in equities and
property;
-
Increasing financial literacy and the
realisation of the baby boomer generation that it would have to take more
responsibility for funding a comfortable retirement;
-
Rising asset values, especially in residential
real estate, which gave home owners a feeling of increased wealth (so-called
'wealth effect'), and the ability to unlock that wealth through new financial
products such as loans based on home equity;
-
A sustained period of economic growth, low
inflation, low interest rates, and falling unemployment.
Treasury sees the rise in
household debt as:
...a rational response to the deregulation of the financial
system, allowing consumers to smooth their consumption more efficiently over
their life cycle...Lower inflation, leading to lower nominal interest rates, has
also made it easier for households to borrow more.
Treasury stated that the
increased ability to borrow (which is a function of both deregulation and lower
interest rates) probably helped drive up house prices, increasing the amount
that households needed to borrow.[213]
The ANZ bank had a similar
view, stating that debt levels had been driven by 'a sustained boom in house
prices, a sustained low interest rate environment and solid growth in household
incomes'[214].
The RBA's view is that the
main reason debt has risen is that households can afford to borrow more in a
low interest rate environment. The Bank also points out that in a low inflation
environment, the real value of loans is eroded more slowly than when inflation
is high; and financial deregulation has played a significant role, increasing
lender competition and providing innovations such as home equity loans and
redraw facilities.[215]
All commentators agree
that increased investor activity in the housing market has further increased
demand in the market, contributing significantly to increases in housing prices
and household debt levels.
Some commentators consider
that banks and other finance providers may also have influenced demand by
increasing the amount of money available to the market, aggressive promotion of
lending products and allowing lending standards to slip in a bid to maintain
profits and market share. This view is disputed by lenders who maintain that
the borrowing is entirely driven by demand factors, which the lending
institutions merely find more creative ways of satisfying.
Wealth effects, whereby
households feel encouraged to spend on the basis of perceived increased wealth
resulting from increased house prices, may also have had an effect on debt
levels.
The rise in household debt
is also partly attributable to the increase in the number of additional people
who have borrowed money in response to the above factors. The RBA notes that
the number of households with owner-occupied housing debt appears to have
increased by over 40 per cent since 1996, considerably faster than the growth
in the number of households.[216]
The housing boom
As the Governor of the RBA
observed in 2003:
The story about household debt is largely a story about housing
and, of course, is intimately tied up with the subject of rising house prices.[217]
Australian house prices
are at a historical high, having more than doubled since 1996. This rise was
particularly pronounced in the period between March 2001 and March 2004, with
around 40 per cent of the rise in the last decade occurring in that period.
Figure 1 below shows the rise in house prices since March 1991.
Figure 1: Median Price Established Houses Sold ($000)
Weighted average 8 capital cities –
average of previous 4 quarters
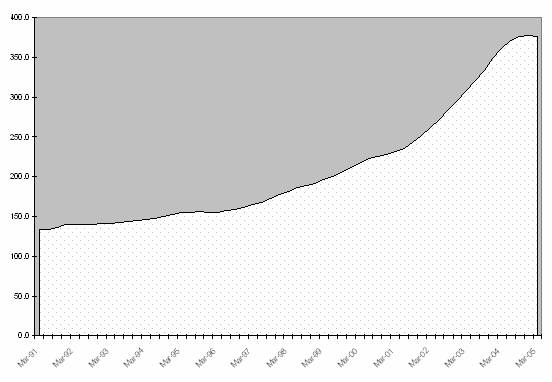
Source: Parliamentary Library
housing data derived from Real Estate Institute of Australia, Market Facts.
An alternative way of
considering the increase in house prices is to compare how much these have
changed from previous years. Figure 2 shows this change in prices as a percentage,
expressed in nominal and real terms. The graph puts the recent increases in
house prices in context, showing that this was not the first occasion when
large price movements have happened.
In the massive boom of the
late 1980s, prices increased in one year by 40 per cent. The rate of increase
has been less during the current boom, but has been sustained over a long
period. It has also been seen consistently across the country. As observed by
the Productivity Commission, 'the upswing in housing prices since the mid-1990s has been bigger and more
widespread than in previous cycles'[218].
Figure 2: House prices over the last 17 years (Nominal and real terms)
showing the percentage change from the previous year.
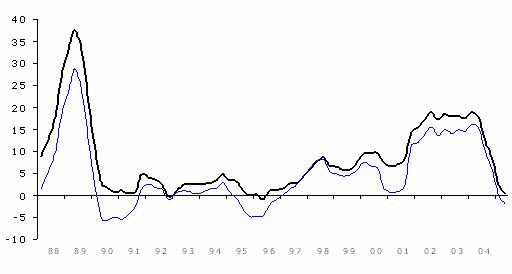
Source: ABS, reproduced from
Submission 17, ANZ Bank.
But why have house prices
risen? Housing prices behave in accordance with the basic principles of supply
and demand. Put simply, demand for housing forces prices up if supply falls
short of what the market needs. During this boom, growth in demand has
outstripped the growth in supply. Construction of new dwellings, while at very
high levels, has not kept pace with the rise in the number of households and
investors seeking to buy properties.
There is evidence that the
boom in house prices has come to an end, and that a cooling off in the market
is taking place. Treasury advised the Committee that the housing cycle is
unwinding, and that as this market cools, growth in dwelling investment and
consumer spending should ease and household saving rise.[219]
The RBA also believes that
the boom in prices for housing has come to an end in most capital cities. In
its August 2005 Statement on Monetary Policy, the RBA published the following
table (Table 1), which shows a fall in Sydney prices and low or static prices
except in Perth and Adelaide. A feature of this table is that the RBA is now
able to publish statistics that are stratified by market segment, and are a
more reliable indicator of what is happening in the market.
Table 1:
Composition-adjusted house prices – percentage change
| |
18 Months
to Dec qtr 2003 |
18 Months
to June qtr 2005 |
|
Sydney |
25 |
-7 |
|
Melbourne |
20 |
0 |
|
Brisbane |
62 |
5 |
|
Adelaide |
35 |
9 |
|
Perth |
33 |
19 |
|
Canberra |
41 |
0 |
|
Australia |
29 |
0 |
Source: RBA, Statement on monetary policy, August
2005.
The RBA also notes that
lending for housing remains above its 2004 average, but has softened in recent
months. While housing credit growth was still running at an annualized rate of
10.9 per cent in the six months to June 2005 this is half the peak rate of
2003.[220]
Deregulation of the financial system
The most fundamental
change that occurred as a result of the deregulation of the financial section
was that instead of governments attempting to regulate the operation of
financial markets through supply-side measures, demand became the main factor
influencing the amount of money borrowed. This was well summed up by the
Australian Bankers Association (ABA) in its submission:
A central tenet of the financial sector deregulation achieved in
Australia over
the past two decades has been the removal of iniquitous credit rationing that
had previously prevailed, thereby allowing policy to influence credit through
demand-side factors. [221]
Deregulation had a number of significant
effects, including:
-
removal of restrictions on lending;
-
increased competition between lenders, further
enhanced by the entry of foreign banks and non-traditional lenders into the
market; and
-
innovation increased, leading to a much wider
range of financial products becoming available to borrowers.
Enhanced competition
between lenders resulting from deregulation has also reduced borrowing costs by
putting downward pressure on interest rates and operating margins. Treasury
advised that competition within the sector has brought about a reduction of
interest rate margins from 3.6 per cent in 1994 to 1.8 per cent in 2004.[222]
Competition encouraged
innovation, leading to the introduction of financial products that are more
flexible and can be tailored to the needs of a wider group of consumers, making
them more attractive to borrowers. Developments in the mortgage market are a
good example. Treasury advised the Committee that in 1980 there were 26 types
of mortgages available and that deposit-taking institutions were the main
source of home finance. By 2003, approximately 3000 differentiated mortgage
products were available to consumers.[223]
A number of new
institutions also now offer housing finance, although banks retain 85 per cent
of the market. According to the ABA, about 10 percent of all home loans are now
provided by non-conforming lenders, that is, lenders who are not subject to
APRA's prudential supervision because they do not take deposits.[224] This group includes lenders such as
mortgage originators, of whom Aussie Home Loans is a well-known example.
Non-conforming lenders raise money by issuing securities in the money market to
raise funds for lending, a process known as securitisation.
The ABA
argued that while the market share of non-conforming lenders is still
relatively small, its influence is considerable, and has led to the
introduction into the banking sector of a number of new financial products such
as 'low-doc' loans which originated in the non-conforming sector.[225]
Mortgage brokers have also
entered the Australian housing market and have made a significant impact.
Mortgage brokers are essentially middlemen between borrowers and lenders whose
role is to find and arrange home loans for customers. The ABA told the
committee that this group now represent about 30 per cent of the housing loan
market, and their presence has exerted downward pressure on interest rates:
...I understand that
mortgage brokers constitute about 30 per cent of the market...As a result of
financial deregulation initiated by various governments, mortgage brokers are a
fact of life. They have certainly assisted in the downward pressure on interest
rates and, I guess from a customer viewpoint, they have proven to be a good
thing.[226]
Other significant
innovations in the housing loan market include mortgage insurance, which allows
a lending institution to lend where income-to-repayment ratios exceed 30 per
cent, or where the buyer has less than the required deposit; and home equity
loans, which enable a home owner to access equity and can be used for a range
of purposes including the purchase of property for investment purposes.
A natural consequence of
deregulation is that finance is available to many more people, increasing
demand. As Treasury pointed out in its submission, this increased ability to
borrow has probably helped to drive up house prices, which in turn increased
the amounts households needed to borrow.
Interest rates and inflation
Australian interest rates
have declined steadily for the last fifteen years, and have been consistently
low for most of the last decade. As shown in Figure 3, interest rates charged
by the banks for housing mortgages declined steeply from their 1989 peak of 17
per cent, and have remained low by Australian standards for most of the last
decade.
This reduction in interest
rates has a close relationship with the decline of inflation. As Treasury noted
in its submission to the inquiry, lower inflation, leading to lower nominal
interest rates, has made it easier for households to borrow more. However this increased ability to borrow
'probably helped to drive up house prices, thereby increasing the amount
households needed to borrow'.[227]
Figure 3: Housing
loan interest rate and movements in the CPI 1975 – 2005.[228]
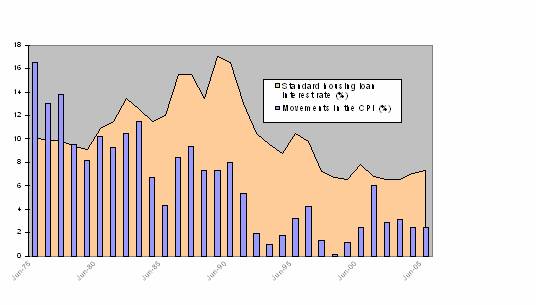
Source:
RBA
A fall in interest rates
also places mortgage finance within reach of a larger proportion of the
population, some of whom would not have previously qualified for a loan under
the income tests that lenders traditionally applied to borrowers.
The ABA
advised the Committee that traditionally, the standard income test that a bank
applies is that the monthly loan repayment should not exceed 30 per cent of
gross income. Higher income individuals may qualify for a higher ratio. This
income test is applied 'conservatively', incorporating an interest rate buffer
of one or two per cent.[229]
The Productivity
Commission quantified the increase in borrowing capacity that has resulted from
lower interest rates in its report First
Home Ownership, observing that average borrowing capacity over the last
five years was about 70 per cent higher than for the period 1983 to 1993[230].
There is evidence that the
increased affordability that results from low interest rates has also affected
buyer preferences, and many previous home owners have traded up to better,
larger homes in more desirable areas. New homes are also significantly larger
on average than houses built a decade ago. In its report First home ownership, the Productivity Commission explains this
effect succinctly:
For owner-occupiers, a halving of the interest rate almost
doubles the mortgage potentially obtainable, as well as nearly doubling the
price of a home that a home that can be 'afforded' for a given budget or
income.[231]
The RBA agrees that debt
has risen because households can afford to borrow more, but points out that a
low inflation environment also means that households hold their debt for
longer. This is because the real value of the debt is not eroded as fast as it is
in a high inflation environment. The RBA considers that these two factors (low
interest and slower debt erosion) could account for an approximate doubling of
the debt-to-income ratio.[232]
Investor activity in the housing market
Significantly higher
investment activity in the housing market is an important factor adding to
housing demand. Investor activity increases buyer competition and, as a result,
prices.
As shown in Figure 4, investment
loans as a proportion of total outstanding housing loans have grown from around
15% in 1990 to about 34% in 2005. This
growth has slowed in response to the softening of the property market since
2004.
Figure 4: Proportion of bank housing loans for investment property.
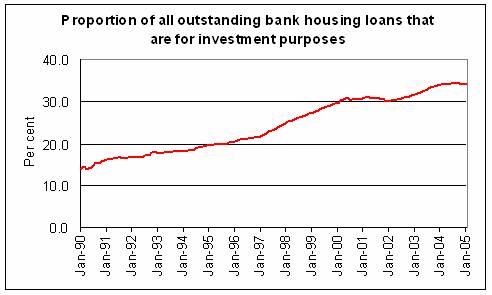
Source: Reserve Bank of Australia Bulletins.
While Australia
(70%) has roughly the same rate of home ownership as the UK
(69%), the USA
(67%) and Canada
(64%) it has a significantly higher rate of ownership of investment
property. About 13% of Australian
households receive rental income (up from about 9% a decade ago), compared with
about 6.5% in both the USA
and Canada, and
2% in the UK.[233]
The rise in property investment
appears to have been driven by a number of factors, including:
-
Perceptions that this is a profitable activity,
anticipating capital appreciation;
-
Taxation considerations (eg: negative gearing,
favourable capital gains tax treatment);
-
The availability of a range of diversified
banking products particularly suited to investors (eg home equity loans); and
-
Money more freely accessible as a result of
financial sector deregulation.
The Productivity
Commission identified a 'supportive' tax environment and aggressive marketing
of property investment 'opportunities'
among the factors that further stimulated the investor-driven component of the
demand for housing.[234]
The RBA has expressed
particular concern about the rise of investor activity in the housing market,
warning that many people were more exposed to risk than they perhaps realised.
Income and employment growth
A number of commentators,
including the ANZ and the Productivity Commission, have identified rising
household incomes and employment rates as contributing to rises in demand for
housing and price rises.[235]
In its report First Home Ownership, the Productivity
Commission pointed out that aggregate household income had increased in real
terms by 2.8 per cent a year since 1992-93, while real disposable income
increased by an average rate of 1.2 per cent per year.
In the same period, the
number of people in full time jobs increased by approximately one million, an
average increase of 1.5 per cent per year.[236]
The Commission argued that
as income and employment rise, more people have the capacity to purchase
housing, and existing owners have increased capacity to trade up to higher
quality housing if that is their preference.
The Commission's research
indicated that the link between rising incomes and employment and rising house
prices was significant, although difficult to disentangle from other demand
side factors. However, it concluded that:
Nevertheless, it seems incontrovertible that income and
employment growth have underpinned growth in housing demand in Australia
since the 1990s, which has in turn placed upward pressure on prices.[237]
Figure 5 shows the growth
in incomes and employment over the last decade. While rising incomes may have
added to the demand for housing, they have not kept pace with the rise in debt,
which increased substantially relative to income.
Figure 5: Growth in
real income and employment 1994 – 2005
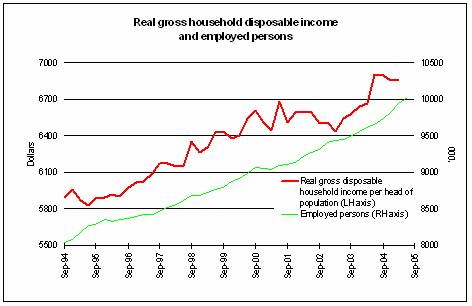
Source: ABS
Lending policies and practices of finance providers
There seems little doubt
that the lending policies and practices of banks and other financial
institutions contributed to increased demand for housing finance and thereby
household debt. However, the extent of the impact which this had is
debated. Chapter 5 of the report
explores this area in more depth.
Wealth effects
The housing boom of the
past few years resulted in substantial wealth gains in many Australian
households as existing houses were revalued upwards. The ANZ estimates that net
household wealth has increased by 45 per cent over the last three years.[238] This increase in valuations has
given rise to what commentators describe as a 'wealth effect', which is
considered to have been a factor in increasing household debt.
The Governor of the RBA, Mr
Macfarlane, described the wealth effect in
the following terms:
Recent evidence from
several countries including Australia shows that during periods when house prices
are rising rapidly households tend to react to this by increasing their
consumption faster than their income—that is, they reduce their savings. They
can do this either by reducing discretionary saving or by borrowing against the
equity in their house to finance non-housing expenditure, a process referred to
as housing equity withdrawal. This process occurred in Australia particularly in 2002 and 2003. [239]
The ANZ maintains that the
wealth effect has both monetary and psychological dimensions. In a monetary
sense, households whose property values have increased substantially are able
to tap into that wealth through a range of new loan products such as home
equity loans. From a psychological
perspective, increases in property prices make households feel wealthier and
more comfortable about dipping into savings or borrowing more.
The ANZ estimates that the
wealth effect increased household consumption growth from 4.2 per cent to 6.2
per cent for the March quarter 2004, and observed that the impact of this
effect takes up to 18 months to become fully reflected in household
consumption.[240] The ANZ's
observations are consistent with research by the RBA.
A research study conducted
by the Economic Research Department of the RBA in 2003 confirmed that the
wealth effect is significant in driving household expenditure, although the
study did not extend to whether overall debt levels increased as a result. That
study drew comparisons between stock market wealth and housing wealth:
For our preferred model, a one dollar permanent increase in
stock market wealth is estimated to increase annual consumption by 6 to 9 cents
in the long run and a similar increase in housing wealth is estimated to
increase consumption by around 3 cents. Since households' housing assets are
more than three times as large as stock market assets, our estimates imply that
a one per cent increase n housing wealth has an effect on aggregate consumption
that is at least as large as that of a one per cent increase in stock market
wealth.[241]
A manifestation of wealth effects, the use of home equity loans, has
been identified by the RBA as adding to the risks faced by those households who
use them. Households are generally acknowledged as being most at risk early in
the period of a loan, this risk being diminished as the principle is repaid and
incomes rise. The RBA has pointed out that in a low inflation environment,
households stay in this risk zone for longer because incomes rise more slowly.
The use of equity loans can further prolong the risk period as the principle
may be topped up from time to time instead of being paid out.[242]
The RBA considers that the wealth effect may have dissipated somewhat as
a result of recent developments in the housing market:
In a world where dwelling prices have stopped rising and even
declined somewhat, perceptions of ongoing rapid increases in wealth are
presumably now in the process of dissipating. This will weaken positive wealth
effects, and could possibly lead to a partial reversal in time. On the other
hand, the earlier increases in dwelling prices were very large, and even with
the latest data showing declines, a big cumulative rise in wealth has occurred
over the past decade, most of which has not been tapped. So there may yet be
some expansionary impetus in the pipeline from those earlier gains.[243]
Navigation: Previous Page | Contents