Appendix 3 - Relationship between the current account deficit and foreign liabilities[206]
Australia has nearly always had a deficit on its
current account, although it wasn't until the 1980s that these deficits were
associated with a build up of foreign debt (borrowings). Earlier deficits were
not associated with a build up of debt because the deficits were generally
lower and the capital inflow to finance these deficits was largely in the form
of long-term equity investments. From the early 1980s, however, Australia experienced persistently high current
account deficits (CAD) and almost all the capital inflow needed to finance
these deficits was in the form of overseas borrowings.
While current
account deficits contribute to a nation's net foreign liabilities, the CAD for
a given period does not have to equal the change in net foreign liabilities that
occurred over that period. For example, in round figures in 2004-05 the current
account deficit totalled $57 billion, but net foreign debt (borrowings) increased
by $35 billion and net foreign equity increased by $11 billon, giving a total
increase in net foreign liabilities of $46 billion over that 12 months.
The Valuation Effect
A current account
deficit in a given period is equal to the change in net foreign liabilities
(i.e. debt plus equity) that occurred over that period minus the valuation
effects. Valuation effects, which can be
substantial, are those changes in the value of net foreign liabilities that are
due to exchange rate movements and equity revaluations (mainly revaluations of
issued shares and securities purchased by overseas investors).
Table 1 illustrates
the relationship between the current account deficit in 2004-05 and the change
in net foreign liabilities that occurred during that 12 months.
Table 1: Relationship between CAD and net
foreign liabilities
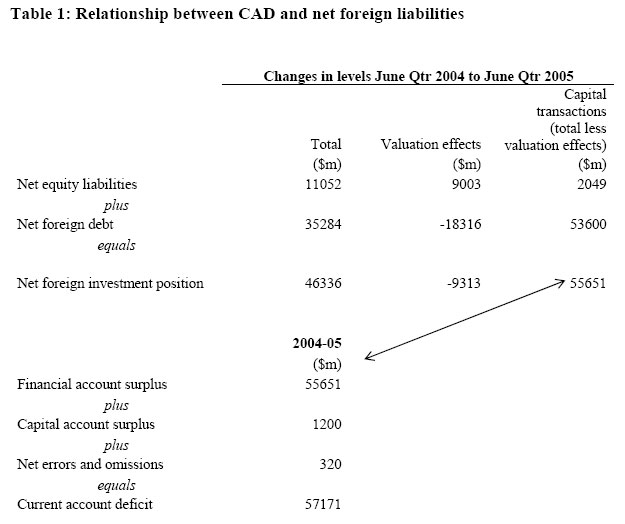
From the figures in
Table 1, Australia had a financial account surplus of $55 651 which, after adjustments, resulted
in a CAD of $57 171 million in 2004-05.
That deficit was financed by an inflow of $53 600m in debt (borrowings)
and $2 049m in equity investment. The
valuation effects during the 12 months totalled -$9 313m, so the increase in Australia's net foreign liabilities was $46 336m.
In theory a current
account deficit should equal the capital account surplus, but in practice these
items are rarely in balance and equality has to be achieved by a balancing item,
called 'errors and omissions' in Table 1.
It should also be
noted that just as current account deficits can affect the level of Australia's net foreign debt, so the cost of servicing
this debt can add directly to our current account deficit by increasing the
income deficit.
Table 2 shows the
value of the components involved in calculating the increase in net foreign
debt (borrowings) since 1988-98. Table 3 shows the same process for net foreign
equity. Table 4 shows how net foreign
debt and net foreign equity added to net foreign liabilities or Australia's net international investment position
(i.e. basically the total of Tables 2 and 3).
Table 5 shows the
adjustments made to the CAD each year to arrive at the Financial Account
Surplus figure.
Note that the
figures in Table 1 are in $ millions, but in Tables 2, 3, 4 & 5 are in
$ billions rounded
to the first decimal point.
Effect of Revisions on the Size of the Current Account Deficit
The monthly balance of payments estimates are often subject
to considerable revision.
Revisions may occur for a number of reasons, including:
-
revisions to estimates provided by a data source;
-
estimates from a more timely but less accurate
data source are replaced by estimates from a different, less timely but more
accurate data source;
-
improvements in the method of compiling the
balance of payments estimates from the data source; and
-
changes in the concepts underlying the
estimates.
A study of the monthly current account deficit figures
published over the 10 years June 1986 to June 1996 found that initial estimates
were lower than the later estimates on 55 occasions and greater than the later
estimates on 66 occasions. So there was not a great difference in the frequency
with which first estimates of the current account deficit are either
underestimates or overestimates. Moreover, the size of the revision was about
the same, being on average $219 million for a revision upward to the current
account deficit and $212 million for a revision downward to the current account
deficit.
Table 2: Components
of Annual Increase in Net Foreign Debt (borrowings), $billion
| |
Net foreign
debt at
beginning of
period |
Transactions |
Valuation effects |
Net foreign
debt at end
of period |
Total increase
in net debt |
|
1988-89 |
96.5 |
14.9 |
2.6 |
114.0 |
17.5 |
|
1989-90 |
114.0 |
16.1 |
0.8 |
130.8 |
16.8 |
|
1990-91 |
130.8 |
6.7 |
5.7 |
143.2 |
12.3 |
|
1991-92 |
143.2 |
13.6 |
5.7 |
162.5 |
19.3 |
|
1992-93 |
162.5 |
7.9 |
7.1 |
177.5 |
15.0 |
|
1993-94 |
177.5 |
4.6 |
-10.7 |
171.3 |
-6.1 |
|
1994-95 |
171.3 |
19.4 |
0.05 |
190.8 |
19.5 |
|
1995-96 |
190.8 |
10.0 |
-6.9 |
193.9 |
3.1 |
|
1996-97 |
193.9 |
12.6 |
2.2 |
208.6 |
14.8 |
|
1997-98 |
208.6 |
5.1 |
14.0 |
227.8 |
19.2 |
|
1998-99 |
227.8 |
13.7 |
-10.8 |
230.7 |
2.9 |
|
1999-00 |
230.7 |
37.9 |
4.1 |
272.6 |
42.0 |
|
2000-01 |
272.6 |
5.2 |
24.7 |
302.5 |
29.9 |
|
2001-02 |
302.5 |
38.0 |
-16.3 |
324.2 |
21.7 |
|
2002-03 |
324.2 |
45.9 |
-12.2 |
357.9 |
33.7 |
|
2003-04 |
357.9 |
51.8 |
-15.0 |
394.7 |
36.8 |
|
2004-05 |
394.7 |
53.6 |
-18.3 |
430.0 |
35.3 |
Source: ABS, Balance
of Payments and International Investment Position (Cat. No. 5302.0)
Table 3: Components of Annual Increase in Net Foreign Equity,
$billion
| |
Net foreign
equity at
beginning of
period |
Transactions |
Valuation effects |
Net foreign
equity at end
of period |
Total increase
in net equity |
|
1988-89 |
31.3 |
1.9 |
2.8 |
36.0 |
4.71 |
|
1989-90 |
36.0 |
4.9 |
1.2 |
42.0 |
6.0 |
|
1990-91 |
42.0 |
9.2 |
-2.8 |
48.3 |
6.31 |
|
1991-92 |
48.3 |
-1.4 |
-3.2 |
43.7 |
-4.6 |
|
1992-93 |
43.7 |
6.0 |
-6.1 |
43.7 |
0.0 |
|
1993-94 |
43.7 |
12.2 |
8.9 |
64.8 |
21.1 |
|
1994-95 |
64.8 |
9.0 |
-9.1 |
64.7 |
0.1 |
|
1995-96 |
64.8 |
7.9 |
8.9 |
81.4 |
16.6 |
|
1996-97 |
81.4 |
5.0 |
-4.9 |
81.5 |
0.1 |
|
1997-98 |
81.5 |
19.5 |
-31.9 |
69.2 |
-12.3 |
|
1998-99 |
69.2 |
16.4 |
5.4 |
91.0 |
21.8 |
|
1999-00 |
91.0 |
-6.8 |
-28.0 |
56.1 |
-34.9 |
|
2000-01 |
56.1 |
11.1 |
-4.1 |
63.1 |
7.0 |
|
2001-02 |
63.1 |
-18.8 |
-3.2 |
41.0 |
-22.1 |
|
2002-03 |
41.0 |
-5.6 |
34.9 |
70.3 |
29.3 |
|
2003-04 |
70.3 |
-5.9 |
11.4 |
75.8 |
5.5 |
|
2004-05 |
75.8 |
2.1 |
9.0 |
86.9 |
11.1 |
Source: ABS, Balance
of Payments and International Investment Position (Cat. No. 5302.0)
Table 4: Net
international investment position at end of period, $ billion
| |
Net foreign debt (borrowings) |
Net foreign equity |
Net international investment position |
|
1988-89 |
114.0 |
36.0 |
149.9 |
|
1989-90 |
130.8 |
42.0 |
172.8 |
|
1990-91 |
143.2 |
48.3 |
191.5 |
|
1991-92 |
162.5 |
43.7 |
206.2 |
|
1992-93 |
177.5 |
43.7 |
221.1 |
|
1993-94 |
171.3 |
64.8 |
236.1 |
|
1994-95 |
190.8 |
64.7 |
255.5 |
|
1995-96 |
193.9 |
81.4 |
275.3 |
|
1996-97 |
208.6 |
81.5 |
290.2 |
|
1997-98 |
227.8 |
69.2 |
296.9 |
|
1998-99 |
230.7 |
91.0 |
321.7 |
|
1999-00 |
272.6 |
56.1 |
328.8 |
|
2000-01 |
302.5 |
63.1 |
365.6 |
|
2001-02 |
324.2 |
41.0 |
365.1 |
|
2002-03 |
357.9 |
70.3 |
428.1 |
|
2003-04 |
394.7 |
75.8 |
470.5 |
|
2004-05 |
430.0 |
86.9 |
516.8 |
Source: ABS, Balance
of Payments and International Investment Position (Cat. No. 5302.0)
Table 5: Adjustments
involved in calculation of the current account deficit and the financial
account surplus, $ billion
| |
Financial account surplus |
Capital account surplus |
Net errors and omissions |
Current account deficit |
|
1988-89 |
16.9 |
2.0 |
0.2 |
19.0 |
|
1989-90 |
20.9 |
2.0 |
-0.1 |
22.7 |
|
1990-91 |
15.9 |
2.1 |
-0.5 |
17.5 |
|
1991-92 |
12.1 |
2.1 |
-1.0 |
13.3 |
|
1992-93 |
13.9 |
0.6 |
0.6 |
15.1 |
|
1993-94 |
16.8 |
0.3 |
-1.0 |
16.1 |
|
1994-95 |
28.4 |
0.6 |
-0.6 |
28.4 |
|
1995-96 |
17.8 |
1.1 |
2.6 |
21.5 |
|
1996-97 |
17.6 |
1.3 |
-1.3 |
17.6 |
|
1997-98 |
24.6 |
1.1 |
-3.0 |
22.8 |
|
1998-99 |
30.1 |
1.2 |
2.3 |
33.6 |
|
1999-00 |
31.1 |
1.1 |
0.5 |
32.6 |
|
2000-01 |
16.3 |
1.1 |
0.8 |
18.2 |
|
2001-02 |
19.2 |
1.0 |
0.9 |
21.1 |
|
2002-03 |
40.3 |
1.0 |
0.3 |
41.6 |
|
2003-04 |
45.9 |
1.1 |
0.8 |
47.8 |
|
2004-05 |
55.7 |
1.2 |
0.3 |
57.2 |
Source: ABS, Balance
of Payments and International Investment Position (Cat. No. 5302.0)
Navigation: Previous Page | Contents | Next Page