Chapter 5
2014–15 Budget impact on income inequality
In the same town were two men, one rich, the other poor.
The rich man had flocks and herds in great abundance; the poor man had nothing
but a ewe lamb, only a single little one which he had bought. He fostered it
and it grew up with him and his children, eating his bread, drinking from his
cup, sleeping in his arms...When a traveller came to stay, the rich man would not
take anything from his own flock or herd to provide for the wayfarer who had
come to him. Instead, he stole the poor man's lamb and prepared that for his
guest.[1]
5.1
Government policies affect income inequality. The 2014–15 Budget
(Budget) proposed multiple policy changes, which many submitters and witnesses
argued will increase the level and extent of income inequality in Australia, by
widening the gap between low income and other Australian households.
5.2
In this chapter, the committee examines certain Budget measures and their
anticipated effect on low income households. The chapter focuses particularly
on Budget measures in the Social Services portfolio, as the committee received
considerable information in relation to these changes.
Analyses of the 2014–15 Budget
5.3
On 13 May 2014, the Hon. Joe Hockey MP, Treasurer of the Commonwealth of
Australia, presented the Budget, noting that Australia (then) had '$123 billion
of deficits and $667 billion of debt'.[2]
To return to surplus and reduce the debt, the Budget presented a number of
measures that affect tax offsets and income support payments in the Treasury
and the Social Services portfolios.
Analyses conducted in May 2014
5.4
In the fortnight following its presentation, the Budget's impact on
household disposable income was analysed by Professor Peter Whiteford and Mr
Daniel Nethery from the Crawford School of Public Policy at the Australian
National University (ANU), and by Mr Ben Phillips, Principal Research Fellow
for the National Centre for Social and Economic Modelling (NATSEM) at the
University of Canberra.
National Centre for Social and
Economic Modelling
5.5
NATSEM analysed the impact of tax and benefit changes under the
Coalition Government, by estimating the distributional impact on family incomes
of the major changes effected following the 2013 Federal Election (including
those contained in the Budget).[3]
The results of the analysis show that low income families with children will be
disproportionately affected by the Budget.
Figure 5.1: Measures proposed in the Budget will disproportionately hurt
low income people
(Modelled change in disposable
income in 2014–15 by private income for various household types)

Source: Australian Council of
Trade Unions, Submission 46, p. 30, citing Phillips, B., NATSEM
Budget 2014–15 Analysis, NATSEM, University of Canberra, 26 May 2014.
5.6
NATSEM's findings in relation to the immediate impact of the Budget on
households were summarised as follows:
The burden on families for 2014–15 falls most heavily on low
and middle income families with children. The impact on high income families
with children is smaller in dollar terms and [percentage] terms. Across all
families (including singles and couples without children) the dollar impact
varies by income level without a clear pattern. In percentage terms,
the impact is clearly felt by the low income families more than high
income families.[4]
5.7
NATSEM's analysis also revealed that, within three financial years,
the Budget will not negatively impact high income earners. In contrast,
measures in the Budget which are not temporary (for example: indexation,
payment rates, eligibility thresholds) will continue to affect low income
earners.[5]
Figure 5.2: The effect on low income earners grows: the effect on high
income earners disappears
(Modelled change in disposable
income in 2017-18 by private income for various household types)

Source: Australian Council of
Trade Unions, Submission 46, p. 31, citing Phillips, B., NATSEM
Budget 2014–15 Analysis, NATSEM, University of Canberra, 26 May 2014.
5.8
NATSEM reported:
The burden on families of the 2014–15 budget is quite clear
by 2017–18 once all grandfathering arrangements are removed and the deficit
levy is removed. Low income couples with children (bottom 20 per cent) are
worse off by around 6.6 per cent while single parents are worse off by around
10.8 per cent on average. High income families are marginally better off thanks
to the carbon price removal.[6]
5.9
The Australian Council of Trade Unions (ACTU) submitted that the
inequitable effect of the Budget can be seen most clearly in Figure 5.3,[7]
which shows the greatest mean change in disposable income for the lowest income
quintile in both 2014–15 and 2017–18.
Figure 5.3: The Budget affects low income earners the most
Mean change in disposable income by
quintile as a result of the 2014 Budget in 2014–15 and 2017–18

Source: ACTU, Submission
46, p. 32, citing Phillips, B., NATSEM Budget 2014-15 Analysis,
NATSEM, University of Canberra, 26 May 2014.
Australian National University
5.10
The ANU replicated the methodologies used in previous editions of the
Budget Overview, to calculate the disposable income of households in different
family situations and at different income levels, contrasting this income with
its 2016-17 value, with and without the proposed Budget changes.[8]
Professor Whiteford and Mr Nethery found that 'people on benefits do the
heaviest lifting':
An unemployed 23‑year-old loses $47 per week or 18 per
cent of their disposable income. An unemployed lone parent with one 8-year-old
child loses $54 per week or 12 per cent.
Lone parents earning around two-thirds of the average wage
lose between 5.6 to 7 per cent of their disposable income. A single-income
couple with two school-age children and average earnings loses $82 per week or
6 per cent of their disposable income.
Compare this to the $24, or less than 1 per cent of disposable
income paid through the Deficit Levy by an individual on three times the
average wage–close to $250,000 by 2016–17. High-income couples could together
bring in up to $360,000 per year and not contribute an extra cent.[9]
Treasury analysis released in August
2014
5.11
On 1 August 2014, Treasury released its 'Final Distributional Analysis
for 2014–15 Budget'. This analysis revealed findings similar to those of the
ANU and NATSEM:[10]
the Budget will reduce the average cash transfer for lower income groups by a
greater amount than for higher income groups.[11]
5.12
Associate Professor Roger Wilkins from the Melbourne Institute of
Applied Economic and Social Research commented on Treasury analysis having been
discovered under Freedom of Information processes. Professor Wilkins considered
that such analysis should be routinely conducted and made available by Treasury:
[A]s a matter of course much more detailed analysis of the
implications for the income distribution of policy measures should be produced.
It is in the interests of transparent government that that be done. Obviously,
there are some resource issues with doing that additional analysis. I think the
importance warrants it.[12]
5.13
Professor Whiteford and Mr Nethery directly attributed the conduct of
the ANU analysis to the omission of this information from the Budget papers,
noting:
The absence of estimates of distributional impacts is striking,
given that since 2004–05, the Budget Overview has each year contained an
Appendix showing how much different types of households have gained from policy
changes announced in the Budget or over the course of the period of government.
Showing losses is not as politically attractive as showing increases in
disposable income, however.[13]
5.14
In response to Professor Wilkins' suggestion, Treasury advised that the
Australian Bureau of Statistics (ABS) comprehensively measures the impact of
budget measures on distribution every five years:
What that does is what we call fiscal incidence analysis. So
it actually takes a look at: what is the distributional impact of the budget,
as far as possible, in total? So it takes account of not only the tax transfer
system but also the provision of direct services by governments...when you look
at the distributional impact of the budget it is redistributing from the top
two quintiles to the bottom two quintiles in the broad. That is comprehensive
work. It takes a number of years afterwards for it to be published. The next
dataset which they use for this, the household expenditure survey, is going to
be conducted in 2015–16. It will take until 2018, we expect, to actually
publish it.[14]
5.15
The Treasury representative concluded that it would not be feasible for
the department to publish a comprehensive view of the impact of a single
budget. Further, Treasury could not improve on the ABS's work:
...were we to do it each year it would not change very much,
because, except very exceptionally, the changes that are in a budget are quite
marginal compared with the base.[15]
National Centre for Social and
Economic Modelling September 2014 analysis
5.16
In October 2014, NATSEM released further research into the
distributional and regional household effects of the main 'hip-pocket' Budget
measures. The regional results found that, although 'relatively modest and
evenly spread for 2014–15', from 2015–16 the regional impacts become 'more
substantial and more unequal' as social security measures take effect:
By 2017–18 with the budget repair levy no longer applying the
impacts are felt almost entirely by low income regions of Australia. The
'Coalition impacts', on average, across all income unit types, range from a
small positive impact in high income inner city suburbs to around $1,600 per
annum in low income suburbs in Western Sydney and Northern Melbourne. These
impacts are magnified when the analysis is only for families with children
where the impacts are, on average, up to $3,371 per annum in some Northern
Melbourne suburbs.[16]
5.17
Table 5.1 below shows that families with children in
Campbellfield-Coolaroo, Broadmeadows and Thomastown (outer northern Melbourne)
are the most affected by the Budget measures. The annual impact in these low
income suburbs varies from $3 098.30 to $3 371.20 (4.1 to 4.4 per
cent of their disposable income). The least affected suburbs are high income
mining towns and high income city suburbs. For example, Forrest in
Canberra has a positive impact of $48.30 per annum. Each of the least affected
suburbs has an impact that is negligible relative to its income level.
Table 5.1: SA2 Impact on family disposable income, Families with children,
Australia
|
Largest
Impact
|
|
Rank
|
SA2 (Suburb)
|
Annual $ Impact
|
% Disposable
Income
|
|
1
|
Campbellfield–Coolaroo
|
-3371.2
|
-4.1
|
|
2
|
Broadmeadows
|
-3120.7
|
-4.4
|
|
3
|
Thomastown
|
-3098.3
|
-4.1
|
|
4
|
Ashcroft–Busby–Miller
|
-3065.7
|
-3.7
|
|
5
|
Mount Druitt–Whalan
|
-2886.4
|
-3.9
|
|
6
|
Meadow Heights
|
-2862.3
|
-3.1
|
|
7
|
Clayton South
|
-2857.3
|
-3.5
|
|
8
|
Springvale South
|
-2852
|
-3.3
|
|
9
|
Parramatta–Rosehill
|
-2813.8
|
-3.6
|
|
10
|
Guildford–South Granville
|
-2812.7
|
-3.8
|
|
Smallest Impact
|
|
2050
|
Wahroonga–Warrawee
|
-394.2
|
-0.33
|
|
2051
|
Aranda
|
-353.9
|
-0.2
|
|
2052
|
Paddington–Moore Park
|
-337.6
|
-0.3
|
|
2053
|
Rose Bay–Vaucluse–Watsons Bay
|
-336.2
|
-0.2
|
|
2054
|
Cottesloe
|
-328.2
|
-0.2
|
|
2055
|
City Beach
|
-327.6
|
-0.2
|
|
2056
|
Chapman
|
-315
|
-0.2
|
|
2057
|
Nhulunbuy
|
-219.8
|
-0.2
|
|
2058
|
Newman
|
-199.9
|
-0.2
|
|
2059
|
Forrest
|
48.3
|
0
|
Source: Ben Phillips, National
and Regional Analysis of the 2014–15 Federal Budget, NATSEM, University of
Canberra, September 2014, p. 19.
5.18
In its analysis, NATSEM specifically reported that the regional affects
for South Australia mirror those of the rest of country. Table 5.2 shows the
budget affects for South Australian suburbs for families with children.
The most affected suburbs are The Parks ($2,760.90 per year, 3.5 per cent
of disposable income) and Elizabeth, North Adelaide ($2,561.60 per year, 3.6
per cent of disposable income). The least affected suburbs are Walkerville
($768.30 per annum) and Aldgate-Stirling ($806.60 per annum). NATSEM stated
that the smallest impact suburbs have relatively high incomes.[17]
Table 5.2: SA2 Impact on family disposable income, Families with children,
South Australia
|
Largest Impact
|
|
Rank
|
SA2 (Suburb)
|
Annual $ Impact
|
% Disposable
Income
|
|
1
|
The Parks
|
-2760.9
|
-3.5
|
|
2
|
Elizabeth
|
-2561.6
|
-3.6
|
|
3
|
Smithfield–Elizabeth North
|
-2399
|
-3
|
|
4
|
The Coorong
|
-2276.7
|
-3.2
|
|
5
|
Yorke Peninsula–South
|
-2205.1
|
-3.2
|
|
6
|
Salisbury
|
-2169.5
|
-2.4
|
|
7
|
Salisbury North
|
-2163.6
|
-2.4
|
|
8
|
Goolwa–Port Elliot
|
-2158.4
|
-2.6
|
|
9
|
Enfield–Blair Athol
|
-2143.8
|
-2.4
|
|
10
|
Davoren Park
|
-2117.2
|
-2.2
|
|
Smallest Impact
|
|
152
|
Belair
|
-940.4
|
-0.7
|
|
153
|
Clarendon
|
-925.6
|
-0.7
|
|
154
|
Goodwood–Millswood
|
-904.4
|
-0.7
|
|
155
|
Roxby Downs
|
-904.2
|
-0.7
|
|
156
|
Hahndorf–Echunga
|
-901.8
|
-0.7
|
|
157
|
Coromandel Valley
|
-900.6
|
-0.7
|
|
158
|
Toorak Gardens
|
-880.9
|
-0.7
|
|
159
|
Glenside–Beaumont
|
-812
|
-0.6
|
|
160
|
Aldgate–Stirling
|
-806.6
|
-0.6
|
|
161
|
Walkerville
|
-768.3
|
-0.6
|
Source: Phillips, B., National
and Regional Analysis of the 2014–15 Federal Budget, NATSEM, University of
Canberra, September 2014, p. 20.
Submitters' and witnesses' views on
analyses of the Budget
5.19
Submitters and witnesses referred to the independent and government
analyses of the Budget, and agreed that the Budget will negatively affect
people on low incomes, with consequent impacts on inequality in Australia.[18]
5.20
Associate Professor Gerard Redmond, Leader of the Australian Child
Wellbeing Project, School of Social and Policy Studies at Flinders University,
said:
Lots of factors can influence children's and young people's
wellbeing in the present and their opportunities in the future. One such factor
is money. Money can make a difference in young people's lives. Policies that
reduce financial support to low-income families will...exacerbate inequalities in
income now and inequalities in young people's opportunities in the future.[19]
5.21
Dr John Falzon, Chief Executive Officer from St. Vincent de Paul Society
National Council, described the 'battle against inequality at the beginning of
the 21st Century' as follows:
We are still coming to grips in Australia with the federal
budget, including measures that would rip the guts out of what remains of a
fair and egalitarian Australia like forcing young people to live on fresh air
and sunshine for six months of every year, forcing them to rely on charity or
to survive through crime—as if this was going to address the structural causes
of unemployment. It is not charity that young people, or older people for that
matter, or people with a disability or single mums should have to count on. It
is justice they should be able to count on...
We have only one enemy—and it is called inequality. It is that
meanness of spirit entailed in taking the little that people who are living in
poverty have in order, supposedly, to reduce the deficit. It is taking the lamb
away from the poor man instead of drawing on the flocks and herds in abundance
by sustainably and fairly taxing those who can afford it, including the
corporates. As even the [Organisation for Economic Co-operation (OECD)] points
out: you do not build a strong economy by increasing the level of inequality;
you do not create a strong country on the backs of the already poor.[20]
5.22
The ACTU commented that Australia's level of pre-tax, pre-transfer
inequality is lower than in many OECD countries (Gini 0.46). However, the
post-tax, post-transfer inequality (Gini 0.32) is higher than in other
developed countries. Further, the extent of Australia's redistribution (Gini
0.14) is lower than most OECD countries.[21]
Figure 5.4: Countries with similar levels of pre-tax inequality can have
very different post-tax inequality
(Gini coefficient before and after
direct taxes and cash transfers in OECD countries)

Note: The data are the latest
available for each country; for most countries this is 2011.
Source: ACTU, Submission
46, p. 27, citing OECD.StatExtracts, 'Income Distribution and Poverty', http://stats.oecd.org/Index.aspx?DataSetCode=IDD
(accessed 11 November 2014).
5.23
Professor Keith Jacobs from the University of Tasmania described
Australia's position among the OECD countries as:
...not at the top end and...not at the very, very bottom. There
are other countries like the United States [Gini 0.39] which actually have a
far worse redistribution than we do. But...we are slipping back, and the politics
that are now being pursued I think are actually regressive and will take us
back into a darker period rather than one that is going to be a progressive
one.[22]
5.24
The ACTU submitted that Australia is 'a low-tax, low-spending country'
and consequently, 'a low redistribution, somewhat high inequality country'.[23]
The ACTU contended that the Budget will increase the inequality as it further
reduces the amount of redistribution:
The impact of the Budget cuts on households is clear. Most
households will suffer a reduction in disposable income as a result of the
Budget. Lower income households will generally suffer the largest cuts in
income. The inequity of the impact on households will grow over time.[24]
5.25
In evidence, Mr Phillips advised that budgets do not normally affect
income inequality to a significant extent. However, separate to its Budget
analyses, NATSEM examined the Gini coefficient in Australia, finding that
it has increased as a result of the Budget:
From this budget it has moved from 0.3277 in our STINMOD
model to 0.335. That may not mean a lot to a lot of people, but to put that
into perspective...According to the ABS stats it has increased from about 0.3 to
0.32 over the last couple of decades. Roughly, in this budget alone there
is an impact of about 40 per cent of that entire increase in the change in income
inequality.[25]
2014–15 Budget measures in the Social Services
portfolio
5.26
Submitters and witnesses commented on specific Budget measures in the
Social Services portfolio (for example: changes to Family Tax Benefit,[26]
the annual indexation applied to HELP debts,[27]
and CPI indexation for various benefits[28]).
This section of the report examines only a selection of the Budget
measures, commencing with the primary concern underpinning submitters' and
witnesses' opposition to the measures: that is, the measures will exacerbate
income inequality and further impoverish individuals and families on low
incomes.
Henderson Poverty Lines
5.27
In Australia, poverty is commonly measured using the Henderson Poverty
Lines (HPLs),[29]
which are designated income levels for various types of income units (such as
employed or unemployed couples, with or without children). The HPLs are updated
every three months using an index of per capita household disposable income,
based on estimated data provided by the ABS. Table 5.3 below shows the
HPLs for income units in the June Quarter 2014.
Table 5.3: Poverty Lines: Australia, June Quarter, 2014a, b
|
Income Unit
|
Including Housing ($pw)
|
Other than Housing
($pw)
|
|
Head in workforce
|
|
Couple
|
681.61
|
498.53
|
|
Couple plus 1
|
819.33
|
619.69
|
|
Couple
plus 2
|
957.05
|
740.85
|
|
Couple plus 3
|
1094.77
|
862.02
|
|
Couple plus 4
|
1,232.49
|
981.84
|
|
Single person
|
509.53
|
342.91
|
|
Single parent plus 1
|
654.14
|
470.96
|
|
Single parent plus 2
|
791.77
|
592.13
|
|
Single parent plus 3
|
929.49
|
713.29
|
|
Single parent plus 4
|
1,067.21
|
834.45
|
|
Head not in workforce
|
|
Couple
|
585.24
|
402.06
|
|
Couple plus 1
|
722.96
|
523.32
|
|
Couple plus 2
|
860.68
|
644.48
|
|
Couple plus 3
|
998.40
|
765.64
|
|
Couple plus 4
|
1,136.12
|
885.46
|
|
Single person
|
413.16
|
246.54
|
|
Single parent plus 1
|
557.67
|
374.59
|
|
Single parent plus 2
|
695.39
|
495.75
|
|
Single parent plus 3
|
833.11
|
616.92
|
|
Single
parent plus 4
|
970.83
|
738.08
|
Note: (a) Based on seasonally
adjusted household disposable income per head per week for the June quarter
2014 of $810.18. (b) All figures refer to income after tax. Source: Melbourne
Institute of Applied Economic and Social Research, The University of Melbourne,
Poverty Lines: Australia, June Quarter 2014, p. 1.
5.28
Poverty Lines: Australia, the newsletter that updates the HPLs,
also compares the poverty lines with maximum welfare payments for income units.[30]
Table 5.4 shows the comparison for the June Quarter 2014.
Table 5.4: Comparison of Henderson Poverty Lines with the income of adults
who receive maximum welfare payments and have no other income, June Quarter 2014
(Per capita household disposable income = $810.18 per week)
|
|
Basic Payment of Person
1 g
|
Basic Payment of Person
2 (Partner) g
|
Family Tax Benefit
Part A
|
Family Tax Benefit
Part B
|
Rent Assistance
|
Total
Income h
|
Poverty Line i
|
|
Married couple
|
|
Allowee
a
|
230.45
|
230.45
|
0.00
|
0.00
|
59.40
|
520.30
|
681.61
|
|
Pensioner b
|
312.40
|
312.40
|
0.00
|
0.00
|
59.40
|
684.20
|
585.24
|
|
Couple
with 1 child c
|
230.45
|
230.45
|
86.10
|
24.89
|
73.99
|
645.88
|
819.33
|
|
2 children
|
230.45
|
230.45
|
172.20
|
24.89
|
73.99
|
731.98
|
957.05
|
|
3 children
|
230.45
|
230.45
|
264.32
|
47.02
|
83.65
|
855.89
|
1094.77
|
|
4 children
|
230.45
|
230.45
|
382.34
|
47.02
|
83.65
|
973.91
|
1232.49
|
|
Single adult
|
|
Allowee
d
|
255.25
|
-
|
0.00
|
0.00
|
63.20
|
318.45
|
509.53
|
|
Pensioner e
|
414.45
|
-
|
0.00
|
0.00
|
63.20
|
477.65
|
413.16
|
|
Single
with 1 child f
|
356.60
|
-
|
86.10
|
51.10
|
73.99
|
567.79
|
557.67
|
|
2 children
|
356.60
|
-
|
172.20
|
51.10
|
73.99
|
653.89
|
695.39
|
|
3 children
|
356.60
|
-
|
264.32
|
73.22
|
83.65
|
777.79
|
833.11
|
|
4 children
|
356.60
|
-
|
382.34
|
73.22
|
83.65
|
895.81
|
970.83
|
Source: Information booklets on benefits and allowances are published quarterly by
Centrelink. The booklets provide details of eligibility criteria and rates of payment for all income
support and non-income support payments made by Centrelink on behalf of the Australian Government Departments of Families, Housing, Community Services and Indigenous Affairs and Education, Employment and
Workplace Relations.
Notes:
- A married couple without children
receiving Allowances is assumed to be receiving Newstart Allowance.
- A married couple without children receiving
Pensions is assumed to be receiving the Age Pension or Disability Support Pension.
- A married couple with children receiving
Allowances is assumed to be receiving Newstart Allowance
or Parenting Payment Partnered.
- A single person receiving an Allowance
is assumed to be receiving Newstart Allowance.
- A single person receiving a Pension
is assumed to be
receiving the Age Pension or the
Disability Support
Pension.
- A sole parent is assumed
to be receiving Parenting Payment Single.
- All basic payments for Pensioners include the maximum applicable Pension Supplement.
- Total income is the sum of allowances, pensions and benefits for persons
who have no other income.
Income figures do not include Clean Energy Advance payments. To be comparable with the poverty
lines, total income reported should be net of personal income tax. However, allowing for offsets/rebates, no income tax would
be payable for welfare recipients who received no other income. Hence, direct comparisons of
total income with the poverty lines are
valid.
- Poverty lines for single persons and married couples with up to four children are shown
here, inclusive of housing costs. For recipients of allowances, the income unit head is assumed
to be in the workforce, since recipients of the most common allowance, Newstart Allowance, are usually
required to search
for employment to be eligible for payment. For pensioners and sole parent families, costs are based on poverty lines for income
units where the head is not in
the workforce.
Source: Melbourne Institute
of Applied Economic and Social Research, The University of Melbourne, Poverty
Lines: Australia, June Quarter 2014, p. 3.
5.29
According to the current HPLs, many Australians who receive income
support payments are living in poverty. Couples with children fare the worst,
receiving up to $258.58 per week below the poverty line. Childless couples and
singles are, respectively, living on $161.31 and $191.08 per week below the
poverty line. Single parents with two or more children are receiving up to
$75.02 below the poverty line on a weekly basis. Singles and couples on
pensions, as well as single parents with one child, are the only welfare
recipients to rise above the poverty line.
The Budget and its effect on
employment
5.30
Submitters and witnesses argued that Newstart Allowance and Youth
Allowance are currently below the poverty line. A key concern throughout the
inquiry was the changes associated with these two allowances, as well as the new Work for the Dole programme and new policy Stronger
Participation Incentives for Job Seekers under 30, all of which, it
was contended, will further negatively impact students and unemployed people.
Newstart Allowance
5.31
Newstart Allowance provides income support to persons who are looking
for paid work.[31]
At present, the basic rate ranges from $465.50 per fortnight
(partnered, each) to $720.30 per fortnight (single principal carer granted
an activity test exemption). The basic rate for a single person with no
children is $515.60 per fortnight.[32]
5.32
The ACTU submitted that the income of a single adult Newstart Allowance
recipient is more than $100 per week below the HPL. Newstart Allowance is also
less than one‑half of median income, which was $1,453.90 per week as at
May 2014.[33]
The ACTU noted that the allowance was relatively higher 20 years ago:
In the mid-1990s, Newstart was equal to 50% of median income
poverty line; now a single adult reliant on Newstart has an income that is
barely two-thirds the level of the poverty line. The decline relative to the
Henderson line has been of a similar magnitude.[34]
Figure 5.5: Newstart, the Henderson Poverty Line, and the 50 per cent of
median income poverty line

Source:
ACTU, Submission 46, p. 42.
5.33
The ACTU submitted that the gap between Newstart Allowance and the poverty
line is large and growing: 'This is a strong indication that the payment rate
is inadequate'.[35]
In support of this conclusion, the ACTU referred also to the findings of the
Low Cost Budget Standard (an alternative measure of standards of living that
guides decisions regarding the adequacy of income support payments), and the
incidence of financial stress and deprivation among payment recipients,
compared with that experienced by other groups.[36]
5.34
A recent study undertaken by Dr Alan Morris and Dr Shaun Wilson
documented the circumstances of Newstart Allowance recipients in inner Sydney.
The study found that the payment rates adversely affected recipients'
physical and mental health, housing and social life, as well as their re‑entry
into the workforce.[37]
One survey respondent stated:
...$260 a week...is completely insufficient financially to
live a normal healthy existence and look for work. By that I mean maintain
interview clothes...appearance and health that is going to be acceptable at an
interview situation; pay for transport, rent, electricity, phone, food for
example. There's simply not enough money...Putting someone on a drip feed of
$20 a week is not going to do anything for them. Whereas if I could have
continued on [a decent income] I would have found another job within months.
Really fast. With the same levels of support that I was used to and could cope
with...Sometimes I've had to walk to interviews, like kilometres, without a
cent in my pocket, and hungry. This is a system that is unfortunately, so
self-perpetuating[.][38]
5.35
UnitingCare Australia, which was among stakeholders consulted by the
Reference Group currently reviewing Australia's welfare system,[39]
suggested that the adequacy of income support payments is not a focus of the
review.[40]
However, a representative from St. Vincent de Paul Society National Council
said:
...there was virtual unanimity amongst the people...at that
consultation in saying that [the inadequacy of Newstart payments] is the most
essential place to start—that people are not being forced to live below the
poverty line while needing to rely on the social security system.[41]
Youth Allowance
5.36
Submitters and witnesses also questioned the adequacy of the lower Youth
Allowance, which will be the applicable benefit for unemployed people under 25 years,
from 1 January 2015 if the Government's legislation is passed.[42]
The basic rate of Youth Allowance currently varies from $226.80 to $720.30 per
fortnight (exclusive of Rent Assistance), dependent upon the recipient's
personal circumstances.[43]
5.37
Submitters and witnesses argued that these payment levels will increase
poverty.[44]
For example, the ACTU submitted that 'pushing more young people onto this
allowance will do nothing for the effectiveness of their job search and will
merely increase their poverty'.[45]
5.38
Similar to the ACTU's comments in respect of Newstart Allowance,
the National Union of Students (NUS) stated that the Tertiary Assistance
Education Scheme (the forerunner of Youth Allowance and Austudy) was
'more generous than current programs', submitting that, when introduced in
1974:
The full payment for a single person living away from home in
a share house was 75% of the Henderson Poverty Line (the equivalent figure for
current Youth Allowance including rent assistance is 48.8% of the poverty
line).[46]
5.39
Each year, the NUS publishes a table of maximum student benefits,
compared with the relevant HPL. The 2014 calculations show that benefits are
below the poverty line (ranging from 27 per cent to 77.8 per cent) and that, in
some cases, the percentage decline of those benefits is from 4.3 per cent to
8.4 per cent from its 2008 value.[47]
Based on these findings, the NUS suggested that the basic rate and Rent
Assistance should be increased to at least 100% of the HPL for Youth Allowance,
Austudy and Abstudy.[48]
Stronger Participation Incentives
for Job Seekers under 30
5.40
If the Government's legislation is passed,
from 1 January 2015 people under the age of 30 years making a
new claim for Newstart Allowance and Youth Allowance (Other) will be required to
demonstrate job search and participation in employment services support for six
months before receiving payments. After six months, new payment recipients will
also be required to participate in 25 hours per week Work for the Dole, and
possibly a further six months in employment services. The new arrangements will
apply to existing payment recipients from 1 July 2015.[49]
5.41
NATSEM estimated that the measure 'would increase the household impact
on families in its [May analysis of the Budget] by a further 13 per cent'.[50]
Throughout the inquiry, submitters and witnesses agreed that the new policy
will increase inequality, by causing and entrenching poverty among unemployed
youth.[51]
5.42
Mr Mark Henley, Chief Executive Officer of Queensland Council of Social
Service (QCOSS), said that the measure will further marginalise unemployed
youth:
If you look at those communities which have high levels of
unemployment and experience lower levels of income, you see that this will
affect not only those youth but also those families and those communities and
you will see a further driving of inequality in Australia.[52]
5.43
A representative from the Victorian Council of Social Service said:
I am not sure where [people] are meant to live during that
time when they have no income and if they do not have close family or people to
support them...They have no hope. Not only is it morally wrong and socially wrong
but it will cost us more in the long run as well, because we are going to have
this whole cohort of young people, whom we should give every chance to step up,
and whom we are going to lose because they are not going to have a way to eat,
a way to live and, instead, they will make a significant call on community
agencies for basic emergency relief.[53]
5.44
At Senate Budget Estimates 2014–15, the Department of Social Services
estimated that 550 000 job seekers over four years would need to access
emergency relief as a result of the measure.[54]
Using the Department's estimate, the Tasmanian Council for Social Service
calculated that approximately 16 500 requests for assistance will be made
in that state alone. Further:
Since the bulk of money received by low income earners is
spent in the local economy on essential goods and services, the loss of income
to jobseekers translates into a loss of income to the Tasmanian economy.
We estimate that the total loss of income experienced by Tasmanians
affected by Newstart suspensions over the next four year period to be around
$85 million.[55]
5.45
The ACTU described the Strong Participation Incentives for Job Seekers
under 30 as 'arguably the most punitive and objectionable measure in the
Budget':
There is no case for such a policy at any time. However, it
is especially troubling that the measure has been introduced at a time when
unemployment, and youth unemployment, are at their highest levels in over a
decade. The latest ABS labour force data for July 2014 has unemployment now at
6.4%. Youth unemployment is more than double that at 14.1%. There are now
789,000 unemployed Australians.
At the same time, there are now only 146,100 job vacancies.
The Government's own research shows the number of skill shortages is at an
'historical low'. There are generally large and growing fields of applicants
vying for skilled jobs[.][56]
5.46
The NUS' representative advised:
The unemployment rate for students graduating is about
3.4 per cent. That is a significant proportion of the population and a
significant proportion of unemployed Australians. Another problem many
graduates face is underemployment. Earlier this year Graduate Careers Australia...released
a report that said that only 71 per cent of graduates were finding full-time
work within four months of graduating...The concern that we have with regard
to the Newstart payment is that once these often highly skilled graduates enter
the workforce and cannot find employment immediately they are effectively being
locked out of income support. Many of them do not have particularly good
relationships with their parents or cannot rely on their parents for financial
reasons...It would be very concerning for us to see graduates like that plunge
into poverty for no good reason aside from the fact that the job market is very
unstable.[57]
5.47
The ACTU stated that the new policy 'panders to prejudices about the
unemployed, suggesting that those not fortunate enough to be in work are to
blame for their predicament'. Further, it is predicated on the belief that the
unemployment benefit acts as a disincentive to finding paid work (rather than
acting as an essential support).[58]
Several witnesses disputed this belief, stating that the social security system
does not cause unemployment, with most people on benefits preferring to be in
paid work.[59]
Work for the Dole
5.48
The Budget proposes to expand the Work for the Dole programme. From 1 July
2014 to 30 June 2015, Work for the Dole will be mandatory in 18 of the 21
Priority Employment Areas for 'all job seekers aged between 18 and 30 years old
who are in the Work Experience Phase or the Compulsory Activity Phase of Job
Services Australia (JSA), unless they are working part-time'. [60]
5.49
The Youth Network of Tasmania argued that this measure will have an
unintended and negative impact:
The Work for the Dole program can cause or encourage
participants to reduce their efforts in seeking employment, as many view their
work placements as employment, which discourages them from searching for jobs.
Participants also have less available time to complete job search activities.
Research also indicates that Work for the Dole programs do not match the
participant's career interests with their work placement.[61]
5.50
Ms Catherine Bartolo, Chief Executive Office of YFS Limited, said that
Work for the Dole needs to be meaningful and more than simply 'sweeping up
streets [or picking up rubbish]. It needs to be something that leads to a
certificate that is accredited or something'.[62]
5.51
Submitters and witnesses expressed concern about the arbitrary movement
of unemployed people, who will be required to relocate to accept jobs in
regional areas. For example, Mr Craig Comrie, Chief Executive Officer of Youth
Affairs Council of Western Australia, outlined the importance of vulnerable
young people not being removed from their support network of 'family, friends,
peers, youth workers [and] social workers', as such removal will not lead to
sustainable employment outcomes.[63]
5.52
Dr Goodwin-Smith gave evidence, describing the long‑term negative
effects of a bad employment or job placement experience:
Our research also speaks to the fact that quality of
employment is also important and that a job is not a job—focus on quality does
matter. If you have people who are inter-generationally unemployed or severely
unemployed...a negative employment experience is going to be pretty effective in
ensuring that their attachment to the workforce is not sustainable and that
their negative views of workforce attachment are reinforced. Bad workforce
experiences in jobs that do not have a quality element to them are really
problematic and can entrench workforce exclusion. That is a really powerful
argument against a blunt work-first approach.[64]
5.53
Dr Falzon contended that governments must transition policy away from
punitive measures, such as the Work for the Dole programme, and drive real
economic development that creates jobs:
[T]his is the kind of bold vision that we need as a nation if
we are to seriously address the underlying structural problems in the labour
market. That means a regional economic development approach. And it means
government working with the private sector, but it means government taking the
ultimate responsibility to make sure that, where it is at all possible for
people to work, they are given the opportunity to work. I do not mean work for
the dole; I mean work for the wage. That is a really important distinction.[65]
The Budget and its effect on the
retirement age
5.54
The Australian Government's plan to increase the qualifying age for the Age
Pension (from 67 years in 2023 to 70 years in 2036) provoked criticism from
several quarters, most notably on behalf of blue collar workers in physically
demanding jobs. For example, Baptcare questioned whether it is practical to
expect manual workers in industries such as forestry, fishing and mining to
keep working until the age of 70.[66]
5.55
In 2010, the ABS' Labour Force Survey found that 18.3 per cent of male
workers over the age of 55 were 'technicians and trades workers', 12.2 per cent
were 'machinery operators and drivers' and 10.9 per cent were 'labourers'.[67]
In other words, over 40 per cent of male workers over the age of 55 were blue
collar workers.
5.56
COTA Australia acknowledged that the Age Pension should be linked to
life expectancy, but submitted that the average age of retirement is 61 years.
Further, many people retire for reasons beyond their control:
In 2011, 12.2% of male and 8.6% of female workers retired
involuntarily due to dismissal, pressure from employers or others at work to
retire, inability to find another job or reaching compulsory retirement age. An
additional 35.3% of men and 35.8% of women retired involuntarily due to their
own ill health or to care for a partner or family member.
This means that many people end up spending a number of years
on Newstart or the Disability Support Pension before becoming eligible for the
age pension—and this situation will only worsen if the eligibility age
increases. Indeed, over 80 per cent of people who go onto the full age pension
at age 65 move across from another income support payment.
Furthermore, if people cannot access any income support from
the Government, [the Association of Superannuation Funds of Australia]
estimates a person will need almost $60,000 more in superannuation or
retirement savings to fund their retirement between 67 and 70.[68]
The Budget and reform of higher
education
5.57
As foreshadowed in the Budget,[69]
the Higher Education and Research Reform Amendment Bill 2014 was introduced
into the Parliament on 28 August 2014,[70]
and seeks to reform the higher education system:
...by deregulating fees and extending demand driven funding to
higher education qualifications below the level of bachelor degree, including
higher education diplomas, advanced diplomas, and associate degrees, and also
to private universities and non-university higher education providers. The Bill
will enable providers to determine the amount that students contribute to the
cost of their courses...The Bill also restructures Commonwealth subsidies for
Commonwealth supported places[.][71]
5.58
The NUS highlighted students' concern that the bill will increase fees
and the interest charged on student debt, deterring 'students from low
[socio-economic status (SES)], mature age and rural backgrounds from
participating in higher education and missing out on opportunities for higher
life-time earnings'.[72]
5.59
Ms Meg Webb, Deputy Chief Executive of Tasmanian Council of Social
Service, expressed particular concern about the proposed higher education
measures on women:
...they will be particularly penalised through interest accrued
on HECS debts and that time out of the workforce will increase the length of
time for paying off a HECS debt and increase the level of interest paid. So for
women, in particular, that is a real disincentive for higher education.[73]
5.60
Ms Deanna Taylor, National President of the NUS, advised:
...the evidence we have seen time and time again, both in
Australia and when doing comparisons with countries overseas, is that [study
debt diversion] is a very real phenomenon, particularly for people from low-SES
backgrounds and rural and regional areas and mature-age students, who obviously
are unwilling to take on extra debt if they feel that it is not going to be
worth it...we simply cannot afford to go down the road of deregulation of fees
and the changes to interest rates on HELP loans. It is something that should be
unequivocally rejected.[74]
5.61
Submitters and witnesses noted that the budget measures will have long-term
impacts on students. Ms Taylor summarised that the measures 'are going to leave
students plunged irretrievably into a lifetime of debt'.[75]
Her colleague, Mr Jack Gracie, also rejected the notion that the debt is temporary:
You do not get any bank account when you graduate. You are
still carrying debt into your mid- to late-twenties or maybe early thirties. If
you take into consideration the proposed changes in higher
education—particularly the real interest—you are not talking about a temporary
situation. You are talking about a situation where your debt continues to
accumulate over years, and it takes you maybe 18 to 25 years to pay off your
HECS debt, when originally it might have taken you 10 years. Those particular
effects will continue to affect graduates into their forties, possibly.[76]
5.62
Ms Taylor added:
...there is some evidence to suggest that the changes to higher
education in the legislation that the government is proposing, and its impact
on graduate debt, will have an economic impact broader than what we currently
suspect. So there will be things such as fewer young people willing to take on
mortgages, which will have an impact on the housing market and car loans. There
will be all those kinds of things that will have a broader economic impact than
what I think is currently understood.[77]
5.63
In this context, Ms Webb highlighted:
...it is not just necessarily the university sector but
introducing HECS-type repayment fees for apprenticeships and that side of
things. It also means that people following those pathways into training
and employment will come through that training with a debt to repay. That is a
difficult thing to face at the very beginning of your career. So extending that
down to those forms of training as well is unfortunate.[78]
5.64
Professor Thomas Piketty has written that, in the United States of
America:
...the proportion of college degrees earned by children
whose parents belong to the bottom two quartiles of the income hierarchy
stagnated at 10–20 per cent in 1970–2010, while it rose from 40 to 80 per cent
for children with parents in the top quartile. In other words, parents' income
has become an almost perfect predictor of university access.[79]
5.65
Nobel laureate Professor Joseph Stiglitz recently wrote in the Sydney
Morning Herald:
There are several areas where Australia should be
particularly cautious about imitating the US model. One of the reasons that the
US has gone to the bottom of the league tables in economic opportunity is our
education system, and especially the way higher education is financed. It is
one of the reasons that only about 8 per cent of those in the bottom half get a
college education. Australia's income contingent loan program [the HECS-HELP
study assist scheme], is the envy of the rest of the world. It works. The best
US universities are superb—the best in the world—but they are all either state
financed or non-profits, supported by generous philanthropy. They compete
vigorously in quality—but it is not conventional market competition, where
price plays a pivotal role. The under-regulated for-profit universities
excel—in exploiting children from poor families and in lobbying to make sure
that they can continue to do so.[80]
5.66
Mr Brendan Markey-Towler, a research higher degree candidate from the
School of Economics at the University of Queensland, said:
If you were to ask me what is the single most important
policy for mitigating the negative effects of inequality in Australia, it would
be the HECS system in so far as it allows for public education on a mass scale...In Australia
the defining feature of the HECS system is not just that it subsidises the
students significantly. The most important feature in my opinion would be that
the government provides the loan at a fairly low interest rate and also does
not demand regular payments. You pay the loan back when you get the income, and
it is taken out as tax from your taxable income. That is extremely important in
providing access to university for students.[81]
The Budget and the GP co-payment
5.67
The Budget proposed to achieve savings of $3.5 billion over five years:
...by reducing Medicare Benefits Schedule (MBS) rebates from 1
July 2015 by $5 for standard general practitioner [GP] consultations and out‑of‑hospital
pathology and diagnostic imaging services and allowing the providers of these services
to collect a patient contribution of $7 per service.[82]
5.68
The Budget also proposed to achieve savings ($1.3 billion over four
years), by increasing the Pharmaceutical Benefits Scheme (PBS) co-payments
and safety net thresholds, from 1 January 2015. This measure will increase:
-
co-payments for general patients by $5.00 (from $37.70 to $42.70)
and for concessional patients by $0.80 (from $6.10 to $6.90); and
-
thresholds each year for four years, with general safety net
thresholds to increase by 10 per cent each year and concessional safety nets to
increase by the cost of two prescriptions each year.[83]
5.69
Some witnesses commented on the MBS and PBS measures, saying that the
patient contribution will reduce access to medical services and prescription
medications for low income and disadvantaged Australians.[84]
Dr Yvonne Luxford, Member of the Public Health Association of Australia,
indicated that consideration could have been given to the many people who will
be affected by the measures:
Look at the different groups who will be directly affected by
a GP co‑payment and who have come out and claimed that they will be
directly affected—such as Aboriginal and Torres Strait Islander Australians.
All of the groups associated with advocacy around the health of Aboriginal and
Torres Strait Islander Australians have spoken about the damage that a GP
co-payment will cause in terms of their continuing access to health care. There
has also been a strong voice from the rural sector, such as the National Rural
Health Alliance, which has been arguing on the same levels. We see the same...also
in terms of access to care for those who are dying, or anybody with a chronic
disease, when you are looking at both sides of that, in terms of being able to
visit a GP and the changing levels of the PBS safety net et cetera. If you are
needing ongoing medication and ongoing medical treatment, those things are
obviously going to be affected by a GP co-payment and other changes there.[85]
5.70
Mr Joshua Fear from Mental Health Australia said:
...it will not surprise the committee to learn that people with
mental illness often face very high out-of-pocket costs. GPs are often the
first port of call for someone with a mental health issue, both someone who has
never experienced those symptoms before and is worrying about what they mean
and also people who have an enduring mental illness that they need to cope with
over time. In fact 1½ million GP services are provided every year for a mental
health issue...[A] co-payment will actually discourage help‑seeking.[86]
5.71
TASCOSS added:
We need nothing to discourage people from attending their GP
appointments regularly. A co-payment does that outright. Particularly for
people in Tasmania who are on low incomes, who are on allowances and pensions,
any level of co-payment required will be a deterrent and that will inevitably
lead to worse health outcomes and a much more expensive health system for our
state in the long run.[87]
5.72
At the Logan public hearing, QCOSS tabled its 2013 report into Indicators
of Poverty and Disadvantage in Queensland, showing that, in that
state in 2011–12, 7.4 per cent of the population deferred access to a GP and 11.5
per cent of the population deferred access to medications, for costs reasons.[88]
The national statistics were also reported for that financial year by the ABS (Figure
5.6).
Figure 5.6: Percentage of individuals who delay or did not use service due
to cost by level of disadvantage (ABS 4839.0, 2011–2012)
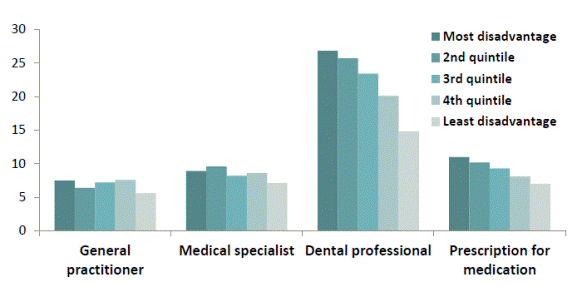
Committee view
5.73
Government policy affects income and other forms of inequality. Evidence
received by the committee highlighted particularly how the 2014–15 Budget will
disproportionately and negatively impact people living on low incomes.
Most concerning is NATSEM's estimate that single parents will fare worst losing
approximately 10.8 per cent of income on average. Also concerning is the ANU's
estimate that an unemployed adult will face an 18 per cent reduction in
disposable income. These independent analyses are not disputed.
5.74
Treasury explained that it would not be possible to annually measure the
impact of budget measures on income distribution. It is surely possible however
to model the likely impact of those changes, as has occurred with previous
budgets and as undertaken by NATSEM and the ANU. The committee notes that the
Treasury—among others—uses a model not only developed for that department but
similar to the STINMOD model used by NATSEM.[89]
5.75
In the interests of transparency and accountability, the Australian
Government should be making available more detailed analysis of budget measures
which significantly affect the whole, or part of the, Australian community. For
the 2014–15 financial year, the negative effects on low income households is
patently clear and, according to further NATSEM analysis, so significant as to
atypically increase Australia's Gini co-efficient rating by a margin not
achieved in the last few decades.
5.76
Much of the evidence showed that the likely impact of the Budget
measures will be to exacerbate income inequality and poverty in Australia. The
HPLs and the 50 per cent median income poverty line indicate that far too many
vulnerable Australians, individuals and families in receipt of income support,
are currently living in poverty.
5.77
One solution suggested by the ACTU, in respect of Newstart Allowance but
equally applicable to several income support payments (Parenting Payment, Youth
Allowance, Austudy), is to review the adequacy of payments.[90]
The committee considers this to be a sound proposal but notes that the
Reference Group reviewing Australia's welfare system might not be actively
considering this issue. If this were the case, the review would miss an
opportunity to examine a fundamental aspect of the Australian welfare system
and to address any inadequacies in that area.
5.78
In relation to Stronger Participation Incentives for Job Seekers under
30, Submitters and witnesses described how the new policy will adversely affect
individuals and families, as well as communities. Dr Falzon described a
practical outcome of this policy as 'forcing young people to live on fresh air
and sunshine'.[91]
The committee questions the evidence base for this harsh proposal that is
intended to encourage young people to earn, learn or participate in Work for
the Dole.[92]
5.79
The committee notes that the Australian Government has indicated that it
is 'pragmatic' about its ability to pass legislation introducing a patient
contribution, due to insufficient support for the policy proposal in the
Senate.[93]
In recent days, senior ministers have also affirmed that the Government remains
committed to the policy and is currently negotiating changes which will secure
the passage of the legislation.[94]
5.80
The committee accepts evidence to the inquiry that a GP co-payment will frustrate
access to health services for people who cannot afford the contribution. The
committee considers that equitable access to health care is a fundamental
feature of the Australian health system, and a policy–such as the GP
co-payment–which jeopardises people's ability to access necessary health care
is not supportable. Equally, the committee is not convinced that impeding
individuals' access to prescription medications, by raising contributions and
safety net thresholds, is justifiable.
5.81
In relation to the Budget measures aimed at achieving higher education
reform, the committee highlights the erudite comments of Professor Stiglitz.
The committee considers that the HECS-HELP study assist scheme must be
preserved, as must access to affordable vocational training.
5.82
The committee acknowledges that low income regions across Australia—such
as Elizabeth (South Australia), the location of the fifth public hearing for
this inquiry—will be gravely affected also by the measures in the Budget.
The closure of the Ford, Toyota and General Motors Holden factories within
the Elizabeth area is an unfortunate but prime example of the way in which
government policy can impact income inequality.
5.83
With the above comments in mind, the committee makes the following
recommendations.
Recommendation 1
5.84
The committee recommends that there should be analysis of income
inequality in Australia as a result of budget changes. The evidence provided to
the committee raises issues around the best way to provide this analysis.
There has been support for this work to be undertaken by the Treasury or
the Australian Bureau of Statistics. The committee believes that consideration
should be given to the most effective process to achieve this analysis.
Recommendation 2
5.85
The committee recommends that the Australian Government not proceed with
the following 2014-15 Budget measures, to avoid further hardship for
Australians in receipt of income support payments:
-
in Schedules 1 to 8 of the Social Services and Other Legislation
Amendment (2014 Budget Measures No. 4) Bill 2014, measures that:
-
maintain at their current levels for three years the income free
areas for all working age allowances (except student payments) and the income
test free area for Parenting Payment Single, from 1 July 2015;
-
index Parenting Payment Single to the Consumer Price Index only,
from Royal Assent;
-
maintain at their current levels for three years several FTB free
areas, from 1 July 2015;
-
maintain at their current levels for three years the income free
areas and other means-tested thresholds for student payments, including the
student income bank limits, from 1 January 2015;
-
maintain the standard FTB child rates for two years in the
maximum and base rate of FTB Part A and the maximum rate of FTB Part B, from 1
July 2015;
-
revise the FTB end-of-year supplements to their original values
and cease indexation, from 1 July 2015;
-
limit FTB Part B to families with children under six years of
age, with transitional arrangements applying to current recipients with
children above the new age limit for two years, from 1 July 2015;
-
introduce a new allowance for single parents on the maximum rate
of FTB Part A for each child aged six to 12 years inclusive, and not receiving
FTB Part B, from 1 July 2015;
-
extend and simplify the ordinary waiting period for all working
age payments, from 1 January 2015;
-
provide for 26-week waiting periods and non-payment periods, from
1 January 2015;
-
cease the pensioner education supplement, from 1 January 2015;
-
cease the education entry payment, from 1 January 2015;
-
extend Youth Allowance (Other) to 22 to 24 year olds in lieu of
Newstart Allowance and Sickness Allowance, from 1 January 2015;
-
require young people with full capacity to learn, earn or Work
for the Dole, from 1 January 2015; and
-
remove the three months' backdating of disability pension under
the Veterans' Entitlements Act 1986, from 1 January 2015.
-
in Schedules 1 and 2 of the Social Services and Other Legislation
Amendment (2014 Budget Measures No. 5) Bill 2014, measures that:
-
index all pensions to the Consumer Price Index only,
from 20 September 2017;
-
maintain for three years the current income test free areas for
all pensioners (except Parenting Payment Single), and the deeming thresholds
for all income support payments, from 1 July 2017;
-
reset the income test deeming thresholds for single income
support recipients ($30 000), pensioner couples ($50 000), and a member of a
couple other than a pensioner couple ($25 000), for social security and
veterans' entitlements, from 20 September 2017; and
-
increase the age pension qualifying age and the non-veteran
pension age from 67 to 70 years, by six months every two years, commencing 1
July 2025.
-
cessation of payment of the seniors supplement for holders of the
Commonwealth Seniors Health Card or the Veterans' Affairs Gold Card, from 20
September 2014 (Schedule 1 of the Social Services and Other Legislation
Amendment (Seniors Supplement Cessation) Bill 2014).
The committee recommends that the proposed changes to the
HECS-HELP study assist scheme and the proposed GP co-payment do not proceed.
Navigation: Previous Page | Contents | Next Page