Navigation: Previous Page | Contents | Next Page
Chapter 4
Market share
...how big
is too big?
Market definition
4.1
Conflicting views were put forward regarding the actual market share of
the major chains. The debate centred on market definition, where the level of
concentration is dependent upon how the market is defined.
National Association of Retail Grocers of Australia (NARGA)
4.2
NARGA believes that the AC Nielsen measure of market share is the
correct industry standard. This covers 105 items sold through grocery
supermarkets, including dairy and frozen products. On this basis, Woolworths’
national share is 35.9 per cent, Coles is 30.3 per cent and Franklins is 14.2
per cent.[1]
However, the AC Nielsen submission states that the market share figure of 80.4
per cent for the three major chains relates only to the dry/packaged grocery
market. According to AC Nielsen, this definition is restrictive, and in order
to assess the true grocery market, the definition should be expanded to include
fresh meat, fresh fruit and vegetables, delicatessens, bread and liquor.[2]
Table 4.1 represents the State and national share of the dry/packaged grocery
market.
Table 4.1
Grocery retail market
shares (dry/packaged goods only)
September 1998
|
|
Woolworths |
Coles/Bi Lo |
Franklins |
Total |
Davids |
Others** |
|
NSW
|
36.4 |
23.4 |
24.2 |
84.0 |
13.6 |
2.4 |
|
VIC
|
36.6 |
33.8 |
8.7 |
79.1 |
19.1 |
1.8 |
|
QLD
|
38.6 |
32.2 |
16.4 |
87.2 |
12.8 |
0 |
|
SA
|
29.9 |
38.0 |
7.0 |
74.9 |
25.1 |
0 |
|
WA
|
27.1 |
33.4 |
N/A |
60.5 |
n/a |
39.5 |
|
TAS
|
73.1* |
26.9 |
N/A |
100 |
n/a |
0 |
|
NATIONAL
|
35.9 |
30.3 |
14.2 |
80.4 |
15.4 |
4.2 |
Source: AC Nielsen[3]
* Includes Tasmanian Independent Wholesalers
** Includes FAL and AIW
Woolworths
4.3
Woolworths disputed NARGA’s definition of the market. Mr Roger Corbett,
Chief Executive Officer, told the Committee that:
...some have chosen, for whatever purpose, to use these facts
incorrectly, and by doing so have created a misleading context for this inquiry
and have also cast a shadow over the industry and those who lead it.[4]
4.4
Woolworths commissioned economic trend analyst, Mr Anthony Dimasi, to
determine the market share based on household expenditure. Mr Dimasi believes
that the relevant market shares for supermarkets are those measured as the
share of total retail food and grocery spending – the ‘stomach market’. This
includes:
- spending on take-home food and groceries and on bottled liquor;
and
- spending on food catering (cafés and restaurants).[5]
4.5
Mr Dimasi’s research shows that, in 1997-98, Australians spent about
$123 billion on retail goods and retail services. This total is made up
of:
- food and groceries to take home – $47 billion;
- liquor to take home – $5.5 billion;
- food catering (café and restaurant expenditure) – $13.2 billion;
- non-food goods (apparel, homewares, gardening, et cetera) – $52
billion; and
- retail services (video rental, optometry, hair and beauty etc.) –
$5.4 billion. [6]
The total market for food we can then consider, I guess, a
number of different ways. If we look at all food and grocery spending in
Australia, in 1997-98 that was $65.5 billion. It comprised $19.7 billion spent
on what we call fresh food, which is meat and poultry, fresh produce, fresh
seafood, delicatessen and dairy goods and bakery goods, and another $27 billion
on packaged groceries and frozen food, accounting for about 41 per cent of the
total market for food and groceries.[7]
4.6
Mr Dimasi said that the AC Nielsen market share figure of 80.4 per cent
relates only to some of the goods in that $27 billion worth of packaged
groceries and frozen foods. Furthermore, he disagreed that supermarkets and
grocery stores compete effectively only for sales of take-home food, groceries and
liquor. Rather, he argued that takeaway food stores, restaurants, hotels or
taverns should also be seen as market competitors:
My view is that, to a greater or lesser degree, they all
[compete]. Some are very clearly and very obviously competitive with supermarkets,
some less so. But in my view, in terms of the competitive model that
supermarkets face in their day-to-day business decisions, I would take the view
that they are all competitive.[8]
4.7
Table 4.2 represents Mr Dimasi’s analysis of the major chains’ share of
all food and grocery spending.
Table 4.2
Major chain grocery retail market shares (all food and
grocery spending) 1997/98
|
Trader
|
Sales ($ Billion) |
% of Total |
|
Major Chains
|
|
|
|
Woolworths
|
13.10 |
20.0 |
|
Coles*
|
11.30 |
17.3 |
|
Franklins
|
3.80 |
5.8 |
|
Total Major Chains
|
28.20 |
43.1 |
|
Other Traders
|
37.18 |
56.9 |
|
Total Take-home Food, Liquor and Groceries
|
65.38 |
100.0% |
Source: Jebb Holland Dimasi, Submission 228, p 27.
* Includes
Red Rooster sales.
Franklins
4.8
Franklins believes its market is other supermarkets, convenience stores
and specialty fresh food retailers. As a result of demographic and social
changes, Franklins now aims to compete with the ‘ready to eat’ and fresh
specialty food outlets, not just the traditional supermarket. It estimates that
the share of sales of groceries, liquor and fresh food (excluding takeaway food
retailers) is:
- Woolworths – 35 per cent;
- Coles – 27 per cent;
- Independents – 29 per cent; and
- Franklins – 9 per cent.[9]
Coles
4.9
Coles did not debate the issue of market concentration. Instead, it
urged the Committee to focus on whether the retail sector is competitive and
accessible to new entrants.[10]
Australian Competition and Consumer Commission (ACCC)
4.10
The ACCC defines a market as the area of close competition between firms
and within which there is close price substitutability between one product and
another, and close substitutability between one source of supply and another.
The ACCC maintains that each market will differ as the circumstances of each
case differ, and that it is inappropriate to have a pre-determined view on any
dimension of a market, be it product, geographic or functional. What is crucial
in the ACCC’s view is that the relevant principles of defining a market are
applied consistently.
4.11
One submission felt compelled to take up this point of consistency,
noting that the major chains appear to want the best of both worlds:
For example, in their presentation to the Committee on Tuesday 6
April 1999, Woolworths were determined to down play the extent of their
domination by quoting their market share in terms of somebody’s stomach,
thereby defining their share as a mere 20 per cent.
In contrast, not four weeks later, Chief Executive Roger Corbett
was reassuring his shareholders that, according to AC Nielsen packaged grocery
scan data, Woolworths market share had risen from 35.1 per cent to 35.6 per
cent in the past twelve months.[11]
4.12
Because of the conflicting views on market share, the Committee
considered it appropriate to independently quantify the market shares of each
major chain.
Australian Bureau of Statistics (ABS)
4.13
The ABS was commissioned to provide the Committee with market share
information for the following sub-groups:
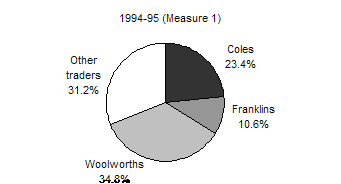
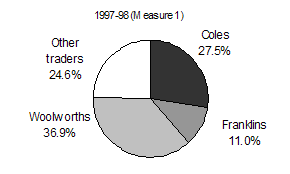
Measure 1
4.14
Measure 1 includes supermarket and grocery stores, including the
non-petrol sales of identified convenience stores of petrol stations. It
comprises ANZSIC Class 5110, which consists of units mainly engaged in
retailing groceries or non-specialised food lines, whether or not the selling
is organised on a self-service basis.[12]
Table
4.3
Supermarket and Grocery industry
|
Trader
|
1994-95
% |
1997-98
% |
|
Major Chains
|
|
|
|
Coles
|
23.4 |
27.5 |
|
Franklins
|
10.6 |
11.0 |
|
Woolworths
|
34.8 |
36.9 |
|
Total Major Chains
|
68.8 |
75.4 |
|
Other Traders
|
31.2 |
24.6 |
Source: ABS Retail trade special data service report (see Appendix
5).
Figure 4.1 |
Figure 4.2 |
 |
 |
Source: ABS Retail trade special data service report (see
Appendix 5).
Measure 2
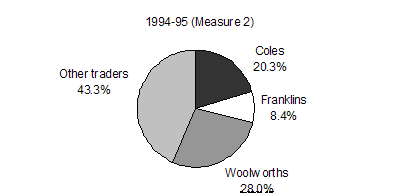
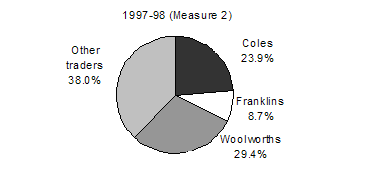
4.15
Measure 2 includes items in measure 1, plus liquor retailing stores,
plus other food retailing stores including fresh meat, fish and poultry
retailing stores, fruit and vegetable retailing stores, bread and cake
retailing stores, and other specialised food retailing stores. It comprises
ANZSIC Class 5110 plus 5123 (liquor retailing), 5121 (fresh meat, fish and
poultry retailing stores), 5122 (fruit and vegetable retailing stores), 5124
(bread and cake retailing stores) and 5129 (specialised food retailing).[13]
Table 4.4
Supermarket and Grocery industry, plus the Liquor
industry and other food industry which covers bread and cakes, fresh meat, fish
and poultry, fruit and vegetables and specialised food retailing
|
Trader
|
1994-95
% |
1997-98
% |
|
Major Chains
|
|
|
|
Coles
|
20.3 |
23.9 |
|
Franklins
|
8.4 |
8.7 |
|
Woolworths
|
28.0 |
29.4 |
|
Total Major Chains
|
56.7 |
62.0 |
|
Other Traders
|
43.3 |
38.0 |
Source: ABS Retail trade special data service report (see
Appendix 5).
|
Figure 4.3 |
Figure 4.4 |
 |
 |
Source:
ABS Retail trade special data service
report (see Appendix 5).
Measure 3
4.16
Measure 3 includes items in measure 2, plus takeaway food retailing
stores, which is ANZSIC Class 5125.[14]
Table 4.5
Combined Supermarket and Grocery industry, the Liquor
industry, the Takeaway food industry and other food industry which cover fruit
and vegetables, bread and cake, fresh meat, fish and poultry, specialised food
retailing (delicatessens, tobacco and confectionary)
|
Trader
|
1994-95
% |
1997-98
% |
|
Major Chains
|
|
|
|
Coles
|
17.8 |
21.0 |
|
Franklins
|
7.2 |
7.5 |
|
Woolworths
|
24.0 |
25.4 |
|
Total Major Chains
|
49.0 |
53.9 |
|
Other Traders
|
51.0 |
46.1 |
Source: ABS Retail trade special data service report (see
Appendix 5).

Source: ABS Retail trade special data service report (see
Appendix 5).
4.17
Given that the volume of food sales in Australia remains reasonably
static (subject to increases in population), the major chains have set in place
a number of expansion strategies. For instance, they appear to be increasingly
entering regional and rural markets, which have traditionally been uncontested
by the major chains:
It is arguable that, due to a shortage of appropriate sites in
urban areas, perhaps caused by maturity and/or saturation of the urban market,
this is changing. It has been put to the Commission, however, that there is
still ample scope for the chains to expand in major urban centres, particularly
Melbourne and Sydney. While larger regional centres are likely to be attractive
to the chains, smaller centres are unlikely to provide the volume to make it
worthwhile, particularly in view of distribution costs.[15]
4.18
Another strategic initiative by the major chains is their development of
smaller, more focused retail stores in urban areas. Coles has more than a dozen
concept formats under trial, which is driving much of the group’s current sales
expansion.[16]
4.19
The ABS statistics conclusively reveal that the major chains have
increased their market share at the expense of the independents. For example,
Measure 2, which the ABS advises is the most realistic measure, shows that the
major chains increased their market share in three years by 5.26 per cent or
$7.1 billion out of a total industry increase of $8.1billion.[17]
Navigation: Previous Page | Contents | Next Page
Top
|