Budget Resources
Kate Wagner
Introduction
From its recent high in December 2022, inflation has
moderated in Australia, mirroring trends in price increases globally. However,
inflation remains above the Reserve Bank of Australia’s (RBA) target band of 2–3%,
with its Governor Michele Bullock asserting
that ‘we must continue to be vigilant about the continued risk of high
inflation’.
Increases to government spending are typically thought to
lead to higher inflation in net terms, heightening the chance that the RBA responds
through setting comparatively higher interest rates. The 2024–25
Budget included substantial new net spending, with new policy decisions
decreasing the underlying cash balance by around $24.4 billion over the 4-year forward
estimates (p 87). For some of this new spending, the government has stated that
it will directly reduce the consumer price index (CPI). This article provides
historical context to the degree of new government spending and discusses the
ways that government spending feeds into CPI inflation.
Inflation and interest rates
In its most general sense, inflation is the rate at which prices
change over a given time period. According to the RBA, the main
causes of inflation fall into three broad categories: demand-pull,
cost-push, and inflation expectations. Government spending that provides
additional money to people and organisations can in turn mean the money is used
to purchase more goods and services—that is, adding to demand and increasing
prices—the ‘demand-pull’ mechanism. Economist Chris
Richardson has estimated that for every $7 billion in additional government
spending, the RBA would need to lift the cash rate 0.25 of a percentage point
higher than otherwise.
Historical government spending
In each budget update, the expected budget balance over the
forward estimates period can change for 2 broad reasons: new policy decisions,
and ‘parameter and other variations.’ The latter comprises changes outside of
the government’s direct control, such as changes to economic forecasts, and
fall outside the scope of this article.
New policy decisions resulted in substantial government
spending in the 2023–24 Budget—around $22.4 billion over the forward
estimates. Figure 1 below shows the historical context for new government
spending in different budget years. Each data point
shows how new policy decisions since the previous budget affected the
underlying cash balance over the forward estimates period. While the impact
is substantially less than policy decisions during and after the COVID-19
pandemic, it is higher than much of the preceding decade.
Figure 1: Impact of policy decisions on budget balances over the forward
estimates period
Note: Each data point shows
how new policy decisions since the previous budget affect the estimated underlying
cash balance over the forward estimates period. For instance, the final data
point shows policy decisions since 2023-24 Budget, summing the impact of policy
decisions from the 2023–24 MYEFO ($21.3 billion) and from the 2024–25 Budget
($22.4 billion). There is a series break in 2016–17, when the budget documents
went from reporting the impact of the government’s new policy decisions for the
budget year plus 2 years to the budget year plus 3 years.
Source: Table 3.2, Budget Paper
1 and MYEFO documents from 2014-15 to 2024-25.
While underlying cash balance (UCB) is the most commonly
used metric for analysing the overall budget balance, there are cases where
cash injected into the economy does not have a substantial effect on the UCB. For
instance, when governments make policy decisions such as purchasing equity or
providing loans, the bulk of the cash involved appears in the headline cash
balance (HCB) but not the UCB.
While these policies do not have the same effect on
government finances as spending appearing in the UCB (after all, if the
government makes loans, it might reasonably expect them to be repaid), many of
these arrangements still represent cash added to the economy and can affect
aggregate demand. These arrangements are known as balance sheet financing, or alternative
financing, and are reported in ‘net cash flows for investments in financial
assets for policy purposes’. As Figure 2 shows, the forecast cash flowing from
the government for these arrangements has increased with this Budget.
Figure
2: Net cash flows for investments in financial assets for policy purposes
Source: 2024-25 Budget, 2023-24 MYEFO, 2023-24
Budget, PBO historical fiscal data.
Government subsidies and CPI
inflation
The RBA sets the cash rate with the aim of keeping
headline CPI inflation between 2–3%. Conceptually, the CPI measures the
percentage change in the price of a basket of goods and services consumed by
households.
For some of the Government’s new measures, Budget
paper no. 1 (p 1) stated that they would act to decrease CPI inflation:
The Government’s responsible cost-of-living relief measures
of energy bill relief and Commonwealth Rent Assistance are estimated to
directly reduce headline inflation by ½ of a percentage point in 2024-25 and
are not expected to add to broader inflationary pressures.
The measures
being referred to here are the Energy Bill Relief Fund – extension and
expansion measure, worth $3.5 billion over the forward estimates, and Commonwealth
Rent Assistance – increase the maximum rates, worth $1.9 billion over the
forward estimates (p 167 and p 179).
Headline CPI is concerned with what the consumer pays, not
with what the government pays or the seller receives. Accordingly, when households
receive subsidies explicitly related to rents or utilities, these
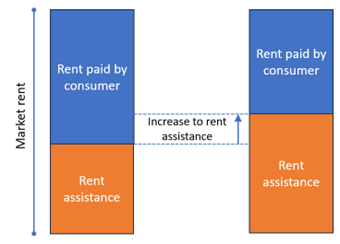
impact the CPI measurement. For example, if Commonwealth Rent Assistance
increases (assuming market rent is unchanged), then payment recipients see
their rent paid decrease, as shown in Figure 3. This in turn leads to a
decrease in the headline CPI figure.
Figure 3: How Commonwealth Rent Assistance affects CPI Rent paid by consumers

This does not,
however, decrease the market rent, as those not receiving Commonwealth Rent Assistance
still pay the same cost for housing. Commonwealth Rent Assistance was
previously increased in the 2023–24 Budget, which increased maximum allowances
by 15%, starting in September 2023.
Analysis of Rent CPI growth and market rents (Figure 4)
identifies that market rent has increased substantially compared with rents
measured as part of the CPI. From an economic perspective, increasing the money
renters have to spend on rent would generally be expected to increase the
market price for rent, if it had any effect at all.
Figure 4: CPI rent and market rent
Source: ABS Consumer Price
Index; REIA 3 bedroom detached dwellings.
There is also typically a lag between market rents and rents
as measured in CPI; as market rents reflect properties put on the rental market,
whereas CPI measures rents more broadly, including for existing rental agreements.
The divergence shown in Figure 4 is likely to be a combination of the subsidy
and lag effects.
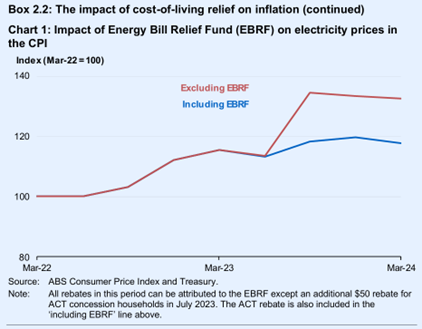
For the Energy Bill Relief Fund, Budget
paper no. 1 (p. 63) forecasts electricity prices in the CPI with and
without the subsidy (see Figure 5). The mechanism of the flow‑through to
CPI is similar to the increase in Rent Assistance; however, unlike the ongoing
Rent Assistance increase, the Energy Bill Relief Fund ceases after 2024–25.
Figure 5: Energy bill subsidy effect on CPI electricity prices

Source: Budget paper no. 1 (p. 63)
How much does headline inflation
matter?
Although the RBA’s target band for inflation refers to headline
CPI inflation, it also looks at a broad range of inflation measures in
considering interest rates settings. However, headline CPI inflation remains significant,
as it is used to index some welfare payments and has the potential to impact on
wage negotiations. Additionally, headline CPI is highly reported in the media,
so directly applying downward pressure to this metric could also assist with the
‘inflation expectations’ channel of inflation.
According to the IMF, in periods of high inflation wages
growth tends to lag behind more general prices growth because ‘wages
are slower than prices to react to shocks’. Getting broader inflation lower
remains in the best interests of Australians as they grapple with recent
cost-of-living challenges.
All online articles accessed May 2024
For copyright reasons some linked items are only available to members of Parliament.
© Commonwealth of Australia

Creative Commons
With the exception of the Commonwealth Coat of Arms, and to the extent that copyright subsists in a third party, this publication, its logo and front page design are licensed under a Creative Commons Attribution-NonCommercial-NoDerivs 3.0 Australia licence.
In essence, you are free to copy and communicate this work in its current form for all non-commercial purposes, as long as you attribute the work to the author and abide by the other licence terms. The work cannot be adapted or modified in any way. Content from this publication should be attributed in the following way: Author(s), Title of publication, Series Name and No, Publisher, Date.
To the extent that copyright subsists in third party quotes it remains with the original owner and permission may be required to reuse the material.
Inquiries regarding the licence and any use of the publication are welcome to webmanager@aph.gov.au.
This work has been prepared to support the work of the Australian Parliament using information available at the time of production. The views expressed do not reflect an official position of the Parliamentary Library, nor do they constitute professional legal opinion.
Any concerns or complaints should be directed to the Parliamentary Librarian. Parliamentary Library staff are available to discuss the contents of publications with Senators and Members and their staff. To access this service, clients may contact the author or the Library‘s Central Enquiry Point for referral.