Chapter 5
Targets in the CPRS
Emissions covered by targets
5.1 The CPRS will cover all greenhouse gases listed under the Kyoto
Protocol; carbon dioxide, methane, nitrous oxide, sulphur hexafluoride,
hydroflurocarbons and perflurocarbons; all expressed in carbon dioxide
equivalents (CO2e).[1]
The latter three gases are referred to as 'synthetic greenhouse gases'.
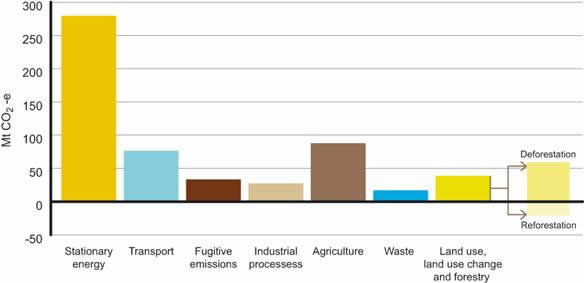
5.2 The main cause of emissions in Australia is stationary energy, notably
coal‑burning power stations. Chart 5.1 shows the contributions of various
sectors to the 576 million tonnes of CO2e emitted by Australian
entities in 2006.[2]
Chart 5.1:
Australian emissions in 2006
Source: White Paper, p
6-3.
5.3 The CPRS aims to cover around 75 per cent of Australian emissions. This
is a very high proportion compared to emissions trading schemes in other
countries.
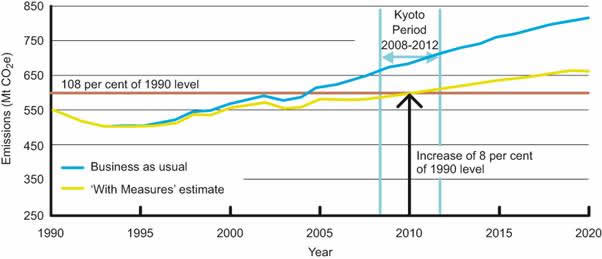
5.4 Australia, unlike some other signatories, is on track to meet its Kyoto
targets (Chart 5.2). This reflects a combination of factors:
-
Australia was set a realistic target, an 8 per cent increase
in emissions from 1990 to 2008-2012[3];
-
the early 1990s recession reduced Australia's emissions in the
early years;
-
there have been one-off reductions in land clearing.
Chart 5.2:
Australian emissions 1990 to 2020
Source: White Paper, p
4-5.
5.5 There are variations in emissions from year to year for various reasons:
...changes in economic activity, population and commodity
prices; the characteristics of coal, oil and gas being extracted; and natural
climate variability. For example, emissions change during drought mainly because
there are fewer cattle and sheep, but also because there is less water
available for hydro-electricity generators, which increases emissions from
fossil-fuelled stationary energy generation.[4]
5.6 Abstracting from these fluctuations, if nothing is done the upward trend
in Australian emissions will continue. By 2020 they are projected to be around
120 per cent of 1990 levels.[5]
It will therefore take a significant effort just to prevent emissions rising
further.
The emissions targets and gateways in the CPRS
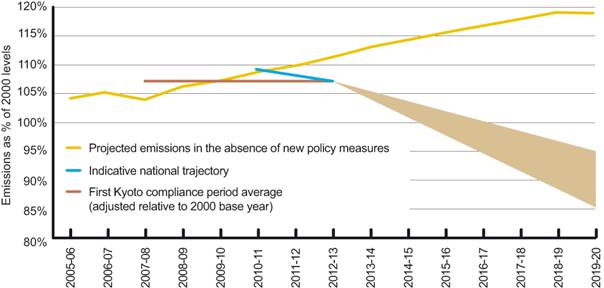
5.7 The Government have committed to a reduction of between 5 and 15 per
cent in carbon emissions from 2000 to 2020. A 5 per cent reduction would bring
down Australian emissions from 109 per cent of 2000 levels in 2010-11, to 108
per cent in 2011-12, and 107 per cent in 2012-13.
5.8 Once the scheme starts, annual caps will be announced for five years
ahead, rolling out an extra year each year. For the period beyond five years,
'gateways' – a range within which future caps would be set – would be announced
'as a guide to the Government's longer-term cap-setting intentions'.[6]
These gateways would be gradually extended over time.
Chart 5.3: CPRS
targets
Source: White Paper, p
4-23.
5.9 The 5 per cent reduction is an unconditional target. The Government has
said it would go to 15 per cent if there were a global agreement 'where all
major economies commit to substantially restrain emissions and all developed
countries take on comparable reductions to that of Australia'.[7]
The Government regards the target as representing a 'balancing [of] the need to
make a strong contribution to international efforts with ensuring a balanced
and measured start to the Scheme'.[8]
5.10 This 2020 target is 'a milestone on the way to the Government's stated
long-term target of a 60 per cent reduction in greenhouse gas emissions by
2050'.[9]
5.11 Further, the Government has indicated that it accepts the findings of
Professor Garnaut that a fair and effective global agreement centred on
stabilising long term atmospheric concentrations of greenhouse gases at or
below 450 parts per million of carbon dioxide equivalent is in Australia’s
national interests. Should such an agreement emerge, the Government has
indicated it would seek an electoral mandate for setting tougher post-2020
emissions reduction targets to ensure that we play our full part in achieving
this goal.[10]
Comparable action
5.12 Given the strong growth in Australian emissions that has already
occurred since 2000, and the projected further increases, even the 5 per cent
cut represents a 20 to 30 per cent reduction from what 2000 emissions would be
under 'business-as-usual'.[11]
A number of submitters described the targets as ambitious:
Australia is doing its part in leading the way in setting
emission reductions and in establishing policies to balance the competing
demands of industries, workers and consumers in this respect.[12]
... 5 percent may not sound like much but it is a sea-change.[13]
We are also seeing a recognition that actually achieving the
five per cent target will be no mean feat when you take into account current
emissions growth, particularly in the energy sector in Australia.[14]
Rather than proposing “comparable” commitments, in both the
-5% and ‑15% cases the Government intends committing Australia to taking
on targets that are stronger, in terms of reductions per capita, than other
more wealthy countries including the EU, the USA and the UK.[15]
5.13 Comparisons of public announcements about emissions reductions across
countries are complicated by often referring to different base periods. For
example, the US 2009 Budget proposes a 14 per cent reduction in emissions
by 2020, but as this is from 2005 levels, it represents only a return to 1990
levels. Table 5.1 attempts to put the various targets on a comparable basis.
Table 5.1:
Comparison of carbon pollution reduction targets for 2020
|
|
% change from 1990
|
% change from 1990
per capita
|
per capita
emissions (tonnes of CO2e)
|
|
Australia
|
-4 to -14
|
-34 to -41
|
17 to 15
|
|
European Union
|
-20 to -30
|
-24 to -34
|
9 to 8
|
|
United Kingdom
|
-26 to -32
|
-33 to -39
|
8 to 7
|
|
US (2009 budget
proposal)
|
0
|
-25
|
16
|
|
Canada
|
0
|
-25
|
18
|
|
Germany
|
-40
|
-41
|
9
|
|
Netherlands
|
-30
|
-39
|
9
|
|
Norway
|
-30
|
-43
|
6
|
|
Switzerland
|
-20 to -30
|
-32 to -40
|
5
|
Sources: Secretariat
calculations based on White Paper, p 3-3; Garnaut Report, p 177;
Department of Climate Change Fact Sheet – Emissions, target and global goal;
'Economic cost as an indicator for comparable effort'; 'A new era of
responsibility: renewing America's promise' (US 2009 Budget), p 21; United
Nations, World Population Prospects. Final column calculated by applying
percentage changes to 1990 per capita emissions (including land use change and
forestry) from World Resources Institute, Climate Analysis Indicators Tool.
5.14 Another way of assessing the comparability of effort is in terms of
economic cost. Australia's costs of mitigation are higher than in most other
developed countries. The Government's view is that that the cost of mitigation
needs to be considered in the context of a country's capacity to pay, and alongside other relevant
indicators.[16]
Table 5.2 compares the costs of equivalent per capita reductions in emissions
in various countries.
Table 5.2: Cost of
achieving emissions (% change from reference 2020 GNP)
|
|
5
per cent target
|
15
per cent target
|
|
Australia
|
-1.1
|
-1.6
|
|
Canada
|
-1.1
|
-1.5
|
|
Japan
|
-0.2
|
-0.4
|
|
United
States
|
-0.3
|
-0.4
|
|
European
Union
|
-0.4
|
-0.6
|
|
Russia and
CIS
|
-3.6
|
-5.3
|
|
World
|
-0.7
|
-0.9
|
Source: 'Economic cost as an
indicator for comparable effort', Australia's submission to the Ad Hoc Working
Group on Long Term Cooperative Action under the United Nations Convention on
Climate Change.
5.15 The economic costs of mitigation for Australia are a product of its
particular national circumstances, including its population growth, industry
profile, resource endowment and mitigation potential.
Population growth
5.16 Australia has a fast‑growing population for an advanced economy. A
significant part of this is due to high immigration, which means we are hosting
people who would otherwise be adding to emissions in other countries.
5.17 By contrast population has been almost static in parts of the European
Union and is projected to decline in Japan. In per capita terms, even
Australia's 5 per cent target implies a reduction of 34 per cent in
emissions from 1990 to 2020. This is a comparable percentage change in
emissions to that proposed by our peers (Table 5.1).[17]
However, even after this reduction the level of Australia's per capita
emissions will be well above those in most other countries.
Structure of the economy
5.18 Australia has a relatively large share of emission- and energy-intensive
industries and a dominance of low-cost coal in electricity generation, which determines
the extent of economic restructuring and/or technological transformation
required.
5.19 While Australia has the potential in the long run to make more use of
renewable power, most renewable projects are some time from reaching
large-scale commercial application and some do not have the potential to
generate baseload power or respond to peaks in energy demand.
5.20 It is important to note that international linking allows national
targets to be achieved at lower cost, through overseas abatement as well as
domestic emissions reductions. As a result, countries that have fewer
opportunities for low cost domestic mitigation may meet ambitious targets at
low cost to the economy as a whole by purchasing credits in the market.
Science and the targets
5.21 The exposure draft says that Australia's emissions targets are set with
regard to:
(i) the principle that the stabilisation of atmospheric
concentrations of greenhouse gases at around 450 parts per million of carbon
dioxide equivalence or lower is in Australia's national interest.[18]
5.22 As discussed in Chapter 2, the scientific evidence suggests that the
global concentration of greenhouse gases needs to be kept to 450 ppm to avoid
the dire consequences following from increases in average temperatures of over
2 degrees. Some submitters argued that Australia should therefore make an offer
consistent with its fair share of a global effort to the world stabilising
concentrations at 450 ppm. As Professor Garnaut says:
...to make an unrealistically low offer in the international
negotiations is to negate the prime purpose of our own mitigation, which is to
facilitate the emergence of an effective agreement.[19]
5.23 Australia currently has per capita emissions well above the global
average and some submissions regard it as neither fair nor realistic to expect
the world to accept Australia being allocated a disproportionate share of
emissions entitlements forever. The Garnaut Review assumes every country
in the world agrees to allocate remaining allowable global emissions, and
through emissions trading, to eliminate differences in per capita emissions
gradually over the period to 2050 ('contract and converge'). Under this
arrangement, Australia's contribution would be about a 25 per cent reduction
from 1990 levels.[20]
5.24 The logic of limiting the Australian offer to a maximum reduction of 15
per cent was questioned by some witnesses:
...having the option of a 25 per cent reduction or thereabouts
at 2020 on the table would make sense, seeing that it can be computed as
somewhere like the fair share that Australia would contribute to an ambitious
global agreement—that of course being more and more realised as Australia’s
true national interest in a climate change debate.[21]
I think it would be helpful to our place in these
international discussions if we kept on the table the chance of a 25 per cent
reduction by 2020, conditional on others doing comparably stringent things.[22]
Committee comment
5.25 The Committee believes that once allowance is made for Australia's
faster population growth and the structure of the economy, its plans at least
match those proposed by other advanced economies. The targets are a responsible
start to the scheme.
5.26 The Committee believes it is important to calibrate Australia's national
commitments to reflect scientific evidence, the availability of low emissions
technologies and the scope of international action on climate change. This could
enable Australia to consider adopting stricter emissions targets past 2020.
5.27 Our ambition should be to accelerate development of renewable energy
alternatives and improve energy efficiency. The goal would be to reach a
position where even more ambitious targets could be adopted without causing
economic hardship for households, resulting in carbon leakage or endangering
energy security.
Navigation: Previous Page | Contents | Next Page