Janet Phillips, Social
Policy and Joanne Simon-Davies, Statistics and Mapping
Key issue
In February 2016, Australia’s estimated resident population (ERP) reached 24 million. More than one quarter (28.2%) of Australia’s resident population was born overseas—a level that is considered very high compared to most other OECD countries.
Australia’s population
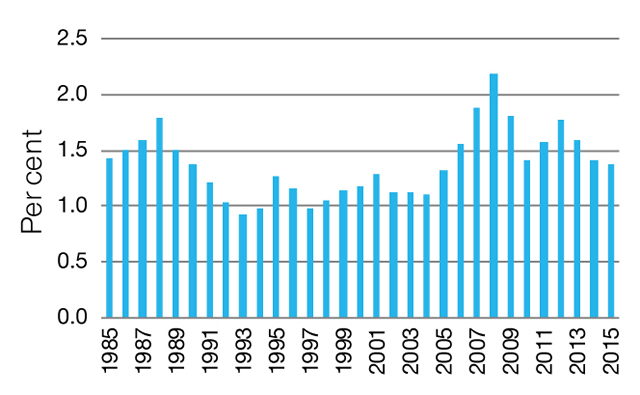
Over the past ten years the
annual population growth rate has been in a period of flux, reaching its peak
in 2008 with the highest-ever recorded annual growth rate of 2.2%. In the following
seven years the rate was in decline, dropping to 1.8% in 2009 and 1.4% in 2010,
before briefly rising in 2012 to 1.8%. It is currently at 1.4% (as at December
2015).
Figure 1: Annual population growth rate:
Australia, 1985 to December 2015
The growth in the Australian population comprises
two components:
- natural increase—births minus deaths and
- Net Overseas Migration (NOM)—the net gain or loss of the population
through immigration to Australia and emigration from Australia. NOM includes
both permanent and long-term (greater than 12 months) arrivals and departures.
The relative contribution these two components make
has changed. For example, in 1985 the natural increase represented 58.5% of
Australia’s population growth and NOM 41.5%. By 2015, natural increase
represented only 45.7% of Australia’s population growth, with NOM at 54.3%.
Interestingly, the NOM increase in recent years has been driven by people
staying in Australia on long-term temporary visas, such as overseas students
and temporary skills migrants (temporary migration is discussed in more detail elsewhere in this Briefing
Book).
Figure 2: Components of Australia’s
population, 1985 to 2015
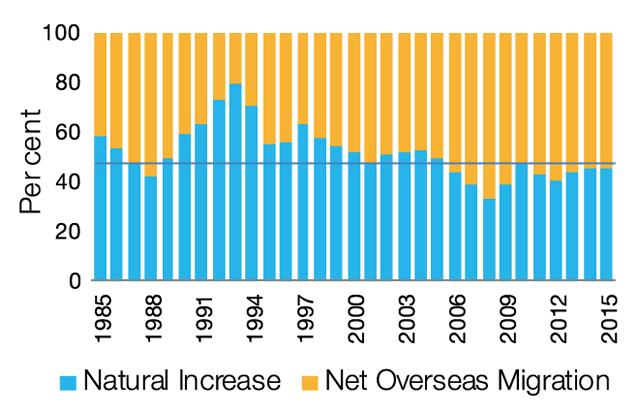
As Figure 2 shows, in 2008—the year Australia
experienced its highest level of annual growth since the early 1970s (2.2%)—natural
increase was at its lowest (33%) and NOM at 67%.
Migration flows
Since 1945, over 7.5 million people have settled in
Australia, helping to establish it as one of the most culturally diverse and
multicultural countries in the developed world. Currently, the Australian
Bureau of Statistics (ABS) estimates that
28.2% of Australia’s resident population was born overseas—a level that is
considered very high compared to most other OECD
countries.
Today, Australia’s migrants enter via one of two formal
programs managed by the Department of Immigration and Border Protection
(DIBP)—the Migration
Program for skilled and family migrants, or the Humanitarian
Program for refugees and those in refugee-like situations. Each year, the
Australian Government allocates places (quotas) for people wanting to migrate
permanently to Australia under these two programs. For several years the planning
figure for the Migration Program has been set at a record high level of 190,000
places, with the majority of the available places allocated to the skill
stream which is designed to attract migrants with desirable skills in order
to relieve skill shortages in Australia.
Table 1: Migration Program visa grants since 2000–01
| Year |
Family |
Skill |
Special Eligibility |
Total |
| 2000–01 |
33
470 |
44
730 |
2
420 |
80
610 |
| 2001–02 |
38
090 |
53
520 |
1
480 |
93
080 |
| 2002–03 |
40
790 |
66
050 |
1
230 |
108
070 |
| 2003–04 |
42
230 |
71
240 |
890 |
114
360 |
| 2004–05 |
41
740 |
77
880 |
450 |
120
060 |
| 2005–06 |
45
290 |
97
340 |
310 |
142
930 |
| 2006–07 |
50
080 |
97
920 |
200 |
148
200 |
| 2007–08 |
49
870 |
108
540 |
220 |
158
630 |
| 2008–09 |
56
366 |
114
777 |
175 |
171
318 |
| 2009–10 |
60
254 |
107
868 |
501 |
168
623 |
| 2010–11 |
54
543 |
113
725 |
417 |
168
685 |
| 2011–12 |
58
604 |
125
755 |
639 |
184
998 |
| 2012–13 |
60
185 |
128
973 |
842 |
190
000 |
| 2013–14 |
61
112 |
128
550 |
338 |
190
000 |
| 2014–15 |
61
085 |
127
774 |
238 |
189
097 |
Source: J Phillips
and J Simon-Davies, Migration
to Australia: a quick guide to the statistics, Parliamentary Library,
Canberra, 2016.
While Australia has always been one of the world’s
major ‘immigration nations’, there have been some marked changes to the
composition of its migration flows in recent years. Historically, the majority
of Australia’s overseas-born residents came from the UK or Europe, but this
pattern has shifted significantly. Although the majority of Australia’s overseas-born residents
originate from the UK, the numbers are declining—making way for an increasing
number who were born in Asia, particularly China and India. In terms of new
(permanent) migrants, for the first time in Australia’s history, entrants from
China overtook those from the UK in 2010–11. The following year, migrants
from India took out the top spot for the first time.
Another significant development in Australia’s
migration story is the growth in the numbers of temporary migrants entering the
country. Temporary migrants eligible to stay long-term (12 months or more) and
work for varying periods of time include skilled (subclass 457) workers,
overseas students and working holiday makers. In addition, under the
Trans-Tasman Travel Arrangement, New Zealanders are free to visit, live and
work in Australia. As a result, New Zealanders also feature highly in
Australia’s settler arrival statistics, but it is important to note that they
are not considered permanent migrants (or included in the Migration Program
statistics) unless they apply for (and are granted) a permanent visa.
Further reading
J Phillips and J Simon-Davies, Migration to Australia: a quick guide to the statistics, Research paper series, 2015–16, Parliamentary Library, Canberra, 2016.
ABS, Migration, Australia, cat. no. 3412.0, ABS, Canberra, 30 March 2016.
Back to Parliamentary Library Briefing Book
For copyright reasons some linked items are only available to members of Parliament.
© Commonwealth of Australia

Creative Commons
With the exception of the Commonwealth Coat of Arms, and to the extent that copyright subsists in a third party, this publication, its logo and front page design are licensed under a Creative Commons Attribution-NonCommercial-NoDerivs 3.0 Australia licence.