Joint Standing Committee on Treaties
Testing the Waters
A Report on Sea Levels
by
John L. Daly
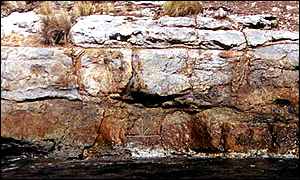
"Is this the mark that takes the heat out of Global Warming?"
- asks
the BBC [2]
Introduction
A serious problem confronts any researcher who looks into the question
of tides and sea levels, especially when searching for that elusive
concept known as `mean sea level', (MSL) or "Zero Point
of the Sea" (as Captain Sir James Clark Ross, the 19th
century British Antarctic explorer, called it [36]). Not only is it
difficult to determine true MSL at any one location, it is even
more difficult to detect any changes occurring with that level. For
example, imagine attempting to measure mean sea level on a Hawaiian
surfing beach. Sea level and tides work over longer timescales, but
the essence of the problem is much the same. Study of sea level has
now taken on a more urgent importance due to the predictions of sea
level rise which might result from any global warming resulting from
increased emissions of carbon dioxide (CO2) [23].
Climate modelers and the Intergovernmental Panel on Climate Change
(IPCC) have predicted that one of the consequences of global
warming will be rising sea levels due to thermal expansion of the ocean
water mass and melting of non-polar glaciers [21] [23]. They claim the
oceans have already risen 18 cm during the 20th
century, an annual rate of 1.8 mm/yr. They further predict that
the oceans will rise a further 50 cm approximately during the
21st century [45], an accelerated annual rate of 5 mm/yr [25].
These predictions are now taking on hysterical proportions by policy
institutions such as the EPA [44], who readily adopt a worse than `worst
case' scenario. They claim that a 1 meter sea level rise will
inundate 7,000 square miles of dry land, 50-80% of U.S. wetlands, and
cost over $270 - 475 billion in the U.S. alone. As a final touch, they
claim their estimates `are almost certainly too low'.
To support their assertions about past sea level rise, the IPCC cite
records from tide gauges, one of the oldest being from Brest in France
(Fig.1) [35] -
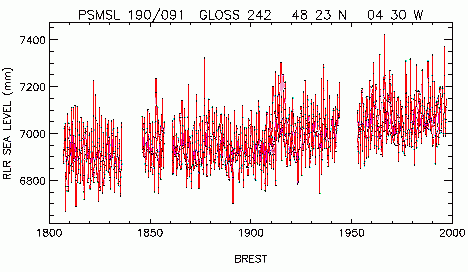
Fig.1 - Annual MSL at Brest, France [34]
Here we have a sea level in 1805 at around 6,900 mm rising to around
7,100 mm by the late 1990s, a rise of 200 mm, or approximately +1 mm
per year.
The future rise in sea level, according to the IPCC [23] [25], will
be caused by two factors. Firstly, the waters of the oceans will expand
in volume due to global warming, just as metals expand when heated.
Secondly, warming will result in melting of many non-polar glaciers,
adding further water to the ocean mass. Looking beyond the 21st century,
there are hints of greater sea level rises of several meters if the
great ice sheets of Antarctica and/or Greenland begin melting into the
sea.
Another school of thought, first postulated by British meteorologist,
Sir George Simpson in 1938 [40], and confirmed by several studies
since [30] [41] [31] [26], suggests that a warming ocean will result
in more evaporation and thus more cloudiness. The `Simpson Effect'
as it has been called [13], would increase precipitation over the polar
regions in the form of snowfall, building up the ice mass, and thus
become frozen water permanently lost from the oceans. Yet more moisture
will precipitate over internal land catchments such as the Caspian Sea
and Lake Victoria in east Africa, again removing water from the ocean
mass. These latter processes are believed to be sufficient not only
to offset the rise in sea level predicted from ocean warming, but could
result in a fall in sea level of up to 7 mm/yr [30].
Prof S. Fred Singer demonstrated that not only does warming
not raise sea levels, but there is also an observed inverse relation
between global temperature and sea levels due mainly to the increased
removal of water from the oceans to the ice caps cancelling out the
sea level effect of any thermal expansion of the oceans during periods
of climatic warming. [41].
The IPCC predictions of sea level rise presupposes there will
be a significant human-induced global warming to begin with, a questionable
assumption, given the lack of warming to date as measured from satellites,
and the lack of polar warming which would be a signature unique to a
greenhouse induced warming. By `significant' is meant a warming of 1°C
or more. Current trends would suggest an insignificant warming over
the next 100 years of only a few tenths of a degree, not whole degrees.
Time and Tide
We are all familiar with `tides', the twice daily rise and fall of
the level of the sea as the fluid mass of the oceans adjusts to the
changing gravity interactions between Earth, Moon and Sun. There are
the `spring tides' and `neap tides', the tendency for the tides to be
greater during a full moon and a new moon, than they are during a half
moon. Less obvious are the other variations in the tides, of the numerous
subtle `harmonics' which can be superimposed on the basic tidal pattern,
and on the observed changes in general sea level which ebb and flow
over many years.
The moon is the primary influence on our tides. As the Earth rotates,
the moon's gravity `pulls' at the ocean, causing it to rise in a wide
wave riding in the wake of the moons relative passage across the sky.
The sun also raises a similar, though smaller tide, being 46% of the
moon's tide. When the sun and moon are in in line with the Earth. the
combined sun-moon gravity raises a larger tide than usual - a `spring
tide'. When the moon is at right angles to the Earth-Sun axis during
a half-moon, the two gravity forces act against each other, resulting
in a smaller tide than usual - a `neap tide'. Every 28 days, the orbital
period of the moon, there are two periods of spring tides and two periods
of neap tides.
The moon's orbit is not circular but elliptical and so the effect of
the moon's gravity is not uniform throughout the 28 days. The Earth's
orbit around the Sun is also elliptical which causes the effect of the
Sun's gravity to vary throughout the year. Finally, the moon does not
orbit the Earth on the same plane as the Earth's equator, but orbits
at an angle to it. This results in the Moon sometimes passing directly
overhead regions of the Northern Hemisphere, while at other times it
is over the Southern Hemisphere. Since the tide follows the moon, the
tides will be higher in those regions where the moon's orbital path
periodically takes it high in the sky, and lower in those regions where
the moon's orbit periodically takes it lower in the sky.
There are many more Sun-Earth-Moon orbital variables or `harmonics'
to be considered, supplemented by strictly earthbound variables such
as coastline and seabed topography, ocean currents, and meteorological
effects of winds and pressure. Strong winds can push the tides higher
against some coasts, commonly known as `king tides'. High atmospheric
pressure can depress the level of the sea by about 1 cm per millibar,
while low pressure `pulls' it up by a similar amount.
The above list of variables is not exhaustive but is enough to demonstrate
the complexity of the problem. At any one time, some variables act to
reinforce the tide, others to dampen it. It takes 18.6 years
for every permutation and combination of the astronomical variables
to play themselves out at any one location [18]. Only then could a researcher
calculate a long-term MSL with some degree of confidence and exactness.
A global `Zero Point of the Sea' is indeed an elusive concept.
Mean Sea Level - `Zero Point of the Sea'
`Mean Sea Level' or MSL is defined as "the mean level of the water
surface over a specific long series of measurements. No matter how long
a period of data is averaged, the ideal true mean sea level is unattainable
because changes are taking place over long and short time scales."
[7]. Where sea level is measured at only one location, it is sometimes
referred to as `Relative Sea Level' or RSL, since the measurement only
specifies the height of the sea in relation to local landmarks. If the
land itself is rising or sinking, this would manifest itself as apparent
sea level falls or rises, even if the actual level of the ocean had
not changed. Until the advent of satellites, it was not possible to
establish a truly global MSL.
`Mean Sea Level' as a descriptive term is often used to mean either
the MSL at one location (ie. RSL), or over an entire region. Global
MSL is ultimately determined by the quantity of water in the oceans,
the temperature of that water, the volume of ice stored on the Antarctic
and Greenland ice sheets, the volume of ice stored in non-polar glaciers,
and the quantity of water stored in natural and man-made inland catchments,
lakes, and reservoirs.
The standard instrument to determine MSL and the tidal extremes is
a `tide gauge', which measures the height of the sea at regular intervals
to record the passage of high and low tides and the harmonics unique
to the location where the tide gauge is situated. Most such gauges are
installed in the populated areas of the northern hemisphere, particularly
in Europe and North America, there being relatively few such gauges
with long records in the southern hemisphere.
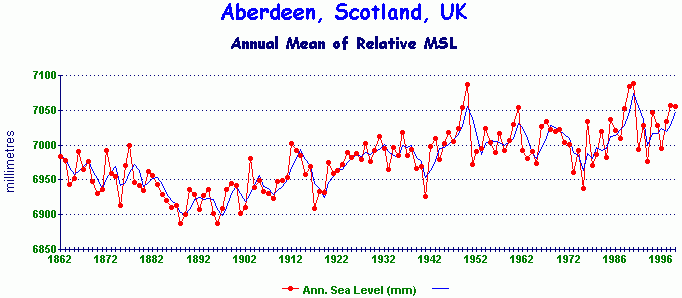
Fig.2 - Annual mean sea level at Aberdeen, Scotland, UK [35]
Fig.2 shows one of the oldest tide gauge records in the world, Aberdeen
on the east coast of Scotland. There are a few European ones which are
older, such as Brest in France (Fig.1) and Amsterdam in Holland, but
their records are broken, with gaps of several years making height comparisons
between data periods somewhat problematic. Aberdeen is interesting in
that its record is continuous since 1862.
The peak level at Aberdeen was around 1950 at 7087 mm and the lowest
point around 1889 at 6887 mm. The overall sea level rise since 1862
is around 70 mm (ie. less than 3 inches), or an averaged annual rate
of around +0.5 mm/yr, half the rate recorded at Brest and less than
one third the global rate claimed by the IPCC.
Can this Aberdeen record be taken at face value? Does it really reflect
trends in global sea level? The short answer is we don't know. Tide
gauges, like surface temperatures, are subject to several local errors
which can distort the data. Just as temperature data is affected by
urban heat islands, tide gauges located at major cities or ports are
subject to urbanization also, mainly the tendency of large cities to
subside due to the weight of the structures and the changes in the underground
water table. The larger the city, the greater is the tendency toward
subsidence, a creeping effect over time which will manifest itself at
a tide gauge as a creeping rise in relative sea level. Cities located
on alluvial low lying coasts are the most affected.
For example, Adelaide in South Australia is showing a strong sea level
`rise' which is not evident at nearby smaller ports (Port Pirie, Port
Lincoln, Victor Harbour). The Adelaide anomaly has since been found
to be caused by long-term withdrawal of groundwater since European settlement,
giving rise to local urban subsidence [3]. Another bad case of subsidence
exists in Bangkok, where the sea has risen by a meter in the last 30
years. The sea has not really risen, the land is merely sinking [38].
A second subsidence error arises from the fact that most tide gauges
are mounted on man-made structures such as piers and docks. Over many
decades, these will undergo some subsidence unless they are built on
bedrock.
In the Netherlands, the tide gauge record from Amsterdam, cited in
the IPCC draft report [25], is the longest in the world, extending back
to 1700. Another Dutch record from Hoek Van Holland dates from1865.
Both show a distinctive long-term sea level rise since the mid 19th
century. This may of course be due to urban subsidence also, but one
factor makes all Dutch tide gauge data questionable for global sea level
studies. "God made the world, but the Dutch made Holland"
is a popular saying which acknowledges the extensive reclamation of
land from the sea which has characterized Dutch history for centuries.
Two of the key variables determining tide height is seabed topography
and coastal topography. The Dutch have changed both in extensive ways.
Over several centuries, the Dutch have been reclaiming land from the
sea, altering their own coastline and thus permanently changing tidal
flow patterns [38].
During the 20th century, the Dutch reclaimed much of the large inland
gulf known as the Zuider Zee (Fig.3 map) and dammed off the rest from
the North Sea. Before these coastline changes were made it was a large
tidal sink. Tidal water flowing up and down the English Channel and
North Sea which previously could drain in and out of the Zuider Zee
is now unable to do so, thus raising local sea level outside, particularly
during high tides. The surrounding sea is shallow, being typically only
25 to 30 meters in depth, and this makes the whole region tidally sensitive
to coastal terraforming.
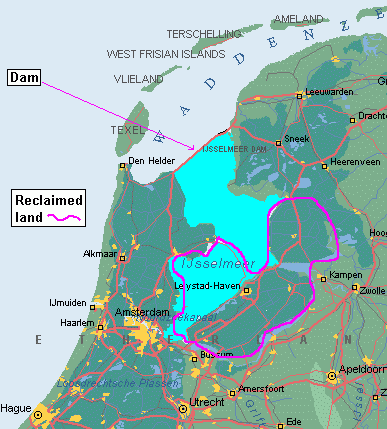
Fig.3 Map of Holland, showing the former Zuider Zee, now landlocked
by the Ijsselmeer Dam
(Based on map from Microsoft Encarta96 World Atlas)
Although the Dutch are among the more strident advocates of the Kyoto
Protocol due to their sensitivity about the prospect of sea level rise,
their own programs of land reclamation over several centuries may have
contributed significantly to the very problem they now perceive as threatening
to their national interest.
In Sweden, we have a very different record from Stockholm as shown
in Fig.4 below
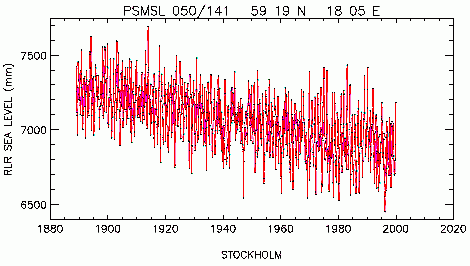
Fig.4 - The raw sea level record from Stockholm [35]
The sea level is clearly falling, by about 40 cm over 110 years. This
is in spite of the possibility of city subsidence. But here is how the
IPCC portrays Stockholm in the latest Third Assessment Report draft.

Fig.5 - The IPCC corrected sea level record from Stockholm (scale
in mm) [25]
Fig.5 is a `detrended' record to correct for a phenomenon which puts
all European and North American tide gauge data in doubt. It is `Post
Glacial Rebound' or `PGR'. During the last ice age, Stockholm
was buried under several kilometers of ice. The ice age ended about
10,500 years ago with a rapid melting of ice sheets over Europe and
North America with a resulting rise in sea level. With the ice gone,
the plasticity of the mantle below the solid crust of the earth is forcing
the crust upwards now that the dead weight of the ice is no longer there.
This process has been ongoing since the last ice age and will continue
well into the future.
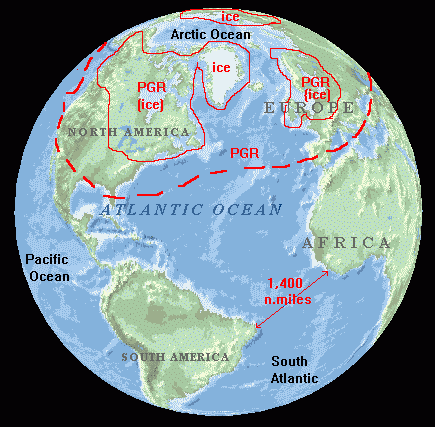
Fig.6 The North Atlantic Basin, showing the areas most affected by
PGR
(Based on map from Microsoft Encarta96 World Atlas)
PGR is underway all over Europe, North America, and east Asia (see
Fig.6) [34], the continents most affected by these enormous ice sheets.
It causes those regions which were weighed down by ice (bounded by a
continuous red line) to uplift like Sweden, and causes peripheral regions
around the margins of the former ice masses (bounded by a dashed red
line) to subside as the continental crusts adjust and rebalance to the
new weight redistribution.
The North Atlantic is actually a huge basin semi-enclosed by continental
land masses, with a 1,400 nautical mile gap between west Africa and
South America to connect it to the remainder of the world's oceans.
This may partly explain why long-term tide gauge records from within
that basin are not always consistent with records from outside the basin.
It is also unfortunate that all the really old tide gauge records extending
back into the 19th century come from Europe, right in the center of
the PGR zone. The later American ones are similarly affected.
We can see a clear example of PGR from the steady rise in relative
sea level at Trieste, Italy, located at the northern end of the Adriatic
Sea which has hardly any tides at all to complicate sea level.
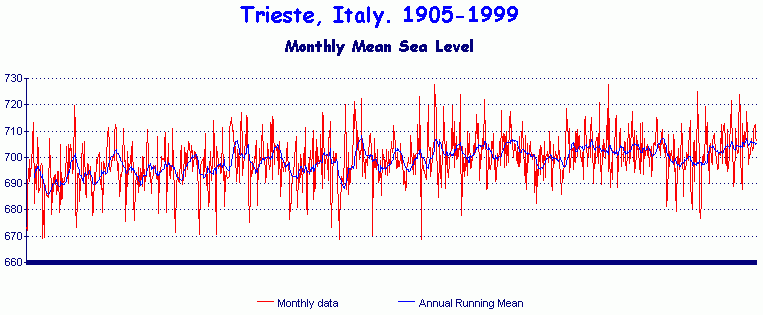
Fig.7 Monthly
mean sea level atTrieste, Italy. 1905 -1999 (year marks not shown but
can be inferred)
The Trieste record mirrors that of Venice just across the Gulf of Venice
from Trieste. Since northern Italy is on the margins of the great ice
sheets from the last ice age, the steady and largely linear rise in
sea level from 1905, amounting to about 15 cm is clearly unrelated to
transient climate events, but due to an underlying geological cause,
namely PGR. This long-term rise even pre-dates 1905 as a comparison
of paintings of the famous Rialto Bridge in Venice by 18th century artists
Francesco Guardi and Canaletto with modern photographs of the same bridge
(Fig.8), reveal a sea level much lower than the 15 cms represented in
the 20th century tide gauge record from Trieste.

Fig.8 - Rialto Bridge, Venice around 1770 (Canaletto) compared with
the same bridge today
Local sea level rise in Venice has been occurring for hundreds of years,
well before greenhouse gases became an issue, and is clearly of geological,
not climatic, origin. Urban subsidence is also a major contributing
factor in the case of Venice.
It is not just the removal of the weight of the ice which causes uplift
and subsidence in the regions directly affected, but the melting of
the ice itself has raised global sea levels by over 120 meters [25].
This changes geological stresses on regions far away from the ice due
to the added weight of water on continental shelves, causing a slow
readjustment and rebalancing of continental crusts everywhere to compensate
for the added weight of water.
Most tide gauge records which extend back into the 19th century are
of generally poor quality with extensive breaks in data, as shown in
IPCC charts [25]. Unfortunately, these records also originate in places
affected by PGR, showing sea level falls in places like Sweden and equally
large rises (3.5 mm/yr) in areas like Chesapeake Bay on the US Atlantic
coast [15]. In these cases, it is the vertical movement of the land
itself which is causing the apparent, or `relative', sea level to change.
In other parts of the world, we have many tide gauges installed in
tectonically active areas, such as the Pacific coast of North America
[19], Japan and New Zealand [15]. Here too, we cannot attribute any
apparent sea level changes solely to the sea itself due to the geological
instability of the land upon which the tide gauge is mounted. Indeed,
we have to regard tide gauge data from anywhere on the geologically
active parts of the Pacific rim (the so-called `Ring of Fire') as being
profoundly compromised by tectonic activity. Tide gauges on any other
coastline affected by tectonic activity must be equally compromised.
We could of course, disregard all tide gauge data from geologically
unsuitable locations, but if we do that, we end up with hardly any data
at all [38]. So it should at least be recognised that much of the data
being analysed is of very poor quality and badly distributed geographically.
To make some sense out of the mass of contradictory sea level data,
a series of `de-glaciation' models were developed using calculations
of earth mantle viscosity to determine how the mantle and overlying
continental and seabed crusts would react to the melting of the great
ice sheets at the end of the last ice age.
The `ICE-3G' Model
In the earlier case of Stockholm, with its sharply falling sea level,
IPCC scientists made a massive correction to the data, turning a relative
sea level fall into a mean sea level `rise'. This outcome resulted from
adjusting the observed data with correction factors derived from the
ICE-3G model developed by Peltier and Tushingham in 1991
[34]. This model purports to describe crustal movements of the continents
and sea bed in the wake of the demise of the great ice sheets. The model
depends on calculations about the plasticity of the earth's mantle upon
which the crustal land masses `float'.
ICE-3G is the most used model for correcting tide gauge data against
PGR [15]. It's creators, Peltier and Tushingham were among the
first scientists to make the linkage between global sea level rise and
the Greenhouse Effect, claiming in 1989 that sea levels were rising
at a rate in excess of 1 mm/yr [33].
The impression has been conveyed to the world's public, media, and
policymakers, that the sea level rise of 18 cm in the past century is
an observed quantity and therefore not open to much dispute.
What is not widely known is that this quantity is largely the product
of modeling, not observation, and thus very much open to dispute,
especially as sea level data in many parts of the world fails to live
up to the IPCC claims.
The ICE-3G model is a global theoretical treatment describing how the
ice masses melted and disentegrated at the end of the last ice age and
the consequent readjustments made by the crust under pressure from the
lithosphere below. However, the model does have some inherent weaknesses.
- It is assumed in the model that when the great ice sheets melted,
there was no change in the surface area of the oceans. This
assumption is of course wrong as vast areas of continental
margins were flooded as the seas rose. The authors of the
model acknowledge this,
but believe the sea level effect is small, something very much
open to dispute.
- It is assumed in ICE-3G that the mantle and crust were in equilibrium,
or in general balance,
before the big meltdown began. This is not a realistic assumption
as the ice age was itself a
very dynamic period geologically.
- ICE-3G was calibrated against 192 `Relative Sea Level' (RSL) sites
from around the world.
However, 169 of these were in the North Atlantic basin (including
the Arctic). Only 18 were listed for the Pacific Ocean, most of them
on the Pacific coast of North America, a region known to be tectonically
active. Only 5 sites were listed to cover the South Atlantic, Indian
and Southern Oceans, representing nearly two-thirds of the world's
oceans between them.
- ICE-3G used `fudge factors'. Where there was a mismatch between
the observed RSL site
and the model result, the modelled ice load in that region was either
`increased in thickness' or
its `melting delayed'. This is reminiscent of a similar procedure
used in some climate models
where the sun could be `turned up' or `turned down' to stabilize the
model at the desired
temperature.
- ICE-3G predicted a sea level rise of 115 meters during the de-glaciation.
But physical evidence
from most other studies puts the figure at 120 - 130 meters [34].
The discrepancy is attributed by Peltier & Tushingham to `missing
ice' in regions which are assumed to have been ice free, but which
might in fact have been glaciated.
What is very clear is that the ICE-3G global de-glaciation model is
really a North Atlantic-Arctic model, the accuracy of
which must deteriorate as distance increases from the ancient ice sheets,
particularly in regions outside the North Atlantic basin. For the rest
of the world's oceans and crust, this model may have little relevance
at all, especially given the paucity of RSL sites in the Pacific and
southern hemisphere oceans against which to calibrate the model.
Even within the North Atlantic basin where the model would be expected
to exhibit its greatest degree of accuracy, a 1996 study by Davis
& Mitrovica [14] of the southeastern seaboard of the U.S. found
that the ICE-3G model overestimated sea level rise in that region due
to incorrect calculation of lower mantle viscosity. From Key West to
Cape Hatteras, their recalculation of mantle viscosity resulted in a
reduced estimate of sea level rise from 2.28 mm/yr to 1.45 mm/yr.
For the other four great oceans of the world, the model can only be
judged, not according to its theoretical elegance, but in observing
how its application to the sea level problem accords with observed reality.
The IPCC estimate of +1.8 mm/yr sea level rise in the 20th century is
critically dependent opon the processing of tide gauge data using this
model.
Finally, it must be stressed that the ICE-3G model does not and cannot
correct for tectonics such as exists on the `Ring of Fire' in the Pacific.
It does not and cannot correct for local urban subsidence such as exists
in Adelaide, Venice and Bangkok. It cannot correct for subsidence of
man-structures upon which tide gauges are mounted. With or without the
ICE-3G model, all these other local errors still exist and make global
estimates of sea level change very difficult to validate.
Whatever degree of confidence is placed in this model, its use in
determining past global sea level changes means that the IPCC estimate
of +18 cm sea level rise over the last 100 years cannot be regarded
as an observed value, but as a largely modelled value
with a high error margin due to local distortions.
The IPCC Claims ...
Using historical tide gauge data, Atmosphere-Ocean General Circulation
Models (AOGCMs) and the ICE-3G model, IPCC scientists have interpreted
the past, present and future of sea levels to make these basic claims
[25] -
- Sea levels have already risen between 10 and 25 cms during the 20th
century, with a
preferred value of 18 cm, a historical rise of 1.8 mm/yr
- A `less than average' rise will occur in the Southern Ocean, how
much less is not specified.
- Sea levels changed by only 30-50 cm over timescales of several
centuries during the previous 5,000 years.
- A sea level rise of 21 to 92 cm is projected over the next
100 years, with a preferred
value of around 50 cm (representing an acceleration
in sea level rise to 5 mm/yr)
- The predicted 21st century sea level rise, is partly made up as
follows -
| Contributing factor |
Lowest estimate (cm) |
Highest estimate (cm) |
Thermal expansion of the ocean
Non-polar glacier melt [21]
Antarctica ice accumulation/melt
Greenland ice accumulation/melt
Melting of permafrost |
+20
+8
- 8
+2
+10
|
+37
+11
- 2
+5
+10
|
Most of the claims are qualified by caveats relating to changes in
water storage on land which may reduce the sea level rise by 10 cm.
If the figures appear to be inconsistent with the broader estimates,
this reflects the confusion within the IPCC itself as it wrestles with
multiple scenarios, contradictory model results and caveats about unknown
quantities such as water storage on land.
There are other significant contributing factors to sea level change
such as human land use [37] and the effect of natural internal catchments
in removing water from the ocean, but the above are considered to be
the major ones. Human activities such as irrigation, land reclamation,
flood levees, building dams and reservoirs was estimated by Sahagian
et al to have contributed at least a third of the `observed'
sea level rise during the last 100 years and will continue to do so
at a rate they estimate of 0.54 mm/yr [37]. The negative `lowest
estimate' value shown for Antarctica indicates that the IPCC now acknowledge
the possibility that the `Simpson Effect' involving increased precipitation
over the polar regions may result in a negative contribution to sea
level change in the 21st century.
The West Antarctic Ice Sheet has frequently been pointed to by environmental
activists as a source of possible catastrophic sea level rise as its
collapse would raise sea levels by about 5 meters. But according to
the IPCC and numerous other research bodies including the Australian
Antarctic Division, this possibility is off the climatic agenda for
at least 1,000 years and probably as long as 7,000 years, even with
global warming. As to the chances of it collapsing due to purely natural
reasons, this is rated by the IPCC at only 100,000:1 [25].
The IPCC have made it very clear that in their view, the changes in
sea level, past and future, are mostly driven by the state of the climate.
We must now examine the credibility of these IPCC claims, beginning
with their claim that sea levels have already risen 18 cm during the
20th century.
20th Century Sea Levels
Recent studies of tide gauge data suggest that there has been a sea
level rise in the last 100 years of between 10 and 25 cm, with a preferred
value of 18 cm, but it requires the application of the ICE-3G model
correcting the data for the effects of PGR, to establish a rise of that
magnitude. Expressed as an annual rate, the average rate of increase
is 1 to 2.5 mm/yr, with a preferred value of 1.8 mm/yr.
Once we depart from the northern hemisphere tide gauges, particularly
those from within the North Atlantic basin, and those compromised by
local tectonic activity, a very different picture emerges about sea
levels. The following graphs are either directly from the Permanent
Service for Mean Sea Level (PSMSL) [35], or drafted from data
originating from the same source.
Here is the monthly MSL from Montevideo in Uruguay, with a 12-month
smoothing added -
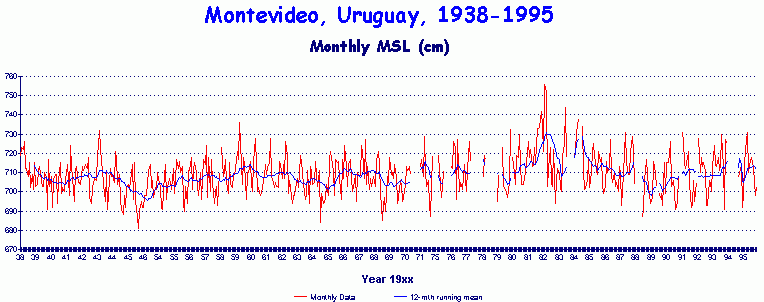
Fig.9
- Monthly and smoothed relative MSL from Montevideo, Uruguay
The record has several short breaks, and with the exception of an anomalous
peak in sea levels during the early 1980s, there appears to be little
change at all.
Crossing the South Atlantic east from Montevideo, we arrive at East
London, South Africa.
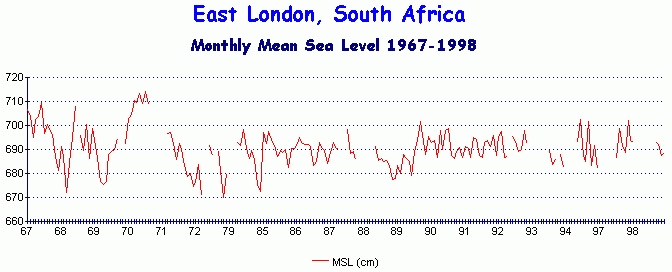
Fig.10 - Monthly MSL from East London, South Africa, 1967
to 1998
This record is also broken in parts, but other South African tide gauges
are even worse, a common problem all over the world. There we see a
peak variation in sea level of around 40 cm during the early 1970s although
there is no significant long-term trend.
Crossing the Indian Ocean, we arrive at Vishakhapatnam on the east
coast of India.
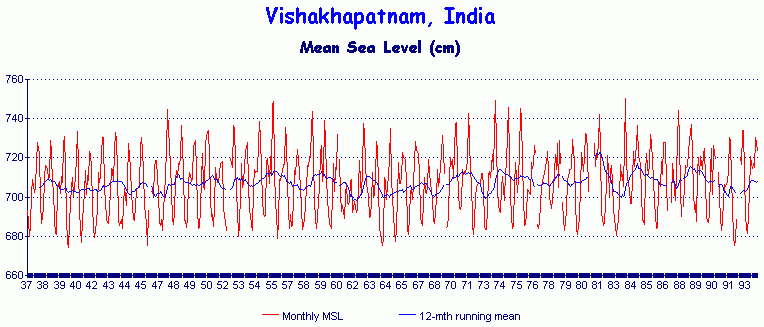
Fig.11 - Monthly MSL from Vishakhapatnam, India
This is a good quality record overall with only a few brief breaks.
There is little overall change over a 57-year record, sufficient time
to have resulted in a sea level rise of over 10 cm if the IPCC claim
were correct.
Moving southeast, we reach Australia. Here is a short-run sea level
series from Newcastle, New South Wales, Australia -
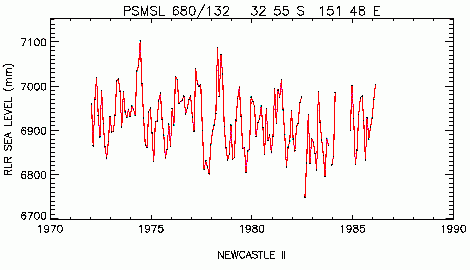
Fig.12 - Monthly MSL from Newcastle, NSW, Australia, 1972 to 1986
[34]
The time duration is only 14 years, less than the 18.6 years required
for a full cycle of astronomical variables to be played out, but we
can see that there has been an overall fall in sea level during that
time.
Moving south to Tasmania (an island state of Australia 200 miles south
of the mainland, deep in southern latitudes) at latitude 42S, we reach
Spring Bay (Fig.13).
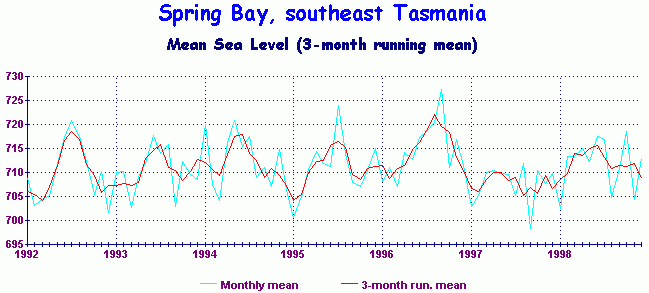
Fig.13 - Monthly MSL from Spring Bay, Tasmania, Australia, 1992 through
1998 (scale in cm)
Spring Bay has a modern state-of-art tide acoustic gauge mounted in
a rural location on coastal bedrock, thus avoiding urban subsidence
problems. This site faces directly onto the Southern Ocean and has a
very small tidal range of about 70 cm between high and low tides. Although
the record is short, there is no long-term change evident as yet.
Moving north into the western Pacific Ocean, we finish the journey
at Nauru (Fig.14).
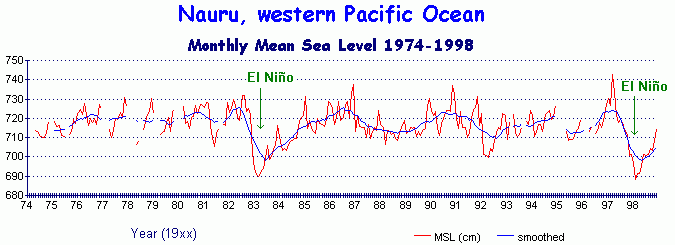
Fig.14 - Monthly MSL from Nauru, western Pacific Ocean.
Nauru clearly demonstrates the impact of the El Niño Southern
Oscillation on sea levels in the western Pacific. During the two major
El Niño events of recent years, 1982-83 and 1997-98, there is
a sharp, but temporary, fall in sea level. Statistically, this would
amount to a long-term fall in sea level over the period of record, but
it is clear from the graph that sea levels either side of the El Niño
events are largely unchanged. For this reason, it would be prudent to
exclude the anomalous effect of El Niño events from statistical
estimates of long-term sea level.
From these examples of sea level data from places known to be tectonically
stable, there is little evidence of long-term sea level rise at all.
We know that the partially enclosed North Atlantic basin is severely
affected by PGR, but once out of that basin, the effect of PGR seems
to diminish significantly, raising questions as to just how much confidence
should be placed in the ICE-3G model as it affects regions well removed
from the North Atlantic.
The Australian National Tidal Facility (NTF) at Flinders University
in Adelaide published a `Mean
Sea Level Survey' in 1998 to establish sea level trends around the
Australian coast from tide gauges having more than 23 years of hourly
data in their archive [29]. This survey was particularly relevant for
global application since Australia is tectonically stable and much less
affected by PGR than either Europe, Asia or North America. Since nearly
two-thirds of the world's total oceanic area is in the southern hemisphere,
Australia is best placed to monitor southern hemisphere trends and probably
best represents the true MSL globally. Also, the Australian coast adjoins
the Indian, Pacific, and Southern Oceans, making its data indicative
of sea levels in three oceans, not just one.
The NTF identified the following tide gauges as meeting the criteria,
and calculated the annual sea level change for each (in mm/yr). Sea
level rises are shown in red, falls in blue. The stations
run anti-clockwise around the Australian continent, starting with Darwin
in the Northern Territory. Compare these results against the claimed
IPCC rate of +1.8 mm/yr.
|
Location
|
Years of data |
Est. trend
(mm per year)
|
Darwin, NT
Wyndham, WA
Port Hedland, WA
Carnarvon, WA
Geraldton, WA
Fremantle, WA
Bunbury, WA
Albany, WA
Esperance, WA
Thevenard, SA
Port Lincoln, SA
Port Pirie, SA
Port Adelaide - Inner, SA
Port Adelaide - Outer, SA
Victor Harbour, SA
Hobart, TAS
George Town, TAS
Williamstown, VIC
Geelong, VIC
Point Lonsdale, VIC
Fort Denison, NSW
Newcastle, NSW
Brisbane, QLD
Bundaberg, QLD
Mackay, QLD
Townsville, QLD
Cairns, QLD |
34.9
26.4
27.7
23.9
31.5
90.6
30.2
31.2
31.2
31.0
32.3
63.2
41.0
55.1
30.8
29.3
28.8
31.8
25.0
34.4
81.8
31.6
23.7
30.2
24.3
38.3
23.6
|
-0.02
-0.59
-1.32
+0.24
-0.95
+1.38
+0.04
-0.86
-0.45
+0.02
+0.63
-0.19
+2.06
+2.08
+0.47
+0.58
+0.3
+0.26
+0.97
-0.63
+0.86
+1.18
-0.22
-0.03
+1.24
+1.12
-0.02
|
Eleven of the 27 stations recorded a sea level fall, while the
mean rate of sea level rise for all the stations combined is only +0.3
mm/yr, with an average record length of 36.4 years. This
is only one sixth of the IPCC figure. There was also no obvious
geographical pattern of falls versus rises as both were distributed
along all parts of the coast.
But there's more. It was shown earlier that Adelaide was a prime example
of local sea level rise due to urban subsidence [3]. It's two stations
in the above list are the only ones to record a sea level rise greater
than the IPCC estimate. The same NTF survey pointed out the Adelaide
anomaly and directly attributed it to local subsidence, not sea level
rise, on the grounds that the neighboring stations of Port Lincoln,
Port Pirie and Victor Harbour only show a rise of +0.3 mm/yr between
them. If we exclude Adelaide from the list, the average sea level rise
for the other 25 stations is then only +0.16 mm/yr, or less
than one tenth of the IPCC estimate.
If this world tour, ending with the Australian survey, were not convincing
enough, there is one further piece of evidence from Australia which
demonstrates that the IPCC, and the ICE-3G model which underpins their
predictions, is wrong about the magnitude of 20th century sea level
rise.
The `Isle of the Dead'
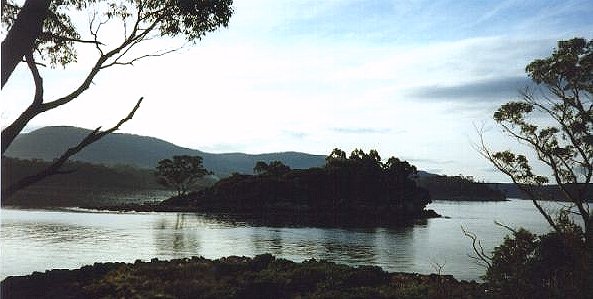
Fig.15 - The `Isle of the Dead' with Point Puer in the immediate
foreground
(Photo John L. Daly, Aug 29th 1999, late afternoon)
" `Dead Men's Isle' is a picturesquely sorrowful spot - so soothing
in its melancholy,
so placid in its solitude." (David Burn - a visitor to the `Isle
of the Dead' in 1842)
The `Isle of the Dead' is not mentioned at all by the IPCC in any of
its reports. However, there is intensive research presently underway
by several institutions [24] including Australia's `Commonwealth
Science and Industry Research Organisation' (CSIRO Marine Research Division),
assisted by the head of the Inter-Agency Committee on Marine Science
& Technology, Dr David Pugh, who is based at the University
of Southampton, UK, all focused on this sleepy little isle at the bottom
of the world in Tasmania.
The `Isle of the Dead' is over two acres in size, situated within the
harbor of Port Arthur in southeastern Tasmania . This large and undeveloped
harbor opens out directly to the Southern Ocean. The isle itself is
actually a graveyard (thus its eerie name), containing the graves of
some 2,000 British convicts and free persons from the 19th century who
lived and died at the nearby convict colony of Port Arthur between 1832
and 1870. Port Arthur is now a heritage
historic site, visited by thousands of tourists every year to see
the convict buildings and ruins, and to enjoy the popular night-time
`ghost tours'.
To understand why there is so much scientific interest in the Isle,
we must travel back in time ...
 In
September 1840, the renowned British Antarctic explorer, Captain Sir
James Clark Ross (photo), sailed from Hobart Town, the capital of
Van Diemen's Land (the former name for Tasmania) for a 6-month voyage
of discovery and exploration to the Antarctic with his two expedition
ships, `Erebus' and `Terror'.
After a highly successful voyage, he returned in April 1841 for a refit
and resupply of his ships and spend the southern winter in temperate
latitudes. Upon arrival at Hobart Town, he was disappointed to learn
that a golden scientific opportunity had been lost. A proposal by Baron
Von Humboldt to the British Colonial Secretary, Lord Minto,
that mean sea level marks should be struck on newly discovered coasts
and islands, had arrived during Ross' absence in the Antarctic. Ross
was unaware of Humboldt's proposal until he returned to Hobart Town
in 1841. He later related this in his book (published in 1847) [36]
-
"The fixing of solid and well secured marks for the purpose
of showing the mean level of the ocean at a given epoch, was suggested
by Baron von Humboldt, in a letter to Lord Minto, subsequent to the
sailing of the expedition (Ross' own expedition of the `Terror'
and `Erebus'), and of which I did not receive any account until
our return (to Tasmania) from the Antarctic seas, which is the reason
of my not having established a similar mark on the rocks of Kerguelen
Island, or some part of the shores of Victoria Land (in Antarctica)."
In spite of the missed opportunity, Humboldt's idea still appealed
to Ross and to the Governor of Van Diemen's Land, Sir John Franklin,
himself a naval man. Consequently, both Ross and Franklin made a point
of visiting Port Arthur, 40 miles from Hobart Town, to meet Thomas
Lempriere, a senior official of the convict colony there, but who
was also a methodical observer and recorder of meteorological, tidal,
and astronomical data. Here is the account Ross gives of his visit to
Lempriere at Port Arthur - .
"My principal object in visiting Port Arthur was to afford a
comparison of our standard barometer with that which had been employed
for several years by Mr. Lempriere, the Deputy Assistant Commissary
General, in accordance with my instructions, and also to establish
a permanent mark at the zero point, or general mean level of the sea
as determined by the tidal observations which Mr. Lempriere had conducted
with perseverance and exactness for some time: by which means any
secular variation in the relative level of the land and sea, which
is known to occur on some coasts, might at any future period be detected,
and its amount determined.
The point chosen for this purpose was the perpendicular cliff of
the small islet off Point Puer, which, being near to the tide register,
rendered the operation more simple and exact. The Governor, whom I
had accompanied on an official visit to the settlement, gave directions
to afford Mr. Lempriere every assistance of labourers he required,
to have the mark cut deeply in the rock in the exact spot which his
tidal observations indicated as the mean level of the ocean."
Ross further explained why he chose Port Arthur for a mean sea level
mark instead of in the Derwent estuary closer to Hobart Town, where
his ships `Erebus' and `Terror' were moored.
"The tides in the Derwent were too irregular, being influenced
greatly by the prevalence of winds outside and the freshes from the
interior, so that we could not ascertain with the required degree
of exactness the point of mean level."
The `permanent mark' at the `zero point, or general mean level of the
sea' that Ross wrote about has proved to be more permanent than even
he bargained for -
The mark is still there, and in perfect condition.
|
 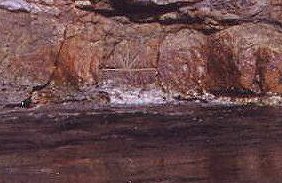
Fig.16 - The Ross-Lempriere sea level benchmark on the `Isle
of the Dead'
(photo taken by John L. Daly at mean tide, Aug 29, 1999. Benchmark
is 50 cm across)
|
In the photo above, the line and arrow mark is a standard British Ordnance
Survey Benchmark, 50 cm across, and is standing in the photo about 35
cm above the water level. Since the photo was deliberately taken at
the time of mean or half-tide for that day, we see in this one photo
the enigma that is the `Isle of the Dead'. Because, how can a benchmark
struck at "zero point" or the "mean level of the sea",
as described so explicitly by Ross, now be 35 cm above the mean
level today? Has the sea level fallen?
(For a more detailed discussion about the fascinating origins of this
benchmark, see the Appendix)
Of course, mean tide on the day of the photo may not be the long-term
MSL. However, the CSIRO has been researching the benchmark since 1995,
installing a new state-of-the-art acoustic tide gauge at the Port Arthur
jetty a mile away, setting up a network of GPS buoys around the harbor,
and involving other institutions in the effort. Their unpublished conclusion
is that the benchmark is indeed 35 cm above current mean sea
level [12].
And they cannot explain it in a manner consistent with the Ross account.
Southeastern Tasmania is believed to be uplifting very slightly due
to PGR, although there is no tectonic activity in the region. The CSIRO
installed GPS receivers and GPS marine buoys in the Port Arthur area
to test for the effect of PGR. It takes several years to get an uplift
rate accurate to within millimeters using GPS positioning. However,
the CSIRO have made a preliminary, though unpublished, uplift estimate
of 0.61 mm/yr ±0.22 mm/yr. Over the full period of 159
years since the benchmark was struck, this uplift rate would result
in a relative sea level fall of between 6.2 cm and 13.2 cm, with a mid
range value of 9.7 cm. This is only a fraction of the 35 cm to
be accounted for. However, local geological shoreline evidence indicates
an uplift much less than this at around 0.19 mm/yr, giving a
total uplift since 1841 of only 3 cm [6]. The geological figure
is probably the more accurate because it represents actual past uplift,
whereas the albeit preliminary GPS result can only represent a current
rate of uplift.
In 1888, a scientific assessment of the benchmark was made by Capt.
Shortt, who surveyed it in an effort to determine its exact origins
and meaning. He searched archives in Hobart and Port Arthur for information
and reported his findings in a short paper published by the Royal
Society in Hobart [39].
A small tablet was found above the benchmark (the tablet went missing
around 1913 [28]) and this gave Shortt the date the benchmark was struck
as July 1st 1841, at a point in the lunar month when the age of the
moon was 12 days. In order to measure sea level under similar conditions
which existed then, Shortt made his calculation of MSL and the benchmark
height when the age of the moon was also 12 days, as cited on the tablet.
His conclusion, in 1888, was that the benchmark was 34 cm above
mean sea level, only a centimetre less than the CSIRO estimate of 35
cm 112 years later. As Shortt was familiar with the Ross account given
above, he was perplexed as to why a `mean sea level' benchmark should
now be 34 cm above MSL 47 years later.
Moving forward in time to 1985, Bruce Hamon, a scientist from
Sydney, also studied the benchmark. He concluded that it was 36 cm
above MSL [22]. He examined tide data from nearby Hobart to establish
the current point in the 18.6 year cycle, so we can be confident of
his 36 cm estimate.
Hamon's was only the second, and the last, paper to appear in the scientific
literature about the Ross-Lempriere benchmark. Since then, nothing has
been published, not even interim results from the recent CSIRO research.
All that has appeared in the public domain are a few media
releases, none of which impart the vital information to the public
that a mean sea level benchmark struck in 1841 now spends most of its
time out of the water.
Since the benchmark has been observed to be the same height above relative
MSL on three sets of good observations 112 years apart (Capt Shortt
[1888], Hamon [1985] and the CSIRO [2000]), sea levels have clearly
not changed at Port Arthur in all that time. Being tectonically stable
and subject to only minor PGR, land uplift will hardly provide an adequate
explanation for the lack of sea level rise since 1888 and a possible
sea level fall between 1841 and 1888.
The benchmark powerfully confirms what the Australian
Mean Sea Level Survey [29] tells us, namely that the rate of sea
level rise over much of the 20th century has only been +0.16 mm/yr,
less than one tenth of the IPCC's estimate of 1.8 mm/yr. This survey
would imply a sea level rise of only +1.6 cm for the whole century,
consistent with observations and measurements of the Ross-Lempriere
benchmark since Capt. Shortt first observed it in 1888.
The joint `Co-ordinating Lead Author' of Chapter 11 (sea levels) of
the draft Third Assessment Report of the IPCC [25] is Dr John Church,
who heads the CSIRO Marine Research Division in Hobart, Tasmania. The
organization he heads is deeply involved in researching the benchmark
as shown by their press
release of 1998. In spite of this, there is no discussion about
the benchmark, or its implications for historical sea levels, in the
IPCC draft co-authored by Church. The draft cites old tide records from
PGR-ridden Europe and even complains about the lack of data from the
southern hemisphere, but nothing is mentioned about a 159-year-old sea
level benchmark in the data-sparse southern hemisphere which predates
most other records, and is located only 1 hour's drive from Hobart.
The most comprehensive information about the benchmark and the historical
events and personalities surrounding it comes from this
author's website, from which futher details can be obtained at the
linked references given [10] [11] [12].
There is also a discussion about the origins of the benchmark in the
Appendix
Sea Level `Secession' for the Southern Oceans
The Australian Mean Sea Level Survey of 1998 [29] may be one reason
why the IPCC have made the somewhat strange suggestion in their Third
Assessment Report draft that sea level rises in the Southern Ocean will
be less than those in the northern hemisphere. This conclusion stems
from the outputs of Ocean-Atmosphere General Circulation Models (AOGCMs)
some of which predict sharp differential trends in sea levels between
regions during the 21st century.
From the results of the survey, and the evidence of the Ross-Lempriere
benchmark which supports it, we can see that the IPCC's 1.8 mm/yr claim
for past global sea level rise is simply wrong. The source of the error
is quite probably the ICE-3G model when used to adjust tide gauge data
beyond the North Atlantic basin, and the fact that too many global inferences
are being drawn from North Atlantic data.
Rather than confront this issue directly, the IPCC and the modelers
have chosen instead to `quarantine' the Australian survey by suggesting
that the Southern Oceans can somehow go their own way when it comes
to sea level rise. Given that the southern hemisphere holds nearly two-thirds
of the world's oceans, this is clearly not a tenable position in the
long term.
Their suggestion also puts a whole new meaning on the term 'Down Under'.
The previous 5,000 years
Another claim by the IPCC was that sea levels have been largely stable
since the end of the last ice age, changing less than 30 - 50 cm
over time scales of several centuries during the previous 5,000 years
[25]. This suggests to the world's public, media and policymakers that
prior to industrialization, sea levels varied only slightly over thousands
of years.
But were sea levels really that stable over the last 5 millenia?
Not according to scientists Prof Peter Flood, Dr Robert Baker
and Dr Bob Haworth of the University of New England in New South
Wales, Australia. Their research into semi-fossilized shellfish and
calcareous coated worms in caves and walls surrounding Sydney beaches
has shown that sea levels fell 1 to 2 metres in less than 100 years
around 3,500 years ago [42] [43].
Their research challenges the assumption that sea levels have been
stable since the end of the last de-glaciation 6,000 years ago. It also
demonstrates that sea levels and climates can change significantly within
the span of a single human lifetime, that they have been changing for
centuries before industrialisation, and will continue to do so in the
future.
These scientists further point out that if sea levels were today what
they were 6,000 years ago, the present site of the Sydney 2000 Olympic
Games would be underwater. Similar rapid oscillations in sea level took
place elsewhere on the southeast Australian coast throughout the last
4000 years, again marked by horizontal strata of fossil shellfish remains
(common barnacles and tubeworms), 1 - 2 meters above the limit of the
same species at the present time. These relative sea-level changes are
unlikely to be caused by local tectonic movement, because at least 10
sites were studied from Brisbane in Queensland to Fremantle in Western
Australia, where much the same thing happened at much the same time,
all verified by AMS radiocarbon dating.
From all these sites, Prof Flood et al found there has been
a net decline of sea level over the last 4000 years of almost 2 meters
around southern and eastern Australia. They further point out that other
researchers using similar indicators have found the same general picture
in other tectonically stable, mid-latitude, far-field sites in Brazil,
Madagascar, and New Caledonia.
Back to the Future
The IPCC predictions for the 21st century of sea level rises between
21 and 92 cm, with a preferred average of around 50 cm are based on
aggregating the `Atmosphere-Ocean General Circulation Models' (AOGCMs)
used in various countries. The only thing these models agree on is sea
level rise. Beyond that, their regional distributions contradict each
other as can be seen in Fig.17 below [25].
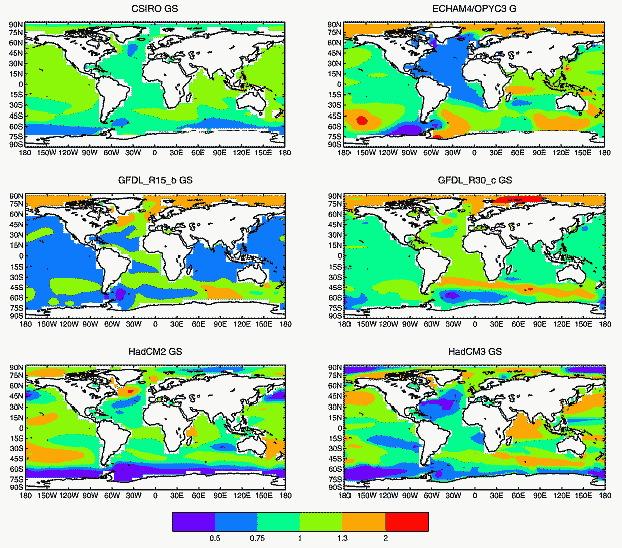
Fig.17 - Sea level change predicted between the pre-industrial period
and the late 21st century [25]
When models disagree to this extent, is there any value in averaging
them in an attempt to claim the averaged value is then more authoritative?
The ECHAM model in the top right must be the most bizarre, showing a
simultaneous difference in sea level trends in the southeastern Pacific
of over 2 meters in closely adjacent parts of the same region. The Australian
CSIRO model shows a more even global picture, while the two British
HadCM models bear little resemblance to each other. The two American
GFDL models are equally at odds at the regional level.
One interesting feature of the ECHAM model is its treatment of the
North Atlantic basin, showing it to have a smaller sea level rise than
the remainder of the world's oceans, and predicting greater sea level
rises in the southern hemisphere.
One of the key baseline parameters of all these models is that they
follow the IPCC's `IS92a' scenario [25]. This means they have built
into them the assumption that greenhouse gases, expressed as `CO2 equivalent'
will increase at a rate of 1% per year until 2100. This is an old assumption
dating back to before 1992 and is still being recycled for the 2000
assessment.
This 1% assumption has already been overtaken by events.
One of the gases in that assumption is methane. It has stopped growing
in the atmosphere as of 1992 and has now largely stabilized [20]. CFC
is now controlled by the Montreal Protocol and is no longer a relevant
factor in the long term. Other halocarbons are too insignificant to
affect the climate either way, and Nitrous Oxides are also insignificant.
We are really only left with carbon dioxide (CO2) to achieve this 1%
per year growth.
Fig.18 - CO2 growth scenarios
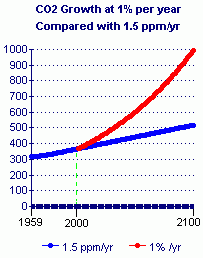 But
CO2 is not rising like that at all. Firstly, its growth is linear, not
exponential (as would be suggested by expressing it as a percentage).
Secondly, it has been growing for the last few decades by an average of
1.5 ppm per year. The effect is that the IPCC's IS92a scenario would see
an effective CO2 level of nearly 1,000 ppm by the year 2100, but
at 1.5 ppm/yr it could only reach around 500 ppm.
This has major implications for the AOGCMs in their sea level predictions
since they are using outdated, unrealistic, and exaggerated estimates
of what CO2 will be 100 years from now. Even without the issues raised
in this article about the state of sea level science generally, the
IPCC predictions themselves should be about half of what they claim
them to be, simply because of the obsolete 1% assumption.
The Poseidon Adventure
The use of satellites equipped with altimetry instruments, particularly
the `TOPEX-Poseidon' satellites, have revealed a sea level profile
of the earth which was hardly guessed at before the era of satellites
[8]. Instead of finding a `mean sea level' applicable everywhere, modulated
only by tides and weather, we find instead that the mean `Zero Point
of the Sea' can actually be different from place to place, by several
feet in some cases.
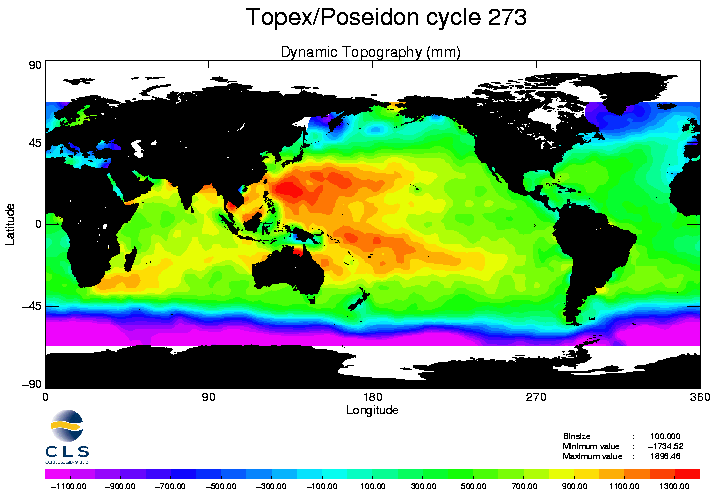
Fig 19 - The variable height of the sea as seen by Topex/Poseidon
on cycle 273 [8]
As we can see in Fig.19 there is a difference in real time sea level
by up to 1.5 metres, or around 5 feet, between the western Pacific and
the Southern Ocean. Even on the same latitudes, the western Pacific
is 1 metre higher than the eastern Pacific. During a major El Niño,
this pattern is reversed.
This is the normal background state of sea level as a similar pattern
was evident from the very earliest of the TOPEX-Poseidon missions in
1992. The difference in level between the tropics and high latitudes
is due to the centrifugal forces arising from the earth's rotation having
greatest effect at the equator. However, this would not prevent the
southern oceans from rising in level if the tropical oceans were also
rising.
Just as satellites have created a crisis within IPCC circles as to
global temperature [20], so too are TOPEX-Poseidon satellites proving
to be a problem for alarmist sea level predictions. The satellite altimeters
measure sea level on a global basis to an accuracy of 5 cm on each pass
and compare the actual surface of the earth with a `geoid' represented
by an integration between the satellite's orbital height and the center
of the earth.
Although the single-cycle accuracy of 5 cm does not seem adequate for
sea level studies where fractions of a millimeter per year are involved,
this level of accuracy can be achieved statistically once there are
multiple cycles to work with. The latest data (Fig.20) is from cycle
276 where we now have an accumulated record of data over 8 years to
establish mean sea level change to an improving degree of accuracy.
One key advantage of TOPEX-Poseidon is that sea level heights can even
be measured in the open ocean whereas tide gauges are restricted to
coastlines and islands.
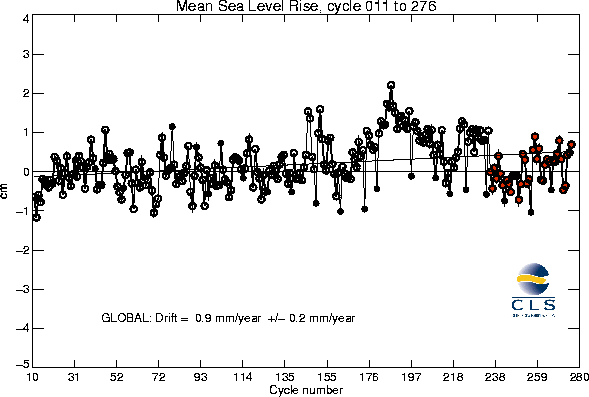
Fig.20 - global MSL variation acc. to TOPEX/Poseidon satellites.
[8]
The TOPEX-Poseidon project has also established a set of tide gauges
on islands in the Pacific Ocean fitted with GPS equipment, the purpose
of which is to calibrate the satellites to a greater level of accuracy.
In time, they should make tide gauge data redundant.
The IPCC predicts that their sea level rise rate estimate of +1.8
mm/yr will be accelerated during the 21st century to around +5
mm/yr. As Fig.20 shows, the current sea level rate of rise after
cycle 276 is +0.9 mm/yr, half the rate claimed for the last 100
years, and less than one fifth the rate claimed for the
21st century. Clearly, not only have recent sea level changes not matched
the 20th century rate of rise claimed by the IPCC, but contradicts any
idea that an acceleration might be underway as a result of climatic
warming. According to the IPCC, the 1990s has been characterized by
human-induced warming (a claim contradicted by satellite temperature
data), but the accelerated sea level rise they expected from that `warming'
has simply not happened.
As the graph in Fig.20 also shows, even that small amount of sea level
rise is primarily due to the intense El Niño of 1997-98 which
has been demonstrated to cause a temporary rise in global sea level
(although it causes a local fall in level in the western Pacific). We
can see that the sea level following the El Niño is much the
same as sea level prior that event. The CNES based in Toulouse in France
which co-sponsors the satellites, also attributes the sea level rise
since 1992 squarely on the 1997-98 El Niño [9].
Once there is a longer period of satellite data, the effect of that
El Niño will diminish in the statistically averaged sea level
result. If we were to exclude the effect of the El Niño from
the sea level result, there would scarcely be any sea level rise registered
at all.
Conclusion
The world's public was given the clear impression that the claimed
18 cm sea level rise for the 20th century was an observed quantity.
It is now clear that this is not the case. The 18 cm figure arrived
at is the product of combining data from tide gauges with the output
of the ICE-3G de-glaciation model.
The logical equation here is simple.
an observed quantity ± a modeled quantity =
a modeled quantity
Thus, the claimed 18 cm sea level rise is a model construct, not an
observed value at all.
Worse still, the model which has created it is primarily focused on
the North Atlantic basin which shows relative sea level trends quite
unlike those observed outside that region. Thus, global estimates cannot
be inferred with any confidence from modeled trends which mainly affect
only that basin.
In the remaining oceans of the world, there is a clear lack of evidence
of sea level rise during the 20th century, particularly around the Australian
coast which is representative of three oceans, with a good quality record
of tide gauge data. The rise recorded there is an insignificant 1.6
cm for the whole century, or just over half an inch.
The lack of sea level rise around Australia is confirmed by a similar
lack of sea level change as measured since at least 1888 against the
Ross-Lempriere benchmark carved on a rocky natural cliff on the `Isle
of the Dead' in Port Arthur, Tasmania. It is also possible that a significant
sea level fall took place between 1841 (when the benchmark was struck)
and 1888 when its height was accurately measured. The only other tide
gauge records which go back that far are very few in number and all
come from regions severely affected by PGR within the North Atlantic
basin. Thus, they cannot be considered as conclusive evidence against
a possible global sea level fall during that period.
Outside the North Atlantic basin, most of the other tide gauges with
long-term records have been mounted in tectonically active areas, especially
on the west coast of North America and New Zealand, and are thus unsuitable
for measuring global trends. Many others are subject to local subsidence.
As to the future, the IPCC suggest an acceleration in sea level rise
to nearly 5 cm/yr [25]. However, the TOPEX-Poseidon satellites
are now showing a current sea level rise of only 0.9 mm/yr, [8],
all of which has been attributed to the 1997-98 El Niño event
[9]. Sea levels have been largely unchanged from both before and after
that event and so the 0.9 mm/yr `rise' shown is merely a statistical
artifact and not a true rise in the background sea level.
Finally, it should not be forgotten that whatever is said about sea
levels is entirely dependent upon how global climate responds to greenhouse
gases, whether the planet will warm significantly or not [45]. Sea level
rise is contingent on atmospheric warming.
No warming, no sea level rise.
The record of atmospheric temperature as recorded by satellites since
1979 has shown no significant warming in spite of numerous model predictions
to the contrary.
John L. Daly
19th August 2000
Appendix
The Origins of the `Isle of the Dead' Benchmark
by John L. Daly
In the attached report, the main focus on
the 1841 Ross-Lempriere sea level benchmark was to demonstrate how sea
levels had scarcely moved since 1888 when it was first investigated
and its exact height measured by Capt. Shortt [39]. But where the mark
was struck originally and the circumstances surrounding it is still
the subject of some dispute and makes a fascinating story in its own
right.
The benchmark is engraved on a rocky natural cliff on a small isle
(the `Isle of the Dead') within the harbor of Port Arthur in southeastern
Tasmania, an undeveloped harbor which opens directly to the Southern
Ocean. The idea for the benchmark came from Capt. Sir James Clark
Ross, the renowned British Antarctic explorer and marine scientist,
acting in collaboration with Thomas Lempriere, an official of
the convict colony at Port Arthur.
Here again is what Ross said about the benchmark in his 1847 book.
"The fixing of solid and well secured marks for the purpose
of showing the mean level of the ocean at a given epoch, was
suggested by Baron von Humboldt, in a letter to Lord Minto, subsequent
to the sailing of the expedition (Ross' own expedition of the `Terror'
and `Erebus'), and of which I did not receive any account until our
return (to Tasmania) from the Antarctic seas, which is the reason
of my not having established a similar mark on the rocks of Kerguelen
Island, or some part of the shores of Victoria Land (in Antarctica)."
Having missed that opportunity, he went with Governor Franklin to Port
Arthur in 1841 to see Thomas Lempriere who had observed and recorded
tidal, astronomical, and meteorological observations over several years.
Ross goes on -
"My principal object in visiting Port Arthur was to afford a
comparison of our standard barometer with that which had been employed
for several years by Mr. Lempriere, the Deputy Assistant Commissary
General, in accordance with my instructions, and also to establish
a permanent mark at the zero point, or general mean
level of the sea as determined by the tidal observations
which Mr. Lempriere had conducted with perseverance and exactness
for some time: by which means any secular variation in the relative
level of the land and sea, which is known to occur on some coasts,
might at any future period be detected, and its amount determined.
The point chosen for this purpose was the perpendicular cliff
of the small islet off Point Puer (the `Isle of the Dead'), which,
being near to the tide register, rendered the operation more simple
and exact. The Governor (Sir John Franklin - a naval man), whom I
had accompanied on an official visit to the settlement, gave directions
to afford Mr. Lempriere every assistance of labourers he required,
to have the mark cut deeply in the rock in the exact spot which
his tidal observations indicated as the mean level of the ocean."
Explaining why he chose Port Arthur for a mean sea level mark instead
of in the Derwent estuary closer to Hobart Town, where his ships `Erebus'
and `Terror' were moored, he wrote -
"The tides in the Derwent were too irregular, being influenced
greatly by the prevalence of winds outside and the freshes from the
interior, so that we could not ascertain with the required degree
of exactness the point of mean level."
The emphases have been added to highlight key points. Ross refers to
the intended mark as being `mean sea level' or `zero point', no less
than 5 times in these short extracts. His intention in respect
of the benchmark is therefore clear and unmistakeable. The mark was
intended as a mean sea level mark, not a mere tide mark which would
only be of use in Port Arthur, nowhere else. The CSIRO did not mention
any of Ross' words in a lecture they gave to the Hobart Royal Society
in April 2000, and repeatedly used the expression `tide mark' instead
of `sea level mark' throughout the lecture.
The exact date on which the Ross-Lempriere benchmark was struck is
known - July 1st 1841, because a small stone tablet was placed
above it on the clifftop. The tablet went missing around 1913 [28],
but there are two witnesses who reported what was inscribed on it. The
first, a Mr Mason [39] acting for Capt. Shortt, complained the
tablet was badly eroded and difficult to read. He quoted its words in
1888 as follows -
"On the rock fronting this stone a line denoting the height
of the tide now struck on the 1st July, 1841, mean time, 4h. 44m.
p.m.; moon's age, 12 days; height of water in tide gauge 6 ft. 1 in."
Three years later in 1891, a second witness, a yachtsman cruising
aboard the yacht `Wanderer' , wrote an account of his voyage
in a Melbourne magazine under the pen name `Eight Bells' [16]. He visited
the Isle of the Dead and was interested in the numerous gravestones,
one of which he sketched and quoted (the gravestone he quoted from is
still there today, bearing the exact words he reported) [28]. Then he
noticed that -
"...a few yards away, on the rocks fringing the shore and facing
the east, was a curious little stone, erected it is said, by Captain
Ross, of the `Erebus' and `Terror' Antarctic expedition,
during the interval between the visits to the south polar regions.
It bears the following inscription:-
`On the rock fronting this stone a line, denoting the height of the
tide, was struck on the 1st July, 1841. Mean time, 2.44 p.m. Moon's
age, 12 days. Height of water in the tide gauge, 6 ft 1 in.' "
Both quotes from the tablet are presented above exactly as published,
word for word, comma for comma. The differences between the two versions
are clearly evident. The grammar is different (Mason's `now struck'
versus the yachtsman's `was struck'), the time formatting is different
(Mason's `4h. 44m. p.m.' versus the yachtsman's `2.44 p.m.') and as
is now obvious, the big 2-hour disagreement over the time. Lempriere's
tide gauge data for 1841 and 1842, has only recently been discovered
in the Royal Society archives in London, and here is a section from
his tide log in his own handwriting for July 1841, including July 1st.
[27].
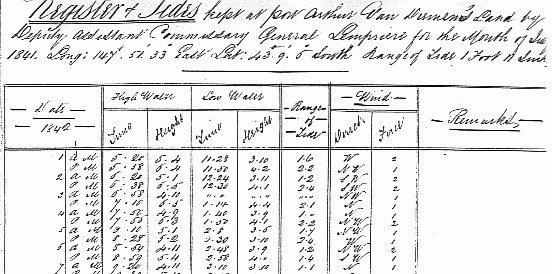
Fig.x Lempriere's tide entries for July 1841. Note the similarity
of 5's and 6's
From the data shown here for July 1st 1841, low tide was at 11.28
a.m. with a height of 3 ft 10 in. High tide was at 5.58
pm with a height of 6 ft 4 in. It was sometime between these
two tides that the benchmark was struck.
We can infer that mid tide for that day occurred at exactly 2.43
p.m. with a tide height of 5 ft 1 in. These are the exact
mid-points between the two times and the two tide heights logged. The
reported tide gauge height of 6 ft. 1 in. is only 3 inches short of
high tide and could not possibly represent MSL. However, 5ft 1in certainly
could be Ross' `zero point of the sea', as this height was not only
the mid-tide height for that day, but is also the MSL average for the
preceding month of June just prior to the striking of the mark on July
1st. If the yachtsman was right about the time, he merely mis-read the
`6' in the `6 ft 1 in' entry on an eroded tablet when it should have
been a `5' to give 5 ft 1 in.
Mistaking a `6' for a `5' and vice-versa is a common mistake we all
make even today, especially when reading poorly reproduced photocopies
and faxes. A 50-year old tablet exposed to the elements would be just
as difficult to read as any bad fax copy. In the unlikely event of Mr
Mason being right about the time being 4.44 p.m. that would have coincided
with a tide of 6 ft 2 in, not 6 ft 1 in. - close, but not exact.
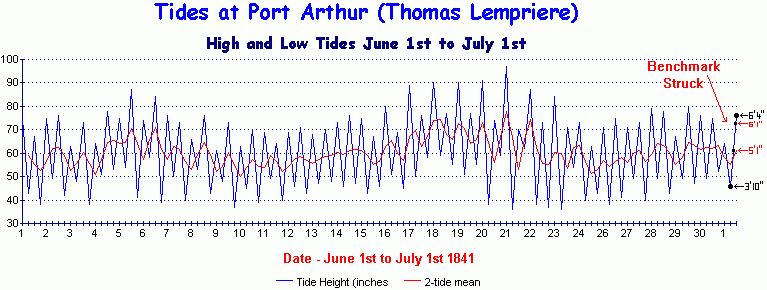
Fig.x
High and Low tides for Port Arthur in June/July 1841, with a two-tide
smoothing (in red)
This chart of the tides in Port Arthur for the month preceding July
1st shows that 5ft 1in was clearly the closest height to MSL for that
month, 6ft 1in being outside the range of possible estimates.
Four factors point to the yachtsman's time of 2.44 p.m. being correct,
with a consequent height of 5 ft. 1 in, instead of the 6 ft. 1 in. he
actually reported.
1) `2.44 p.m.' reported by the yachtsman is formatted exactly
as Lempriere does it in the above log. Mr
Mason says it is `4h. 44m. p.m.', not the formatting style used
by Lempriere at all.
2) Mason reported difficulty reading the tablet due to erosion. Erosion
could easily make a `5'
look like a a `6' to both observers.
3) Mason's time of 4.44 pm was local mean time, equivalent to 4.55
p.m. Australian Eastern
Standard Time. Being only 9 days past the
winter solstice deep in the southern hemisphere,
the sun had already set, leaving the
Isle in twilight, hardly suitable conditions for survey work.
The yachtsman's time of 2.44 p.m. was mid-afternoon
in bright sunlight (confirmed from Lempriere's
meteorological log), conditions much better suited to such a precision
task.
4) The tide height of 5 ft. 1 in. is not only the height of mean
tide for that day, but is also the mean
sea level one could calculate for the
entire month as shown in the graph. It is also the exact height consistent
with the time of 2.44 p.m. reported by the yachtsman.
There was clearly no point in striking a benchmark at 6 ft. 1 in. when
it does not mark mean sea level (as insisted upon by Ross several times),
does not mark high water (which occurred over an hour later), does not
mark low water, and indeed does not mark anything at all except an arbitrary
height on a tide gauge which no longer exists. A `benchmark' which depends
on the continued existence of a local tide gauge for its meaning, is
not really benchmarking anything.
Since high or low tide is specific only to the location in which it
occurs, only a mean sea level mark, having wider global implications,
would have interested Ross, given what he said about Baron Von Humboldt's
proposal. Ross and the colonial governor, Sir John Franklin, were both
keenly interested in this benchmark precisely because of Humboldt's
proposal, and it is inconceivable that the mark would be struck anywhere
else other than `zero point' or `mean sea level' as stated very explicitly
by Ross several times. Anything less would hardly have rated a mention
in his book about his Antarctic voyages.
The conclusion to be drawn from the body of evidence is that the yachtsman
got the time right, and that the only possible associated tide height
for that time, Ross' `zero point', must therefore be 5ft 1in.
Even allowing for the CSIRO's provisional mid-range GPS estimate of
9.7 cm for land uplift over the 159-year period, there is still have
an apparent fall in sea level of just over 25 cm to be accounted for
(35 - 9.7 = 25.3 cm). Since most tide gauges record variations in sea
level of that magnitude over months and years, as is clearly demonstrated
in the tide gauge graphs in the main article, there may not really be
any need to account for it at all. It is clear that a general fall in
sea level did not happen in the 20th century as other tide gauges
around the world (which became more numerous in the 20th century than
in the 19th), would have recorded it, so we must look to the 19th century
for an answer to the `Isle of the Dead' enigma.
Mr Mason who read the tablet with some difficulty in 1888 was acting
for a marine researcher, Capt. Shortt, who was investigating
the origins of the benchmark and searching archives in Hobart and Port
Arthur for information about it, and without the benefit of Lempriere's
tide data. Shortt reported his findings in a short (sic.) paper
published by the Royal Society in Hobart [39].
In order to measure sea level under similar conditions which existed
on July 1st 1841, Shortt compared MSL and the benchmark height when
the age of the moon was 12 days, as cited on the tablet. His conclusion,
in 1888, was that the benchmark was 34 cm above mean sea level,
only a centimetre less than the CSIRO estimate of 35 cm 112 years later.
Shortt also noted that -
"...it is interesting to place on record, that Captain Miles
has learnt from the half-casts in the Furneaux Group they have noticed
within the last few years that there seems to be less depth of water
over certain well-known rocks near the islands than formerly."
(The Furneaux Islands are half way between Tasmania and the mainland
at the eastern end of Bass Strait. Descendants of Tasmanian aborigines
were resettled there during the 19th century by the colonial authorities.
A general sea level fall at Port Arthur during the 19th century would
certainly have been noticed there also as the aborigines frequently
engaged in inshore fishing).
Further evidence for a sea level fall comes from period paintings of
Port Arthur, all of which show a higher shoreline in the colony precincts
than exists today. Indeed, large wooden vessels were unloading cargoes
right inside the cove where Port Arthur sits, but today there is insufficient
depth of water to do that.
In 1985, Hamon used `hindcasting' of the Hobart data to predict, retrospectively,
the state of the tide back in 1841 [22]. Hamon's hindcasting matches
Lempriere's data closely, so it can be safely assumed that Lempriere's
tide gauge and his data log are also accurate.
Drs John Hunter (CSIRO), David Pugh (Univ. of Southampton,
UK) and Richard Coleman (Univ. of Tasmania) jointly authored
a confidential internal report for the CSIRO [24], but have not published
anything in the scientific literature. Their recent conclusions, reported
in this article, comes from a lecture they jointly delivered in April
2000 to a small audience at the Royal Society in Hobart [12], a lecture
I also attended.
Surprisingly, the Ross written account about the benchmark was not
raised once by either of the three speakers. They merely mentioned him
as having an idea for a `tide' mark (as distinct from a `sea level'
mark) without informing the audience exactly what he had written. When
relating the details about the tablet, they informed the audience about
Mr Mason's version, but not a word about the yachtsman's version, even
though they are familiar with both.
When earlier questioned by the Melbourne
`Herald-Sun' on the issue [4], Hunter claimed that Ross must
have `mis-remembered', and in fact carved the mark above mean
tide to show where he'd measured the tide in a tide gauge. This scenario
would render the whole exercise pointless and contrary to Humboldt's
proposal and contrary to the Governor's instructions. When questioned
by the
BBC, [2] Pugh said "From all the evidence we know, it was the
high water level at that time". He obviously did not regard Ross'
own words on the matter as constituting any part of "all the evidence".
Ross was an early pioneer of sea level research, being the first scientist
to be credited with calculating a correction factor for sea levels due
to variations in atmospheric pressure [32]. Thus he was no mere amateur
at the science of sea levels as Hunter and Pugh seem to imply.
In keeping with the lack of publicaton in scientific journals about
the benchmark, no written paper was offered at the lecture, the information
given here being based on notes taken by myself. Without publication
in the scientific literature, the IPCC can choose to ignore even of
the existence of the benchmark, let alone integrate it into their assessments
of past and present sea level change.
John L. Daly
19th August 2000
References
(This references list is common to both the main sea levels report
and the appendix)
[1] Balling R. & Michaels P, "The Satanic Gases", Cato
Institute, Washington D.C., 2000
[2] BBC Sci/Tech Online News, "Mark
of a Hot Dispute", Oct 7 1999
[3] Belperio, A, "Land Subsidence and Sea-level Rise in the Port
Adelaide Estuary: Implications for Monitoring
the Greenhouse Effect", Australian
Journal of Earth Sciences, v.40, p.359-368, 1993
[4] Bolt, A, "Maybe
we aren't all going to drown in rising seas after all", Herald
Sun, Melbourne, Feb 14, 2000
[5] Bryant, E. "The Greenhouse Conspiracy", The Optimist,
Nov/Dec 1988
[6] Bugg, R., (1990), "Waves and Coastlines" in "Behind
the Scenery - Tasmania's Landforms and Geology",
Dept. of Education & the Arts, Hobart,
Tasmania, pp 96-97
[7] Canadian Hydrographic Service, Tidal Manual, 1999
[8] CNES online
MSL data for TOPEX-Poseidon cycle 276 - (click on `mean sea level
monitoring' link)
[9] CNES online "El
Niño is behind rise in sea level"
[10] Daly, J. "The
Isle of the Dead - Zero Point of the Sea?", Sept 1999,
[11] Daly, J., "The
Isle of the Dead - Zero Point of the Sea - the Evidence", Sept
1999,
[12] Daly, J., "The
Lecture at the Royal Society", April 2000,
[13] Daly, J. "The Greenhouse Trap", Bantam Books, Sydney,
1989
[14] Davis, J. & Mitrovica J, "Glacial Isostatic Adjustment
and the Anomalous Tide Gauge Record of Eastern North America,
Nature v.379, p.331, Jan 25 1996
[15] Denys, P. & Hannah, J, "GPS
and Sea Level Measurements in New Zealand", Dept. of Surveying,
Otago University, NZ,
[16] `Eight Bells', The Australasian, "Notes of a Yachting Trip",
6th Feb., p.281, 1892
[17] Ellsaesser, H., "Oceanic Role in Terrestrial Climate",
Lawrence Livermore W-7405-Eng-48 in
"The Ocean in Human Affairs"
edited by S. Fred Singer
[18] George, M., astronomer, Queen Victoria Museum, Launceston, Tasmania.
Personal Communication, June 2000
[19] Gornitz V, "Relative
Sea-Level Rise and Vertical Land Motions, U.S. West Coast",
NDP-043C Appendix D &
E), CDIAC, DEC 1997
[20] Gray V, "The IPCC Future Projections: Are They Plausible?",
Climate Research, v.10, p.155-162, 1998
[21] Gregory. J. & Oerlemans J, "Simulated Future Sea-Level
Rise due to Glacier Melt based on Regionally
and Seasonally Resolved Temperature
Changes", Nature, v.391, p.474, 1998
[22] Hamon B. (1985) "Early Mean Sea Levels and Tides in Tasmania",
Search, vol.16, No.9-12, Oct/Dec, pp.274-277
[23] Houghton, J. et al. "Climate Change 1995: The Science of Climate
Change", Cambrdge Univ. Press, UK, 1995
[24] Hunter J. & Pugh, D. (1998), "The Tidal Benchmark at Port
Arthur", CSIRO, Internal Report OMR-85/98 (unpublished).
[25] IPCC Third Assessment Report, Chapter 11 (draft), January 2000
[26] Jacobs S, "Is the Antarctic Ice Sheet Growing?", Nature,
v.360, Nov 5 1992, p.29
[27] Lempriere T. (1841-1842) "Register of Tides Kept at Port Arthur",
from the Royal Society archives, London
[28] Lord R., (1995) "The Isle of the Dead - Port Arthur",
Richard Lord and Partners, Taroona, Tasmania,
(4th edition) pp. 24-28
[29] Mitchell B. et al., "Australian
Mean Sea Level Survey", National Tidal Facility, Flinders University,
Australia
[30] Miller G. & de Vernal A., "Will Greenhouse Warming Lead
to Northern Hemisphere Ice-Sheet Growth?",
Nature, v.355, p.244, 1992
[31] Morgan V. et al, "Evidence from Antarctic Ice Cores for Recent
Increases in Snow Accumulation",
Nature, v.354, Nov 7
1991, p.58
[32] Negretti & Zambra, "A Treatise on Meteorological Instruments",
Baros Books 1995 reprint , UK. 1864
[33] Peltier W. & Tushingham M., "Global Sea Level Rise and
the Greenhouse Effect: MIght They be
Connected?", Science
v.244, 19 May 1989, p.807
[34] Peltier W. & Tushingham M. "ICE-3G: A New Global Model
of Late Pleistocene Deglaciation based upon
Geophysical Predictions of
Post Glacial Relative Sea Level Change", Journal of Geophysical
Research,
v.96, p.4497, 1991
[35] Permanent Service for Mean Sea Level, online
tide gauge database
[36] Ross, Capt. Sir J.C, "A Voyage of Discovery and Research
in the Southern and Antarctic Regions,
During the Years 1839-43",
John Murray, London, pp.22-32. 1847
[37] Sahagian D. et al., "Direct Anthropogenic Contributions to
Sea Level Rise in the Twentieth Century",
Nature v.367, 6 Jan 1994.
[38] Schneider, D. "The
Rising Seas", Scientific American, Aug. 1998,
[39] Shortt, Capt., "Notes on the Possible Oscillation of Levels
of Land and Sea in Tasmania During Recent
Years", Royal Society
of Tasmania papers, Hobart, pp.18-20. 1889
[40] Simpson, Sir G., "Ice Ages", Nature, v.141, no.357, p.591-598,
1938
[41] Singer, S.F., "Will Global Warming Raise Sea Levels?",
Science & Environmental Policy Project,
2000
[42] Smith's Online, "Scientists
Crack the Climate and Sea Level Code", Univ. of New England,
NSW, v40, no.23,
Dec 10 1999.
[43] Smith's Online, "Study
Challenges Theory on Greenhouse Sea Level", Univ of New England,
NSW, v.38,
no.24, Dec 19 1997
[44] Titus, J. et al, "Greenhouse Effect and Sea Level Rise: The
Cost of Holding Back the Sea",
Coastal Management 19:171-210
[45] Wigley, T. & Raper, S. "Implications for Climate and Sea
Level of Revised IPCC Emissions Scenarios",
Nature v.357, 28 , p.293, 1992