1.1
While signing the committee's majority report in my capacity as Chair, I
and other government members on the committee do not agree with all of the
conclusions and recommendations contained in the majority report. This
dissenting report broadly outlines the views of government members, where these
differ from the views found in the majority report.
Introduction
1.2
Rolling out the next-generation NBN to all Australians as quickly as
possible is a priority for the Coalition Government. But national objectives
must always be tempered by economic reality, and tested by thorough public
scrutiny.
1.3
In the eight years since the National Broadband Network (NBN) was
conceived, there have been a multitude of parliamentary inquiries and hearings
to examine NBN Co Limited's (nbn's) performance in delivering on its purpose,
as expressed in the Government's Statement of Expectations, to ensure all
Australians have access to fast, affordable broadband as soon as possible, and
at least cost. Almost all of these reviews have occurred during the term of
the Coalition Government.
1.4
On all measures, Bill Morrow and the rest of the executive team at nbn
have done a phenomenal job in turning the company around. The NBN is
Australia's largest and most complex infrastructure project. It will be a key
facilitator for innovation in the nation. In a sense it will be the sinews of
the Australian economy in the 21st Century, especially for
households and small business. Critical to this is how fast the network can be
rolled out, and what prices householders and businesses pay for access to the
network.
Performance measurement
1.5
When judging nbn's performance it is reasonable to assess the
management's record in meeting business plan targets as set out in annual
corporate plans, as required of Commonwealth companies by the Public
Governance, Performance and Accountability Act 2013.
1.6
nbn's record in meeting or exceeding its financial and rollout targets
for three consecutive financial years stems from the Coalition Government's
reforms which gave nbn the flexibility to choose the right broadband technology
for each location. This approach aims to reduce costs, save time and limit
inconvenience to households and businesses during the transition to the new
network.
1.7
Under the Coalition Government, this important infrastructure project is
continuing at a more manageable cost and is on track to deliver all households
access to better broadband by 2020. An important point is that someone must in
the end pay for the network. This means that if the cost of the network
increases, the increase must either be paid for by consumers through higher
retail prices, or tax payers through more funding. Figure 1 represents the
difference in financial profiles between the MTM approach and the all-FTTP
approach.
1.8
The committee majority report implies at several points that there is a
risk nbn will fall short of the Statement of Expectations regarding the speed
of services provided to the fixed line footprint.
1.9
In fact, elsewhere in public statements, responses to Questions on
Notice and evidence presented to parliamentary committees, nbn has indicated
that the average speed attainable on nbn's fibre to the node (FTTN) network is
67.7 megabits per second (Mbps) and 101.6 Mbps on the fibre to the basement
(FTTB) network. The average attainable rate across both networks is 70.4 Mbps
(page 101).
1.10
While the network speed baseline is nominally set at the universal
minimum 25 Mbps, at least 9 in 10 premises in the fixed line footprint will
have wholesale speeds of at least 50 Mbps at rollout completion under the
direction set by the Statement of Expectations. Furthermore, an upgrade path
will provide close to half of all premises on the network access to speeds of
up to 500 Mbps as demand emerges.
Source: nbn quarterly
report.
1.11
Paragraph 1.28 of the committee majority report also misrepresents the
findings and purpose of the 2013 NBN Strategic Review. The objectives of the
review were to assess the progress and cost of the rollout at that time, as
well as the economic viability of nbn under alternative rollout scenarios. The
Strategic Review also evaluated the likely operational and financial position
of nbn based on the continuation of the fibre-to-the-premises rollout targeting
93 per cent of premises.
1.12
The strategic direction recommended by the review was that NBN Co should
develop an 'optimised multi-technology approach' to rollout out the network
that balanced fast broadband deployment to the highest number of Australians
with better economics.
1.13
Far from being an outlier, nbn's 'incremental upgrade' approach has been
adopted in other countries such as Austria, Germany and the UK, to enable
further investment to be staged as demand emerges, in parallel with technology
advances.
Rollout progress
1.14
By mid-2017 nbn had exceeded its rollout targets and financial forecasts
across three full financial years. The cost overruns and connection delays that
plagued the early rollout under the former Labor Government have been resolved.
1.15
Over little more than three years, the number of premises able to access
the NBN network has grown from 504,000 premises reached, to more than six
million in the NBN's national footprint.[1]
Similarly, customers connected to the built network stood at 51,000 in
September 2013. In September 2017 there are more than 2.8 million services in
operation and nbn's wholesale revenues have exceeded $1 billion annually and
continue to grow.
1.16
Figure 2 demonstrates the rapid rollout since switching to an MTM model.
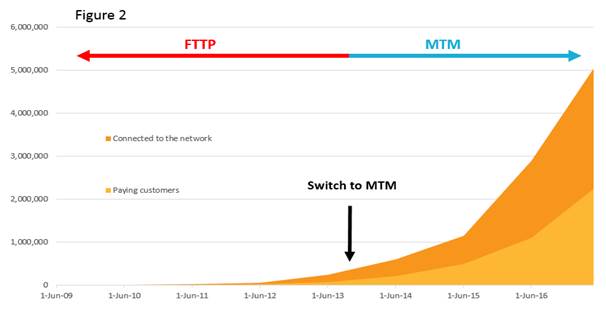
1.17
nbn's Corporate Plan 2018-21, released in August 2017, shows the
NBN rollout remains firmly on track to deliver fast broadband to all Australian
homes and businesses by its target of 2020, having achieved two consecutive
years during which the network footprint was nearly doubled.[2]
1.18
The plan will see three-quarters of Australian premises able to access a
service over the nbn network by mid-2018, with 4.4 million active services by
that time. These forecasts are in line with targets the company set more than
two years ago.
1.19
The Corporate Plan reports that network construction and activation is
nearing peak with more than 6,000 direct nbn employees and an external field
workforce of 24,000 contractors working to build the network and connect homes
and businesses across every square kilometre of Australia.
1.20
Capital expenditure reached $5.8 billion in FY2017. More than 70 per
cent of nbn's procurement spend to date has been on local content – that is,
Australian manufacturing, construction, installation and support activities.[3]
1.21
End-user activations were higher than forecast in 2016-17 and the NBN is
now being switched on at 1,000 Australian premises every working hour. There
are more than five times as many users on the network today compared to just
two years ago.
1.22
The committee majority report at paragraph 2.29 argues that nbn has no
capacity to upgrade the network. This is in stark contrast to both the
Statement of Expectations (which requires nbn to ensure that upgrade paths are
available as required) and the facts. In the past year nbn has:
-
introduced new fibre-to-the-curb technology that will be
available from 2018 to around one million premises;
-
announced Sky Muster satellite users will gain access to 50 per
cent more peak data and twice as much off-peak data; and
-
trialled speeds up to 100 Mbps delivered over the fixed wireless
service.
1.23
That nbn has been given the flexibility to choose the best technology
for each part of Australia is the very reason that these upgrades have been
possible, in contrast to the technological ideology of the previous Government.
1.24
Of course, even though these factors were brought to the committee's
attention, nonetheless the committee majority has formed the view that upgrades
across the nbn network are required (although not costed). In paragraph 2.88
the committee majority appears ignorant of the costs of wholesale upgrade, and
in paragraph 2.89 appears to confuse speed with capacity.
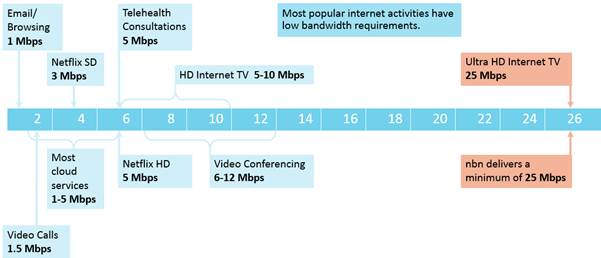
1.25
As figure 3 clearly shows, most user applications require far less speed
than what will be delivered over the NBN. The reality is that, aside from a
few niche products (that are largely focused on video streaming and related
entertainment applications) there are currently few products or applications
that require speeds higher than 25 Mbps. It is the case that under current
technology specifications (including compression technology) multiple ultra
high definition video streams might require speeds of 75 Mbps or more (on the
basis that households have access to ultra high definition televisions and
content), although it is questionable whether the Australian taxpayer should be
subsidising such uses.
Figure 3. Speeds required to
support typical household and office applications (Mbps)
1.26
The argument cited at paragraph 2.81 of the committee majority report,
that Australia has been dropping in internet speeds, fundamentally
misunderstands the Akamai index upon which those claims are based. Akamai
measures the total speed achieved or requested though its global services (i.e.
demand, not supply). Consequently, countries with high concentrations of a
small number of high usage consumers achieve a relatively higher ranking.
1.27
The strength of the Government's rollout is affordability and ubiquity –
all Australians, regardless of where they live, will have access to high speed
broadband of 25 Mbps or more by 2020, at affordable prices. Demand for speed in
Australia is also depressed compared to some other countries because of the
compression technologies being used (the ABC, for example, asks that users have
an internet speed of 1.5 Mbps or more for best results).[4]
1.28
Ironically, an all FTTP rollout would have meant a lower ranking
for longer because of the much slower pace of the rollout and consequent
delayed switch over from slower ADSL-based broadband.
Meeting financial forecasts
1.29
The estimated peak funding is forecast to reach $48.8 billion in
financial year 2020. This remains unchanged from nbn's forecast in the two
previous corporate plans. nbn forecasts that its revenue will almost double in
the coming financial year, from $1 billion in 2016-17 to $1.9 billion in
2017-18. The internal rate of return for the project is forecast to be within
the range of 3.2 to 3.7 per cent based on peak funding of approximately $49
billion and a terminal value calculated at six times EBITDA.
Activations and service take-up
1.30
At the end of each of the last three financial years, nbn's activations
have been ahead of forecast. Further, nbn's public statements on take-up rates
by the end of the 18-month migration period—and 2018 Corporate Plan forecasts
of RFS and activations—suggest the proportion of activated services at the end
of FY2021 will be 73.5 per cent, across all technologies.
1.31
The committee majority report at paragraphs 2.17 and 2.6 suggests there
is doubt around nbn's take-up forecast because the proportion of services
activated is currently less than 70 per cent. However, the clear trend from
service activation rates over the past three years indicates nbn's forecasts
have been on the conservative side. A closer analysis of the data would reveal
that the proportion of premises in serving area modules that are live increases
as time goes on. It is obvious that the activation rates will lag the ready for
service progress because nbn has been expanding the network footprint at a
faster rate than the connection runrate. For example, in FY2018 nbn plans to
deliver nbn access to a further three million premises but during the same
period the company will connect two million premises. Therefore the proportion
of connected premises in the total footprint in a year's time will remain
relatively steady at 50 per cent.
Upgrade paths
1.32
The Statement of Expectations which sets the overarching objectives and
direction for nbn makes explicit the requirement for nbn to design and build
the network with upgrade paths available for future development. On several
occasions and in various forums, including hearings of this committee, nbn has
confirmed that the multi-technology mix is delivering an upgrade path for FTTN
and its variants, as well as HFC.
1.33
In his evidence at the committee's Sydney public hearing, nbn Chief
Financial Officer Stephen Rue explained the underlying business rationale for
selectively investing in speed increases via technology upgrades:
[T]he typical way you do long-term planning is...apply
parameters of CPI for both revenue and costs and we apply a ratio of CAPEX to
revenue, which, in our case, are around about 15 per cent. It is true some of
that 15 per cent could be applied to upgrades, but...it's not locked in... So
what we would do is we would look at business cases for upgrades as and when
they come and we would apply capital where it made business sense to do so.
There would be an overlay, if you like, to our corporate plan, and you would
only do it when it improved the corporate plan.[5]
The committee majority report conclusion of paragraph 2.90 is
at odds with the usage patterns, speed tier take-up, and choice of plan
indicated in Table 2.4 of the same report. Relying on a sample size of 2.8
million connected customers, the speed tier data indicates the prevalent trend
is for users to move from the lowest tier (12/1) to the next highest tier
(25/5). The proportion of users selecting a speed tier of 50 mbps or more has
remained largely unchanged during the past two years.
Sky Muster satellite services
1.34
Describing the Sky Muster service as a 'technology of last resort' (committee
majority report paragraph 4.87) significantly undervalues the step-change that
has occurred in the experience of internet users living in regional and remote
areas.
1.35
The Australian Government has invested $2 billion in two advanced
Ka-band satellites and a network of ground stations that make up the Sky Muster
service.
1.36
Until the Sky Muster service became available many homes and businesses
in regional and rural Australia were still dependent on very basic internet
access which made even online banking or emailing difficult. Sky Muster has
change all that for many thousands of Australians.
1.37
As the committee majority report acknowledges, satellite has always been
intended to be part of the rollout. Indeed, since the beginning of the rollout,
satellite has been used to provide broadband to Australians living in regional
and remote areas. nbn first began providing satellite services through the
Interim Satellite Service (ISS). Spending approximately $351 million, the then
Labor Government had promised 250,000 Australians would be eligible but
capacity was only available for 48,000. The service was abysmal, with speeds
often no faster than dial up. Part of this stemmed from poor design – the lack
of an enforced fair use policy meant that some heavy use consumers were able to
consume more than their fair share of data, whilst thousands of normal users
could not get an adequate service.
1.38
Under the current Government, the nbn has a record of being able to
deliver satellite to some of the most remote parts of the world, and deliver
upgrades along the way.
1.39
The Fixed Wireless and Satellite review undertaken by nbn under the
Coalition Government was able to diagnose some of the systemic issues that
plagued the ISS at the time. In 2014, nbn upgraded the capacity of the ISS by
one third, at a cost of $18.4 million. Secondly, a fair use policy was
introduced to ensure that a minority of very heavy users could not crowd out
the majority.
1.40
Following the work undertaken in the Fixed Wireless and Satellite Review,
both satellites were launched successfully into orbit by nbn, and have begun
providing services. Whilst there have been some initial problems in
installation and stability, nbn has now resolved these issues, and the
reliability of Sky Muster has been consistent with other technologies on the
network for some months. At the same time, the rollout of Sky Muster services
has been proceeding at a rapid pace, with over 79,000 active customers now
using the service.
1.41
Last year, telecommunications research firm Ovum found that when
measured in terms of data allowance, download speed, upload speed and
affordability selected plans on the nbn Sky Muster service are world leading
for satellite broadband services.[6]
1.42
Ovum examined eighteen retail service providers internationally that
offer satellite broadband services and found that selected plans based on nbn's
Sky Muster service delivered outstanding results across all service
requirements, establishing itself as a world leader that will deliver a great
service for regional and remote Australians.
1.43
Notwithstanding the substantial achievement in launching two of the most
sophisticated telecommunications satellites to provide services to some of the
most remote places in the world, nbn has also delivered a series of upgrades to
the service, over and above what they were originally designed to do under the
former Government. In particular, nbn has been able to fully utilise the second
satellite to provide services, rather than leaving it for redundancy. Secondly,
through more sophisticated demand modelling, nbn has been able to adjust
upwards the fair use policy to enable nbn to provide an extra 50 per cent of
data during peak times, and double the data available at off peak time, whilst
still ensuring that all users are able to get an adequate service. It is clear
that less data would have been available under the former Government as it had
only planned to make use of one satellite. Due to its revised forecasts of Sky
Muster capacity and through optimising the conversion of available satellite
spectrum (megahertz) to usable bandwidth (megabits), nbn has been able to
increase data caps from 150GB to 300GB, or from an average of 30GB of peak data
per customer to an average of 45GB of peak data per customer.
Global comparisons
1.44
The committee majority report focuses on limited and at times,
misleading comparisons between rollouts in other countries. In particular, to
compare the rollout of broadband in New Zealand with the rollout in Australia
fundamentally misunderstands the basic geographies of the two different
countries, and the economics of each rollout.
1.45
Figure 4 seeks to demonstrate the difference in land mass size between
Australia and New Zealand. Put simply, Australia is more than 27 times larger
than New Zealand.
Figure 4

1.46
Furthermore, there are important facts about the New Zealand rollout
that the committee majority has not acknowledged. In particular, there is no
commitment in New Zealand for 100 per cent coverage – premises can be chosen on
the basis of how easy or profitable it is to rollout services to them.
1.47
Fixed line high speed broadband is expected to be provided to 85 per
cent of premises. Even the former Labor Government's deeply flawed NBN Implementation
Study acknowledged that there was substantial additional cost beyond the 85 per
cent mark:
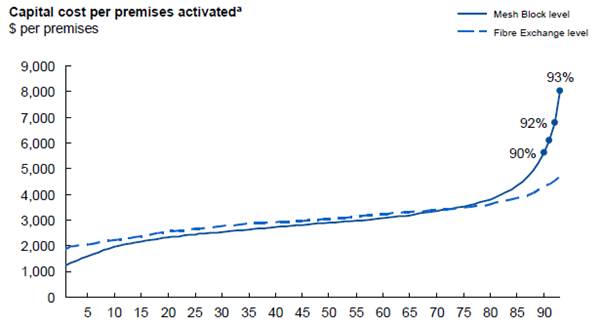
Source: National Broadband
Network Implementation Study, May 2010, p. 14.
1.48
With the continuation of the rollout, these forecasts have proved overly
optimistic, as nbn has gained experience in a real-world environment, and not
the theoretical model of consultants.
1.49
New Zealand has not needed to make use of satellite technology in its
rollout and is able to rely on terrestrial wireless and mobile technologies for
providing services beyond the fixed line footprint.
1.50
For Australia, satellite has been necessary as this is the most cost
effective technology to serve remote premises to ensure that all premises can
access minimum broadband speeds of 25 Mbps.
1.51
nbn is expected to spend around $4.5 billion in capital on the fixed
wireless and satellite networks to provide affordable broadband to regional,
rural and remote Australia. Of course, the Government has done this because it
believes that there must be equivalent broadband services in regional
Australia. This commitment is demonstrated by the Government’s regular reviews
of regional telecommunications via the Regional Telecommunications Independent
Review Committee (RTIRC).
1.52
The new broadband networks being rolled out in Australia and New Zealand
are vastly different and it does neither rollout justice to compare them using
simple metrics such as the cost per premises to build FTTP.
1.53
While the cost of building FTTP in New Zealand may be less than what nbn
has experienced, the NBN is achieving better outcomes than New Zealand in many
other areas, including:
-
The fixed line footprint in Australia will extend to around 92
per cent of premises, whereas the fibre rollout is only around 85 per cent in
New Zealand.
-
The minimum broadband speed being provided in Australia is 25
Mbps, whereas New Zealand is only guaranteeing 10 Mbps.
1.54
And while the committee majority report at paragraph 2.82 suggests the ACT Government
found Australia compared unfavourably to South Korea and Hong Kong which have
rolled out FTTP networks, there is no acknowledgement of evidence given at two
hearings that demonstrated that the beneficiaries of FTTP are unwilling to pay the
incremental costs of upgrade. Both the ACT Government and the South Australian
Government expressed a desire for FTTP to be rolled out in those States. When
asked whether they would be will to contribute to the cost, these jurisdictions
declined. This is a real world example of the willingness to pay for FTTP over
MTM – when asked whether they would contribute to the sometimes substantial
costs of using FTTP over MTM, both jurisdictions declined even though the
supposed benefits would largely accrue in their jurisdictions.
1.55
The reality is that access to high speed broadband (regardless of the
technology) is just one factor to determine whether the economic and social
benefits flow from access to high speed broadband. For example, Tasmania has
the highest proportion of FTTP of any state, and has had access to the network
the earliest. Nonetheless, Tasmania ranks the lowest on Telstra's Digital
Inclusion index compared to other States.
Serviceability of premises
1.56
At paragraph 3.24, the majority committee argues that premises classed
as service class zero (SC0) have resulted in delays of months or more. However,
the committee majority report fails to acknowledge the fact that under the FTTP
rollout SC0 was a substantially bigger problem. The public reporting that nbn
was required to undertake following the 2013 election clearly shows that the
percentage of SC0 premises has fallen significantly since nbn switched to a more
efficient MTM rollout model:
-
14 September 2017: Total percentage of brownfields premises at
SC0: 5.9 per cent.
-
9 September 2013 (at time of 2013 election): Total percentage of
brownfields premises at SC0: 31 per cent.
1.57
The committee majority report at paragraph 1.50 refers to research
undertaken by the Australian Communications and Media Authority (ACMA) in 2016
and implies the research found that very early and high migration rates were a
feature of the FTTP footprint. In fact, the ACMA research found that, of 900
premises in FTTP ready for service areas, 400 (or 44 per cent) had not switched
over to the NBN at all at the time the survey was undertaken.
Consumer experience
1.58
Several recent announcements indicate the Coalition Government is
working closely with nbn and retailers to ensure the processes for switching to
the NBN are being refined and enhanced to meet consumers' needs. Over the past
year the Government announced it is:
-
helping Australians get what they pay for under their internet
plan by introducing Australian Competition and Consumer Commission (ACCC)
monitoring of broadband performance at the retailer level;
-
having the ACMA gather objective data on the consumer experience
to help target industry improvements;
-
increasing understanding of consumer experiences before, during
and after migration to the NBN through research being commissioned and
undertaken by the ACMA; and
-
setting out the roles and responsibilities of all parties in
delivering a smooth transition to an NBN-based service through a revised
telecommunications industry guide.
1.59
In addition, the ACCC has released detailed guidance for retailers on
how to advertise broadband speeds to customers, including clearly identifying
typical minimum speeds during peak periods.
1.60
The committee majority report finds that these measures are untimely or
inadequate, despite most of them being at just the earliest stage of
implementation. For example, paragraph 5.62 declares the committee's view that
industry guidance from the ACCC will be insufficient and heavy regulatory
intervention is required.
1.61
The ACCC is to be applauded for taking the measured and prudent approach
of developing comprehensive industry guidance on the information to be provided
to consumers about broadband services supplied over the NBN. While great
progress has been made in the rollout of the NBN over the past several years,
it remains a fact that the majority of residential broadband connections still
operate over pre-NBN infrastructure.
The telecommunications sector is undergoing a period of
adjustment as the nbn progressively replaces legacy broadband infrastructure.
Broadband consumers do need more detailed information concerning the new
choices available to them in the post-nbn world. The ACCC's guidance is well
researched and informed by typical usage and user needs. Given the guidance has
only been provided to retailers in recent weeks—and there remain more than five
million Australian premises to be migrated to the nbn—it would appear premature
to be declaring that the guidance will be inadequate.
Hon Sussan Ley MP
Chair
Mr Luke Howarth MP Senator
Jane Hume
Senator Dean Smith Mrs
Lucy Wicks MP
Navigation: Previous Page | Contents | Next Page