Adrian Makeham-Kirchner and Philip Hamilton
Key Figures
Other purposes expenditures account for a significant
proportion of total Government expenditure, totalling $98 billion in
2019-20. This primarily consists of General revenue assistance to the States
and Territories, interest on Commonwealth debt and nominal superannuation
interest.
Table 1: total other purposes expenditure (millions)
Other
purposes
($
million) |
2018–19
(est.) |
2019–20
(est.) |
2020–21
(est.) |
2021–22
(proj.) |
2022–23
(proj.) |
| Interest on Commonwealth Government's
behalf |
17 154 |
17 037 |
16 625 |
16 063 |
15 747 |
| Nominal superannuation interest |
9 447 |
11 127 |
11 466 |
11 797 |
12 122 |
| General revenue assistance -
States and Territories |
67 134 |
69 053 |
71 256 |
75 067 |
78 608 |
| Local government assistance |
2 564 |
1 275 |
2 656 |
2 764 |
2 883 |
| Natural disaster relief |
775 |
11 |
2 |
- |
- |
| Contingency reserve |
-1 993 |
-216 |
2 117 |
4 293 |
8 982 |
| Total |
95
081 |
98
287 |
104
122 |
109
984 |
118
342 |
Source: Australian Government, Budget strategy
and outlook: budget paper no. 1: 2019–20, 2019, p. 5–51.
Note: Figures may not add due to rounding.
Interest—Commonwealth and
Superannuation
Compared to 2018-19, interest payments on Commonwealth debt
is reported to decline in nominal and real terms over the forward estimates.
The annual amount in 2022-23 is lower than 2018-19 by 16.4 per cent in real
terms. Consistent with the Treasurer’s announcement of eliminating Commonwealth
net debt by 2030, net debt is forecast to decrease from $373.5 billion in
2018-19 to $326.1 billion by 2022-23. Despite this, the face value of Australian
Government Securities—gross debt—is projected to increase from $560 billion to
$569 billion from 2019-20 to 2022-23.[1] The interest expense
relates to interest payments on the Australian Government Securities on issue,
suggesting that lending terms and product mix is contributing to the lowering
of the gross interest charge.[2]
Related to gross debt, the Australian Government holds an
unfunded superannuation liability expected to be $224 billion by 30 June 2019.
This relates to defined benefits pensions accrued under historical
superannuation schemes.[3] Future Fund assets will
offset part of this unfunded liability. However, nominal superannuation
interest reflects the imputed value of interest on the unfunded liability. The
expense is increasing over time, by 16.9 per cent in real terms between 2018-19
and 2022-23, reflecting the increasing trajectory of the unfunded superannuation
liability.
General Revenue Assistance to the
States and Territories and local governments
Untied payments to and through the states and territories is
one of the largest components of expenditure in the Budget, accounting for 14.1 per
cent of total Government expenditure in 2019-20, growing in real terms by 6.5
per cent between 2018-19 and 2022-23. There are three main components—the
transfer of Goods and Services Tax (GST) to the states, other ‘general revenue
assistance’ and payments to local government.
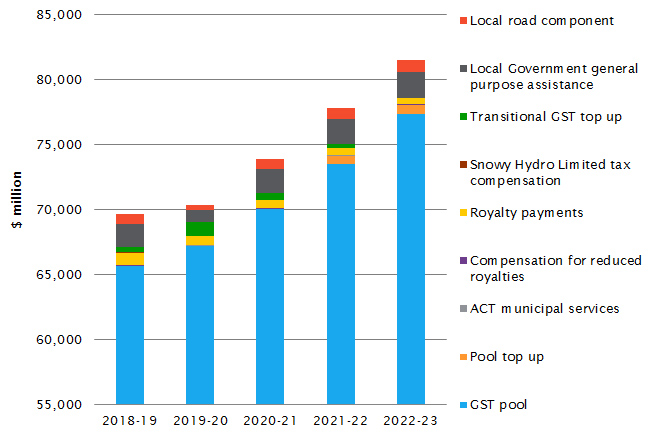
The transfer of GST, which is collected by the Commonwealth
but paid to the states and territories, accounts for $67.2 billion. This is
often referred to as the GST pool. By 2022-23, reforms introduced under the Treasury Law
Amendment (Making Sure Every State and Territory Gets Their Fair Share of GST)
Act 2018 will add $9.9 billion including $8.5 billion in ‘transitional
GST top-up’ payments to Western Australia (WA) and the Northern Territory (NT),
and $1.4 billion in GST pool top up.
The remaining general revenue assistance consists of
compensation payments—to the Australian Capital Territory for revenue it cannot
raise due to the presence of the Commonwealth, to WA for reduced royalties due
to Commonwealth policy, to WA and the NT for compensation on specific royalty
sharing arrangements and to New South Wales and Victoria for income taxes paid by
Snowy Hydro. These payments are declining from $787 million to $857 million
between 2019-20 and 2022-23.
Direct assistance to local Governments accounts for a
relatively small proportion of Commonwealth Government expenditure. It
comprises an untied general purpose assistance component—accounting for 69 per
cent of the annual value—and a tied local road funding component. The large
fall in total local government assistance—approximately 50 per cent from
2018-19 to 2019-20—reflects a consistent practice reported in budget papers
since 2016-17 that funding is bought forward from 2019-20 into 2018-19. This
assistance measures only payments made directly to local Governments, and does
not represent the full amount of money paid by the Commonwealth into local
communities.
The relative contribution to the total transfers between
layers of government are summarised in
Figure 1.[4]
Figure 1: components of general revenue assistance
Natural Disaster Relief
Assistance for natural disasters
is relatively small, and declining. The funding is, by its nature, contingent
on unpredictable events. The forward estimates reflect this unpredictability as
the balance trends to zero. The expenses are incurred, in part, under the
Disaster Recovery Funding Arrangements National Partnership payments.[5]
The payments may change over the longer term, as the Budget announced the
establishment of the Emergency Response Fund (ERF) which will provide a
sustainable source of additional funding for recovery from natural disasters,
which will be capped at $150 million.[6]
Contingency Reserve
The Contingency Reserve is a
mechanism used to deal with uncertainty, and contains transactions which are
not appropriated and that cannot be allocated to agency or functional areas.
Common examples include provisions for underspend, a conservative bias
allowance, commercial or security in-confidence and decisions taken but not
announced.
In 2019-20 the Reserve value is
negative, which means expenses have been reduced and it contributes to an
improved net operating balance. In the 2018-19 Budget, the Reserve value for
2019-20 was estimated at $3.3 billion, suggesting a $3.5 billion
turnaround over the financial year.[7] Over the years 2019-20 to
2022-23 the Reserve is valued at $15.2 billion [$14 billion in real terms].[8]
The conservative bias allowance totals $16.3 billion, meaning other components
are reducing the Reserve by $1.1 billion. For decisions taken but not
announced, the Budget outlines $124.1 million in revenue decisions, $3.2
billion in expenditure decisions and $16.3 million in capital decisions.[9]
Public service resourcing
The size of the public service determines the total
expenditure on wages, salaries and related employee expenses across multiple
functions of Government expenditure. In 2019-20 these expenses accounts for 16.2
per cent of general government sector (GGS) operating expenses and 5.4 per cent
of total expenses.[10]
The projected GGS average staffing level (ASL), excluding
military and reserves, for 2019–20 is 166,762, 1,271 more than in 2018-19, but
15,743 less than the peak of 182,505 in 2011–12.[11]
The 2019-20 level is 834 ASL lower than recorded for 2006-07, which was
introduced as a reference year in the 2014-15 Budget as a ‘... more efficient
and effective level ...’.[12] Military and reserve
personnel total 80,540 ASL, or 32.6 per cent of the total GGS workforce, the
highest proportion since 2006-07. The profile of ASL between 2006-07 and
2019-20 is illustrated in Figure 2.
Figure 2: ASL over time
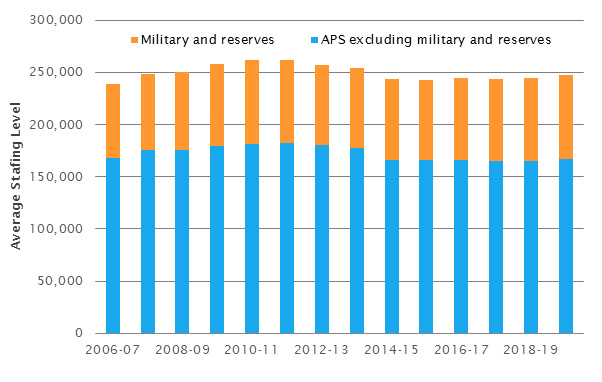
Source: Australian Government, Agency Resourcing: budget paper no.4: 2019-20, p. 17.
Efficiency Dividend
Since 1987–88 the Australian Government has applied an
efficiency dividend (ED) to ‘departmental’ expenses of Australian government
agencies. Conceptually, the ED builds in reduced funding to account for
increased public sector productivity over time. The ED affects the base
departmental funding of agencies, reducing the amount available by the ED rate
prior to the addition of any new measures. Agencies apply the notional saving
internally, as part of the normal operations of government, and the value of
notional savings is not identified even though it contributes to the funding of
new measures.
The ED has historically been applied at a rate of either 1
or 1.25 per cent. In some years governments have increased the rate, with the
highest ED rate being 4 per cent in 2012–13. The 2019–20 Budget does not
identify the rate at which the ED has been applied for the 2019–20 year.
However, the 2016–17 Budget stated that the ED would be maintained at 2.5 per
cent through 2016–17 and 2017–18, before being reduced to 2 per cent in 2018–19
and 1.5 per cent in 2019–20.[13]
[1] AGS at market value is
higher at $619 billion in 2019-20 and $621 billion in 2022-23. Australian
Government, Budget
strategy and outlook: budget paper no. 1: 2019-20, Statement 6, p. 6-8.
[2] The value of the ‘interest
expense on AGS’ measure in Statement 6 is higher in each year than the
functional expense ‘Interest on Commonwealth Government’s behalf’ in Statement
5. There is no further explanation of how an increasing AGS can result in a
lower interest payment.
[3] Australian Government, Budget
strategy and outlook: budget paper no. 1: 2019-20, Statement 6, p.
6-21.
[4] Australian Government, Federal
Financial Relations: budget paper no.3: 2019-20, p. 68, 74 and 77.
[5] Australian Government, Federal
Financial Relations: budget paper no.3: 2019-20, p. 65.
[6] Australian Government, Budget
strategy and outlook: budget paper no. 1: 2019-20, Statement 8, p. 8-31.
[7] Australian Government, Budget
strategy and outlook: budget paper no. 1: 2019-20, Statement 5, p.
5-42, compared to Australian Government, Budget strategy and
outlook: budget paper no. 1: 2018-19, Statement 6, p. 6-43.
[8] Australian Government, Budget
strategy and outlook: budget paper no. 1: 2019-20, Statement 5, p.
5-44.
[9] Australian Government, Budget
Measures: budget paper no. 2: 2019-20, p. 4, 45 and 182.
[10] Parliamentary Library
calculation based on Australian Government, Budget
strategy and outlook: budget paper no. 1: 2019-20, Statement 9, p. 9-5.
[11] Australian Government, Agency
Resourcing: budget paper no.4: 2019-20, p. 17.
[12] Australian Government, Agency
Resourcing: budget paper no.4: 2014-15, p. 120.
[13] Australian
Government, Agency resourcing: budget
paper no. 4: 2016–17, p. 2.
All online articles accessed April 2019
For copyright reasons some linked items are only available to members of Parliament.
© Commonwealth of Australia

Creative Commons
With the exception of the Commonwealth Coat of Arms, and to the extent that copyright subsists in a third party, this publication, its logo and front page design are licensed under a Creative Commons Attribution-NonCommercial-NoDerivs 3.0 Australia licence.
In essence, you are free to copy and communicate this work in its current form for all non-commercial purposes, as long as you attribute the work to the author and abide by the other licence terms. The work cannot be adapted or modified in any way. Content from this publication should be attributed in the following way: Author(s), Title of publication, Series Name and No, Publisher, Date.
To the extent that copyright subsists in third party quotes it remains with the original owner and permission may be required to reuse the material.
Inquiries regarding the licence and any use of the publication are welcome to webmanager@aph.gov.au.
This work has been prepared to support the work of the Australian Parliament using information available at the time of production. The views expressed do not reflect an official position of the Parliamentary Library, nor do they constitute professional legal opinion.
Any concerns or complaints should be directed to the Parliamentary Librarian. Parliamentary Library staff are available to discuss the contents of publications with Senators and Members and their staff. To access this service, clients may contact the author or the Library‘s Central Enquiry Point for referral.