 |
 |
> Appendix B
APPENDIX B: DPRS 2002 Staff Attitudes Survey
1.1 DPRS Staff Attitude Surveys
1.2 DPRS Staff Attitudes Survey 2002
2.1 Similar results to 2001
2.2 Variations across workgroups
2.3 Main achievements
2.4 Challenges for improvement
3.1 DPRS as a whole
3.2 Quality of services delivered by workgroups
3.3 Work environment and morale in workgroups
3.4 Departmental values
3.5 Employee support
3.6 Participation in decision making
3.7 Communication
3.8 Leadership in the workplace
3.9 Performance communication
3.10 Professional development
3.11 Staff selection and promotion
3.12 Follow-up to the October 2001 staff attitude survey
4.1 Mechanisms for staff input
4.2 Performance communication processes
4.3 Promotion and selection processes
4.4 Improving client services
1. Introduction
1.1 DPRS Staff Attitude Surveys
The DPRS Staff Attitudes Survey is an independent survey that aims to measure staff and managers perceptions about a range of internal issues that impact on the departments performance. It covers things such as communication, leadership, equity, professional development and participation in decision-making.
Following an initial survey in September 2000, follow-up surveys were conducted in November 2001 and October 2002.
The survey is sent to all staff and managers, including the Secretary and the other members of the Senior Management Team.
All aspects of the survey are managed outside of the department to ensure the confidentiality of the views expressed, and to allow an independent analysis of the results.
1.2 DPRS Staff Attitudes Survey 2002
The DPRS Staff Attitudes Survey 2002 was conducted in October 2002. The 2002
survey covered almost all questions from the 2000 and 2001 survey, although it
introduced two key enhancements.
These were:
- designing the survey questions so that there was a clearer distinction between
staff views about DPRS as a whole, and their views on the local workplace
- introducing more explicit survey questions about staff views in relation to the Departments values.
Overall, a response rate of 68% was achieved, which is comparable to the response rates in 2000 (71%) and 2001 (73%) (Table 1.1).
Table 1.1 Staff survey response rate
Source: Staff Attitudes Survey 2002 Q1.1
| WORKPLACE NAME | TOTAL RESPONSES | NUMBER OF STAFF | RESPONSE RATE |
|---|---|---|---|
| Client Liaison | 28 | 32 | 88% |
| Broadcasting | 24 | 36 | 67% |
| Hansard | 54 | 97 | 56% |
| Projects | 27 | 35 | 77% |
| Standards and Security | 6 | 10 | 60% |
| Infrastructure | 35 | 57 | 61% |
| Finance, Corporate Services | 12 | 14 | 86% |
| Personnel, Corporate Services | 8 | 17 | 47% |
| Other | 16 | 16 | 100% |
| Workplace not identified | 3 | - | - |
| TOTAL | 213 | 314 | 68% |
2 Key themes
2.1 Similar results to 2001
The 2002 survey results highlighted a continuation of relatively high levels of staff satisfaction across most aspects of the workplace climate.
In most parts of the survey, at least three-quarters of staff were positive in their overall assessment of their workplace (Figure 2.1) with modest improvements in a number of these areas when compared to 2001.
The level of satisfaction among staff was lower in relation to performance communication, staff selection / promotion and follow-up to the 2001 survey (see Sections 2.4 below).
Figure 2.1: Staff perceptions of workplace climate
Source: Q2.6, 3.8, 4.13, 5.7, 6.7, 7.12, 8.7, 9.8, 10.6, 11.4, 12.8
Proportion of staff who provided a positive response to the overall assessment
question in module
| cf 2001 | ||||
| 100% | ||||
| 95% agree that their workgroup delivers high quality services to clients | +4% | |||
| 94% agree that DPRS staff and work practices strongly support the departmental values | +5% | |||
| 90% | 90% agree that DPRS effectively promotes a workplace free from harassment / discrimination | -2% | ||
| 87% agree that communication in workgroups is effective | +14%* | |||
| 87% agree that decision making processes and team activities are effective | +7% | |||
| 82% agree that the leadership demonstrated in workgroup is effective | -1% | |||
| 82% agree that the DPRS work environment and morale positive and productive | +3% | |||
| 80% | ||||
| 78% agree that professional development practices in DPRS are appropriate and effective | ||||
| 70% | ||||
| 67% agree that performance communication processes in DPRS are helpful | -1% | |||
| 65% agree that there was appropriate follow-up to the results of the previous survey | +1% | |||
| 60% | ||||
| 59% agree that staff selection and promotion practices in DPRS are appropriate and effective |
* Caution is needed in interpreting this result because of changes in the wording of questions between 2001 (communication within DPRS is effective) and 2002 (Communication in workgroups is effective).
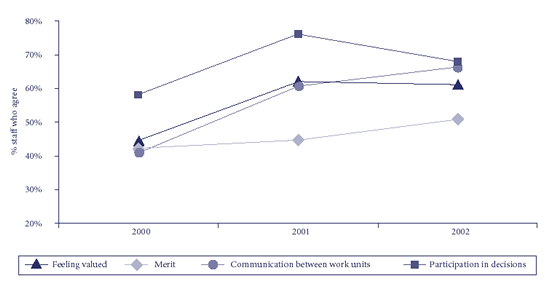
Broadly, the 2002 survey results showed a plateau-effect after the significant improvement in staff attitudes between 2000 and 2001 (Figure 2.2). In areas such as communication between work units and staff perceptions of feeling valued by the organisation, there were improvements of around 20% between 2000 and 2001. These gains appear to have stabilised with only small changes between 2001 and 2002.
In a small number of areas, such as opportunities to participate in decision-making the 2002 results showed a deterioration after positive results in 2001. In other areas, such as merit-based selection slight improvements have occurred between 2000 and 2002 although the overall result remains unsatisfactory. These results are discussed in detail below.
Figure 2.2: Changing staff perceptions over time
2.2 Variations across workgroups
In some ways, the aggregate survey results across DPRS often masked wide variations across the different workgroups - in particular the lower levels of satisfaction among staff in Broadcasting and Hansard compared to staff in Client Liaison, Projects and Corporate Services.
For example on two key measures of workplace climate - staff perceptions of whether the organisation values them and whether staff would recommend DPRS to potential employees as a good place to work - the results varied widely across workgroups (Figure 2.3 and 2.4). Specifically:
- across DPRS, 61% agreed that DPRS as an organisation values the people who
work here. However, more than 80% of staff in Client Liaison, Projects and Corporate
Services agreed and less than 40% of staff in Broadcasting and Hansard agreed.
- across DPRS, 72% agreed that they would recommend DPRS to potential employees as a good place to work. However, more than 90% of staff in Client Liaison, Projects and Corporate Services agreed and less than 65% of staff in Broadcasting and Hansard agreed.
These workgroup specific differences are explored in more detail below.
Figure 2.3: Perceptions of whether the organisation values staff
Figure 2.4: Staff who would recommend DPRS to potential employees as a good place to work
2.3 Main achievements
The main DPRS achievements identified from the 2002 survey results were:
- high levels of job satisfaction
As was the case in the 2000 and 2001, DPRS staff derive high levels of job satisfaction from the stimulating and challenging work; friendly and productive relationships with colleagues in their work unit and the facilities provided for staff within Parliament House. Among survey respondents:
- 100% agree that they enjoy working with clients (same result as 2001)
- 98% agree that they enjoy working with colleagues in DPRS (down 2% on 2001)
- 98% agree that their work makes an important contribution to the Parliament (up 3% on 2001)
- 90% agree that their work is stimulating and challenging (up 3% on 2001)
- 89% agree that their workplace is supported by appropriate staff amenities
and facilities
- staff commitment to service quality
As was the case in the 2000 and 2001, staff had very positive attitudes about the level of service quality provided by DPRS. Among survey respondents:
- 97% agree that they are proud of the quality of services and products they currently deliver to clients (up 3% on 2001)
- 91% agree that they currently deliver a world-class standard of service to clients (up 4% on 2001)
- 81% agree that their workgroup is well placed to provide world-class service
to clients over next 5 years (up 1% on 2001)
- DPRS staff and work practices strongly support the departmental values
Overall, 94% of respondents agreed that DPRS staff and work practices strongly support the departmental values. Across each of the four departmental values, the vast majority of staff agreed that the key attributes of the values were currently being met. In particular:
Professionalism
- 95% agreed that staff in their workgroup maintain high standards of ethical behaviour and conduct (up 7% on 2001)
- 92% agreed that their workgroup deserved a reputation for successfully completing tasks
Partnership with clients
- 98% agreed that staff in their workgroup are aware of and understand the needs of clients
- 97% agreed that their workgroup is highly responsive to feedback from clients
- 91% agreed that their workgroup had established strong relationships with clients
Continuous improvement
- 93% agreed that their workgroup constantly looked for better ways of providing services (up 5% on 2001)
- 91% agreed that staff in their workgroup were proactive in improving their work effectiveness
- 86% agreed that staff were aware of the costs and the importance of value-for-money
Personal respect
- 93% agreed that staff support and respect each other (up 9% on 2001)
- 93% agree that staff openly and actively share information and ideas with colleagues (up 19% on 2001)
- 85% agreed that when things go wrong in their workgroup, the focus is on learning from the experience (up 21% on 2001)
- recognition of the benefits of the DPRS organisation structure
There was increasing recognition among staff of the benefits of the DPRS organisation structure:
- 68% agree that the DPRS organisation structure helps to promote a shared focus on core services (up 4% on 2001)
- 65% agree that the DPRS structure helps to achieve seamless service delivery to clients (up 3% on 2001)
2.4 Challenges for improvement
The survey asked staff to nominate the most important workplace issues that management and staff need to focus on in the next 12 months. These included both DPRS-wide issues (Section 2.4.1) and workgroup-specific issues (Section 2.4.2). Recommendations linked to these challenges are presented in Section 4.
2.4.1 DPRS-wide issues
An analysis of the open-ended comments by staff highlighted five broad challenges for improvement. These related to:
- improved transparency, consistency and utility of the performance communication
process. While two-thirds of DPRS staff (67%) agreed that that performance
communication processes in DPRS are helpful, a number of staff highlighted the
need for improvements, particularly among lower classification employees and staff
in Broadcasting, Hansard, Infrastructure (see Section 3.8).
Staff concerns primarily relate to dissatisfaction with the manner in which the performance communication assessments are linked to salary advancement - both in terms of the current rules and the difficulty of maintaining transparency. For staff with these concerns, the intended focus on performance communication on professional and career development was generally missing. Among staff who were satisfied with the performance communication process, 89% agreed that individual development plans were useful for helping achieve professional and career aspirations. In contrast, for staff who were dissatisfied with the performance communication process, only 28% agreed that individual development plans were useful.
In addition, a number of managers and supervisors raised concerns about the time demands associated with undertaking assessment without clear evidence of improvements in staff motivation or performance
- transparency of staff selection and promotion processes. Of those who
had sought promotion in the last 12 months, only 57% agreed that the process was
fair. As with previous staff surveys, only around half (51%) of all staff agree
that advancement in DPRS is based solely on merit. Similarly less than two-thirds
of staff (62%) agree that staff are treated fairly in relation to acting in higher
duties or filling short-term vacancies (see Section 3.10).
Staff with these concerns related them primarily to perceptions of a culture of cronyism where people were treated differently in the promotion process based on personality and friendships. These staff have the perception that the formal selection process is used in some cases to justify a pre-decided outcomes. However, it is important to note that these staff are generally more negative across a range of broad issues (Table 2.1).What is apparent from their open-ended comments is the importance of a transparent selection and promotion process in determining how they feel about DPRS as a whole.
Table 2.1: Broader views of staff who are satisfied / dissatisfied with the selection process.
| ALL STAFF | STAFF WHO ARE SATISFIED WITH SELECTION& PROMOTION PROCESS | STAFF WHO ARE DISSATISFIED WITH SELECTION & PROMOTION PROCESS | |
|---|---|---|---|
| Senior Management Team try to be fair in dealing with competing needs across the Department | 48% | 69% | 13% |
| DPRS structure helps to promote a shared focus on core services | 68% | 83% | 43% |
| The organisation values the people who work here | 61% | 85% | 27% |
- closer cooperation and planning between workgroups (eg Client Liaison
and IOS;
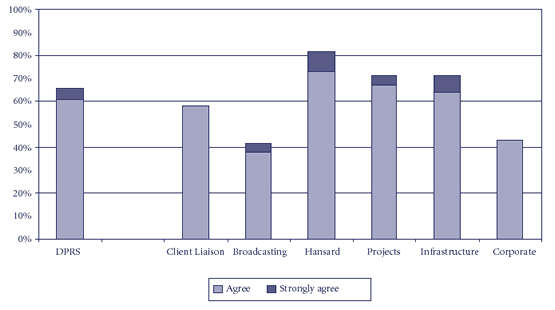
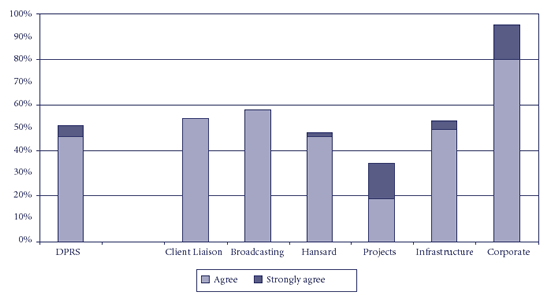
Infrastructure and Broadcasting; Projects with all other workgroups). Staff identified the greatest barrier to providing seamless services to clients was the lack of cooperation and planning between workgroups. These views were strongest among Broadcasting, Client Liaison and Corporate Services staff (Figure 2.5). Also very few staff (5%) strongly agreed with the view that the different workgroups in DPRS work together cooperatively.
Figure 2.5: Staff perceptions of cooperation between DPRS workgroups
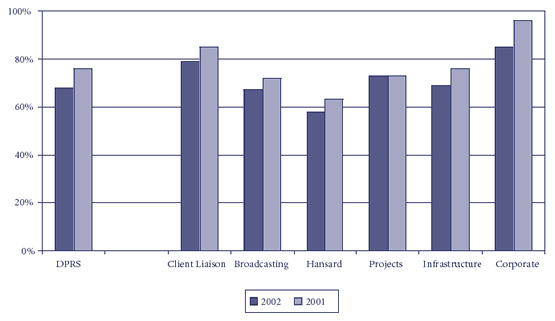
- opportunities to participate in decision making. Compared to 2001, there was a marked drop in the proportion of staff who agreed they have opportunities to contribute to decisions that affect them (down 8% from 2001 to 68%), with similar views expressed across most workgroups. A number of staff suggested the need to review the available mechanisms for staff to discuss concerns and ideas for improvements and the processes for feeding these through the DSCs.
Figure 2.6: Staff satisfaction with opportunities to contribute to decisions that affect them
NB: These results refer to opportunities to contribute to DPRS-wide decisions
- not decisions within individual workgroups
- promoting the role and contribution of the SMT. As with previous surveys,
staff had mixed views about the Senior Management Team.While 75% of staff agree
that the senior management teams set a clear direction of the Department (up 1%
on 2001), the majority of staff still have negative perceptions of the SMT. In
particular:
- 48% of staff agree that senior management try to be fair in dealing with competing needs across the Department
- 47% agree that SMT members lead by example and practise what they preach
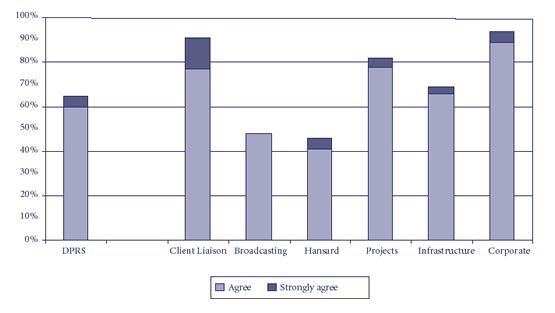
It is also clear that perceptions of the SMT rather across the different workgroups, with less than half of the staff in Broadcasting (48%) and Hansard (46%) agreeing that the SMT are open to staff feedback and suggestions compared to staff in Corporate Services (94%), Client Liaison (91%) and Projects (82%) (Figure 2.7).
Figure 2.7: Staff perception of openness of SMT to staff feedback / suggestions
2.4.2 Workgroup specific issues
As previously indicated, staff in Broadcasting, Hansard and Infrastructure had less positive attitudes than other DPRS workgroups. This is clearly indicated by the higher numbers of staff in these workgroups who consistently indicated they were dissatisfied across all survey modules (Figure 2.8).
Figure 2.8: Proportion of staff who consistently expressed dissatisfaction
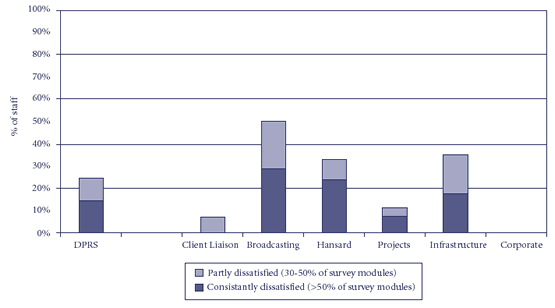
Importantly, staff in Broadcasting, Hansard and Infrastructure nominated very specific issues as priorities for improvement. These were
- ongoing concerns among Broadcasting staff about the perceived lack of fairness
of remuneration for work-related travel outside of normal working hours
- the need for improved ongoing consultation about the implementation of the
Hansard staffing plan and consideration of its impact on job satisfaction
- concerns about the operation of the performance communication process in Infrastructure, often in relation to the perception that assessments are being reviewed to limit the number of staff eligible for a salary increase.
Given the consistency with which these specific issues were raised, it is likely that they have influenced staff perceptions across the full range of issues covered in the survey. As a result, additional followup work will be needed to understand the priorities for improvement for staff in these workgroups (see Section 4).
3 Detailed survey results
3.1 DPRS as a whole
Module 1 in the survey asked staff about their perceptions of a range of organisation-wide issues (Table 3.1). The mixed results highlight both positive achievements (eg improved recognition of the benefits of the DPRS organisation structure - Section 2.3) and challenges for improvement (eg participation in decision-making, staff morale and perceptions of the SMT - Section 2.4.1).
Table 3.1: Staff perceptions of DPRS as a whole
Source: Q1.1 - Q1.16
Proportion of staff who >agreed= or >strongly agreed= with the statement in the survey
| 80% | cf 2001 | |||
| 77% Staff actively support managers to facilitate the introduction of change | ||||
| 75% The senior management Team set a clear direction of the Department | +1% | |||
| 75% The senior management Team set a clear direction of the Department | -13% | |||
| 70% | ||||
| 68% Staff in DPRS have opportunities to contribute to decisions that affect them | -8% | |||
| 68% The DPRS org structure helps to promote a shared focus on core services | +4% | |||
| 67% Working at DPRS provides good career opportunities (inside DPRS or outside) | ||||
| 66% The different workgroups in DPRS work together cooperatively | ||||
| 65% The DPRS structure helps to achieve seamless service delivery to clients | +3% | |||
| 65% I find members of the SMT open to feedback and suggestions for improvement | +1% | |||
| 61% This organisation values the people who work here | -1% | |||
| 60% | ||||
| 58% The Senior Management Team are united | +3% | |||
| 58% The implications of technical and system changes in the Dept are well managed | ||||
| 57% The SMT promote a culture of managing risks and learning from mistakes | -3% | |||
| 55% The implications of organisational/policy changes in the Dept are well managed | ||||
| 50% | ||||
| 48% Senior management try to be fair in dealing with competing needs | -12% | |||
| 47% SMT members lead by example and they practise what they preach | -1% | |||
| 40% |
3.2 Quality of services delivered by workgroups
Overall, 95% agreed that their workgroup delivers high quality services and products to clients.
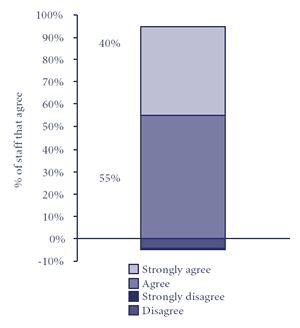
Across the department:
- Almost all staff in most workgroups and demographic sub-groups agreed that their workgroup delivers high quality services.
- Staff were slightly less positive in Hansard (90%)
The results from the 2002 survey showed small improvements across all attributes of service quality on the very positive views expressed in the 2001 survey.
Attributes of service quality
[with comparisons to the 2001 survey - blanks indicate no comparable data from 2001]
| 100% | 100% I enjoy working with our clients | +0% | ||
| 98% My work in DPRS makes an important contribution to the Parliament | +3% | |||
| 97% I am proud of the quality of services and products I currently deliver to clients | +3% | |||
| 95% Overall,my workgroup delivers high quality services and products to clients | +4% | |||
| 91% We currently deliver a world-class standard of service to clients | +4% | |||
| 90% | ||||
| 81% Workgroup is well-placed to provide world-class service to clients over next 5 yrs | +1% | |||
| 80% | ||||
| 70% |
Staff identified the greatest barrier to further improvements in the current high quality of services to clients were the:
- need for improvements in cooperation and planning between workgroups (see
Section 2.4.1)
- pressure of maintain service standards with increasing workloads (particularly
within Client Liaison and Hansard)
- need for extensive training and supervision of new front-line staff
- need for a whole-of-Department approach to implementing new projects or system, with greater attention to the Client Liaison function (eg training of Client Liaison staff as part of the development phase)
3.3 Work environment and morale in workgroups
Overall, 82% agreed that the environment and morale in their workgroups was positive and productive.
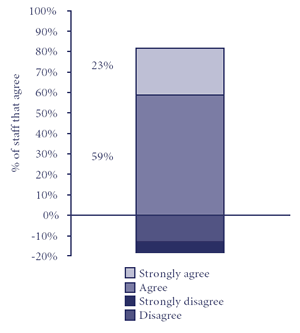
Across the department:
- Staff were more positive about the work environment in Projects (96%)
and Corporate Services (95%)
- Staff were less positive in Broadcasting (65%) and Hansard (69%)
Attributes of the work environment and staff morale
[with comparisons to the 2001 survey - blanks indicate no comparable data from
2001]
| 100% | ||||
| 98% I enjoy working with other staff in my workgroup | -2% | |||
| +3% | ||||
| 90% | 90% Staff in my workgroup share a common sense of purpose | 90% | ||
| 90% The work I do is stimulating and challenging | +4% | |||
| 89% My workplace is supported by appropriate staff amenities and facilities | ||||
| 84% Work practices and rules are constructive and they help me to do my job | ||||
| 83% Work practices are sufficiently flexible for family / personal commitments | -5% | |||
| 82% Overall environment and morale in workgroup | ||||
| 80% | ||||
| 78% I feel my work is valued and I am recognised for my contribution | ||||
| 70% |
Specific concerns raised by staff in the open-ended comments tended to relate to workgroup issues:
- travel allowances (Broadcasting and Hansard)
- impact of staffing plan on job satisfaction (Hansard)
- consistency of the approach to flexi-time and time in lieu
3.4 Departmental values
Overall, 94% agreed that DPRS staff and work practices strongly support the departmental values.
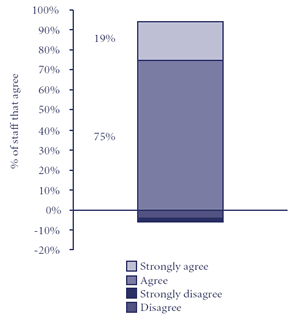
Across the department:
- Staff were more positive about the Departmental values in Client Liaison (100%) and Corporate Services (100%)
The results from the 2002 survey showed significant improvements compared to the 2001 survey - particularly in relation to the proportion of staff who agreed that when things go wrong, the focus is on learning from the experience and Staff openly and actively share information and ideas with colleagues. In part these improvements may reflect the fact that the 2002 survey asked staff to focus on their workgroup rather than DPRS as a whole.
Attributes of the adherence to the Departmental values
[with comparisons to the 2001 survey - blanks indicate no comparable data from
2001]
| 100% | ||||
| 98% Staff in my workgroup are aware of and understand the needs of our clients | ||||
| 97% My workgroup is highly responsive to feedback from our clients | ||||
| 95% Staff in my workgroup maintain high standards of ethical behaviour and conduct | +7% | |||
| 94% Overall, DPRS staff and work practices strongly support the Dept values | +5% | |||
| 93% Staff openly and actively share information and ideas with colleagues | +19% | |||
| 93% Staff support and respect each other | +9% | |||
| 93% As a workgroup, we constantly look for better ways of providing our services | +5% | |||
| 92% Workgroup deserves a reputation for successfully completing tasks | ||||
| 91% Our workgroup has established strong two-way relationships with our clients | ||||
| 90% | ||||
| 91% My workgroup is good at adapting to the challenges in DPRS & the public sector | ||||
| 86% Staff are aware of the costs and the importance of value-for-money | ||||
| 85% When things go wrong, the focus is on learning from the experience | +21% | |||
| 80% |
Specific concerns raised by staff in the open-ended comments tended to relate to workgroup issues:
- travel allowances (Broadcasting and Hansard)
- impact of staffing plan on job satisfaction (Hansard)
- consistency of the approach to flexi-time and time in lieu
3.5 Employee support
Overall, 90% agreed that DPRS is effective in promoting a workplace free from harassment and discrimination.
Across the department:
- Staff were more positive about employee support in Corporate Services
(100%), Projects (96%) and Client Liaison (96%)
- Staff were less positive in Broadcasting (78%) and Hansard (87%)
Across most of the key attributes of employee support, the 2002 results were slightly more negative than 2001. This is potentially a concern in relation to staff reporting personal experiences of harassment and discrimination. However, an analysis of the open-ended comments highlighted that in all but one case, staff indicated that their views were not the result of overt harassment or discrimination, but were based on broader perceptions of a lack of personal respect from some managers.
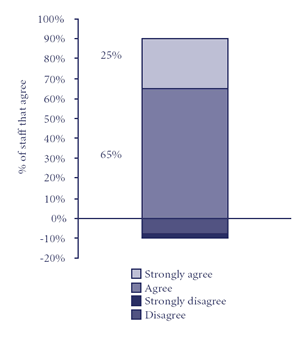
Attributes of the employee support
[with comparisons to the 2001 survey - blanks indicate no comparable data from
2001]
| 100% | ||||
| 96% Staff have appropriate access to professional support services (eg counselling) | ||||
| 96% I have not experienced harassment in the workplace over the last 12 months | -2% | |||
| 90% | 90% I have not experienced discrimination or unfair treatment in DPRS | -3% | ||
| 90% Overall, DPRS is effective in promoting a workplace free from harassment | -2% | |||
| 88% Staff in my workgroup do not say or do things that offend or humiliate me | -2% | |||
| 87% I feel confident that if I made a complaint, prompt action would be taken | -4% | |||
| 80% | ||||
| 70% | 70% If staff have a grievance or complaint, managers act promptly to resolve it | +6% | ||
Specific concerns raised by staff in the open-ended comments tended to relate to workgroup issues:
- travel allowances (Broadcasting and Hansard)
- impact of staffing plan on job satisfaction (Hansard)
- consistency of the approach to flexi-time and time in lieu
3.6 Participation in decision making
Overall, 87% agreed that decision making processes and team activities are effective.
- Staff were more positive about participation in decision-making in
Projects and Corporate Services (100%)
- Staff were less positive in Broadcasting (74%) and Hansard (75%) and among lower classification employees (84%)
Compared to 2001, staff were more positive about teamwork and less positive about being consulted about changes that will affect their work.
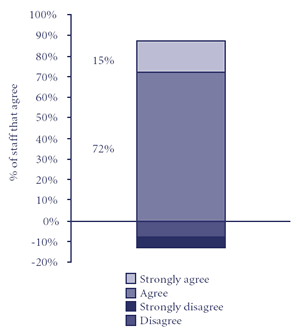
Attributes of participation in decision-making
[with comparisons to the 2001 survey - blanks indicate no comparable data from
2001]
| 93% Teamwork and cooperation is encouraged in my workgroup | +8% | |||
| 90% | ||||
| 87% Overall, decision making and team activities in my workgroup are effective | +7% | |||
| 85% Workgroup teams take advantage of my personal skills and expertise | ||||
| 84% I have opportunities to contribute to decisions that affect my role in workplace | ||||
| 81% I have opportunities for input into the planning processes in our workgroup | ||||
| 80% | ||||
| 74% People are encouraged to try new ideas, even if there is a risk they might not work | -2% | |||
| 70% | ||||
| 67% Staff are adequately consulted about proposed changes that will affect their work | -5% |
Specific concerns raised by staff in the open-ended comments tended to relate to better mechanisms for staff to discuss concerns and ideas for improvements and the processes for feeding these suggestions through the DSCs. Feedback included the need for:
- regular staff meetings (both with and without managers) with a formal system
of action items so that issues are followed up
- improved links between staff / team meetings and the DSC
- better promotion of the DSC so that staff know how to raise issues
3.7 Communication
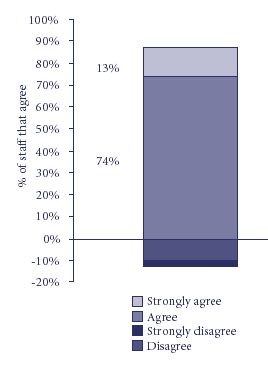
Overall, 87% agreed that communication within workgroups is effective.
Across the department:
- Staff were more positive about communication in Corporate Services
(100%)
- Staff were less positive in Broadcasting (78%) and Hansard (75%) and among new employees with less than two years service (74%)
Compared to 2001, staff acknowledged improvements in the systems for dissemination of information between different work groups, although there is still a reasonably high level of dissatisfaction with the ease-of-use of @ParlCom.
| 100% | ||||
| 95% I can readily communicate with my immediate manager on day-to-day work issues | +1% | |||
| 93% I receive or can access the info within my workgroup that I need to do my job | ||||
| 90% | ||||
| 87% My manager keeps staff informed of developments that affect our workgroup | -1% | |||
| 87% Overall, communication in my workgroup is effective | ||||
| 85% The consultative committee and subcommittees kept staff informed about issues | ||||
| 84% I receive or can access info from other parts of the Dept that I need to do my job | ||||
| 83% Staff are proactive in seeking information about issues that affect their work area | ||||
| 80% | ||||
| 74% @Parlcom provides relevant and up-to-date info about issues that affect work area | +3% | |||
| 72% Director/Exec keep staff informed about major decisions that affect their work area | -3% | |||
| 70% | ||||
| 68% I use @Parlcom at least once a week to keep up-to-date with issues | -4% | |||
| 66% DPRS has effective systems for dissemination of info between different work units | +5% | |||
| 60% | ||||
| 51% I find the DPRS intranet (@Parlcom) easy-to-use | -2% | |||
| 50% |
Specific concerns raised by staff in the open-ended comments tended to relate to the ease-of-use of @ParlCom. These concerns were found across all workgroups except Corporate Services.
Feedback included:
- difficulties with the ease of navigation (particularly the document repository)
- complaints about the slowness of @Parlcom.
At the same time, a number of staff commented on the usefulness of Hot Topics and enhancements after July 2002. Also, give that almost three-quarters (74%) of staff agree that @Parlcom provides relevant and up-to-date information about issues that affect work area, it appears concerns are primarily related to the web interface.
3.8 Leadership in the workplace
Overall, 82% agreed that leadership demonstrated in their workgroup is effective.
Across the department:
- Staff were more positive about leadership in their workgroup in Corporate
Services (100%) and Client Liaison (96%)
- Staff were less positive in Broadcasting (50%) and Hansard (71%) although these results may reflect broader issues of staff morale
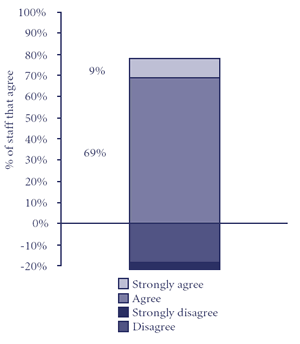
Attributes of leadership in the workplace
[with comparisons to the 2001 survey - blanks indicate no comparable data from 2001]
| 100% | ||||
| 95% I can approach my supervisor / manager with ideas and concerns | ||||
| 90% | ||||
| 87% The supervisor / manager is proactive in addressing ideas or concerns raised by staff | ||||
| 84% My supervisor / manager communicates staff ideas and concerns to our Director | ||||
| 84% I can approach the Director of our workgroup with ideas and concerns | ||||
| 82% Overall, leadership demonstrated by managers in my workgroup is effective | -1% | |||
| 80% | ||||
| 76% My Director successfully communicates staff ideas and concerns to Exec / SMT | ||||
| 74% My Director provides a clear sense of direction and priorities for our workgroup | ||||
| 70% |
3.9 Performance communication
Overall, 67% agreed that performance communication processes in DPRS are helpful
Across the department:
- Staff were more positive about performance
communication processes in Corporate Services
(85%), Projects (83%) and Client Liaison (81%).
- Staff were less positive in Broadcasting (43%), Hansard (60%) and Infrastructure (66%), as were Level 3 (56%) and Level 4 (68%) employees.
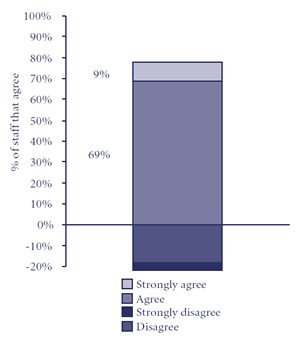
Attributes of performance communication
[with comparisons to the 2001 survey - blanks indicate no comparable data from 2001]
| 90% | ||||
| 88% The expected level of my work performance is achievable and realistic | -2% | |||
| 80% | ||||
| 77% Formal assessments of my work performance (every 6 months) are thorough | ||||
| 77% The expected level of my work performance is clearly defined and explained | +1% | |||
| 75% Formal assessments of my work performance are objective | -5% | |||
| 74% Regular feedback from my manager / supervisor about my work performance | +7% | |||
| 70% | ||||
| 68% I seek feedback about work performance to ensure no surprises at assessments | +0% | |||
| 67% Overall, performance communication processes in DPRS are helpful to me | -1% | |||
| 60% | ||||
| 57% Work performance milestones set for salary advancement are achievable &realistic | -4% |
Specific concerns raised by staff in the open-ended comments were:
- dissatisfaction with the manner in which the performance communication process
was linked to salary advancement including:
- the fact that staff are required to do more than fully meet requirements
to be eligible for a salary increase
- perceived difficulty of the hurdle to be eligible for a salary increase
- concerns that the assessment process was being implemented in a way that limited
the number of staff eligible for a salary increase
- the added complexity introduced to the system by using the Exceeds Requirements
and Outstanding categories.
- time demands on managers and supervisors to implement the system (without
clear evidence of improvements in staff motivation or performance)
- the need for greater consistency between different managers undertaking assessments. In fact around one-quarter of staff are not satisfied that formal assessments are thorough and objective.
More generally, a number of staff raised concerns about the impact of the performance communication process on staff morale. These staff wanted a greater emphasis on rewards for outstanding team or DPRS performance rather than individual performance.
Specific suggestions for improvements included:
- managers and supervisors gathering 360 degree feedback prior to conducting
assessments
- considering a system for appealing assessments
- simplifying the assessment process by using a three-point assessment scale
- exceeds, meets or does not meet.
- managers providing more informal feedback so that formal assessments contain no surprises.
3.10 Professional development
Overall, 78% agreed that professional development practices in DPRS are appropriate and effective.
Across the department:
- Staff were more positive about professional development in Corporate Services,
(100%), Client Liaison (100%) and among new employees with less than one years
service (89%).
- Staff were less positive in Broadcasting (45%), as were staff with 5-10 years service (69%)
Across most of the key attributes of professional development, the 2002 results were slightly more negative than 2001. These results appear to closely link with concerns about performance communication processes (see Section 3.9)
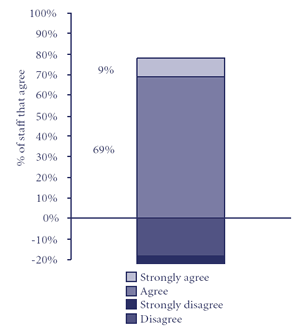
Attributes of professional development
[with comparisons to the 2001 survey - blanks indicate no comparable data from
2001]
| 90% | ||||
| 84% Staff actively contribute their ideas/opinions when IDPs are developed | -2% | |||
| 84% I get sufficient opportunities to dev knowledge and skills I need to do my job | -2% | |||
| 80% | ||||
| 78% Overall, professional dev practices in DPRS are appropriate and effective | ||||
| 76% I am given opportunities to develop the skills needed for promotion | -4% | |||
| 73% My Individual Dev Plan is useful for helping me improve in my current job | -3% | |||
| 70% | ||||
| 68% My Individual Dev Plan is useful for helping me achieve prof & career aspirations | -4% | |||
| 60% |
Specific concerns raised by staff in the open-ended comments tended to relate to the purpose and value of Individual Development Plans.While very few specific suggestion for improvement were made, comments often related to the perceived focus of the performance communication process on assessments related to salary advancement rather than the professional development aspects of the process.
3.11 Staff selection and promotion
Overall, 59% agreed that staff selection and promotion practices in DPRS are appropriate and effective.
Across the department:
- Staff were more positive about selection and promotion practices in
Corporate Services (88%), Client Liaison (83%), and among the SMT (82%).
- Staff were less positive in Broadcasting (45%) and Hansard (46%).
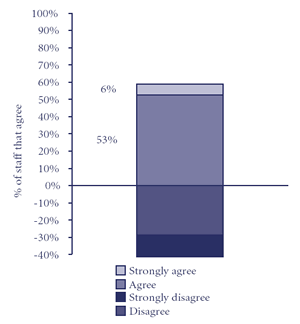
Attributes of staff selection and promotion
[with comparisons to the 2001 survey - blanks indicate no comparable data from
2001]
| 70% | ||||
| 62% Staff treated fairly in relation to acting in higher duties/filling short-term vacancies | -3% | |||
| 60% | ||||
| 59% Overall, the selection and promotion practices are appropriate and effective | ||||
| 57% When I have sought promotion in the last 12 mths, I found the process fair | ||||
| 51% Advancement in DPRS is based solely on merit (best person for the job) | +6% | |||
| 50% |
Specific concerns raised by staff in the open-ended comments were:
- perceptions of a culture of cronyism in some parts of DPRS with people treated differently
in the promotion process based on personality and friendships. These staff have the perception
that the formal selection process is used in many cases to justify a pre-decided outcomes.
- lack of consistency in the skills of members of selection panels, resulting in poor decisions
- the need of more standardised, formal processes for handling opportunities for acting in
higher duties or filling short-term vacancies
- that the recent processes of applying for promotion in Hansard were unnecessarily complex and stressful
Specific suggestions for improvements included:
- senior managers being more prominent in promoting the importance of merit-based
selection including encouraging staff with specific concerns to raise them with DPRS HR staff
- continuation of recent recruitment panel training courses to ensure all selection committee
members have appropriate skills and experience
- reviewing guidelines for acting in higher duties to encourage a wider range of opportunities
(eg rotation of several candidates in high duties position).
- improved feedback to successful and unsuccessful applicants
- greater emphasis on job-specific selection criteria rather than generic criteria based on the
DPRS values.
- reducing the emphasis on interview performance and greater use of CVs and referees reports.
- improved gender balance on selection panels
3.12 Follow-up to the October 2001 staff attitude survey
Overall, 65% agreed that there has been appropriate follow-up to the results of the October 2001 staff attitude survey.
Across the department:
- Staff were more positive about the follow-up to the 2001 survey in Client
Liaison (93%) and Corporate Services (92%)
- Staff were less positive in Hansard (45%), Projects (46%) and Broadcasting (54%) and
Across most of the key attributes of follow-up, the 2002 results were more negative than 2001, particularly in relation to staff perceptions related to opportunities to discuss and comment on the findings (down 14%) and the SMTs consideration of the findings (down 14%).
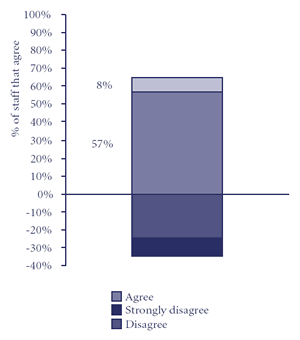
Attributes of follow-up to the 2001 survey
[with comparisons to the 2001 survey - blanks indicate no comparable data from
2001]
| 90% | ||||
| 83% The results of the previous survey were clearly communicated to staff | -9% | |||
| 80% | ||||
| 71% Staff have been interested and constructive in follow-up of actions from the survey | +5% | |||
| 70% | ||||
| 67% Information and actions from the survey have been clearly communicated to staff | ||||
| 66% Staff were given appropriate opportunities to discuss and comment on findings | -14% | |||
| 65% Overall, there was been appropriate follow-up to the results | +1% | |||
| 64% The SMT has clearly communicated their response to addressing these staff concerns | -1% | |||
| 64% Staff concerns raised in the survey were taken seriously by the SMT | -14% | |||
| 60% | ||||
| 60% The SMT and staff have made good progress in addressing concerns raised in survey | +2% |
4 Challenges for improvement
The aim of the Staff Attitudes Survey is to improve the level and quality of staff input to the DPRS planning and service development processes. On the basis of the 2002 survey results, considered in the context of the 2000 and 2001 findings, a number of challenges were identified - both to the process of facilitating staff input and in addressing specific staff concerns.
4.1 Mechanisms for staff input
Recommendation 1: Use a self-completion staff survey once every two-year (or once a Parliament) to collect quantitative data for internal benchmarking of staff attitudes.
Now that consistent baseline data on staff attitudes is available, it is not necessary to collect rating based data annually. Most organisations with less than 500 employees conduct such surveys biennially, and this is adequate for internal benchmarking purposes. However, for continuous improvement purposes it is timely to consider alternative methods for gathering regular staff feedback using existing consultations mechanism. This is particularly critical as:
- around one-third of staff (32%) do not believe they have adequate opportunities
to contribute to decisions that affect them (up 8% from 2001)
- staff wanted more opportunities to have their ideas and suggestions considered
by the DSCs
- the survey highlighted a number of workgroup specific issues that need follow-up within those workplaces.
Suggestions for alternative feedback mechanisms are proposed in Recommendation 3.
Recommendation 2: To ensure appropriate follow-up to the results of the 2002 survey, a continuous improvement action plan which responds to the findings will be prepared by 30 March 2003.
It is intended that the development of the action plan be coordinated by the SMT Continuous Improvement Committee, in consultation with the DSCs, and should be based on two sets of input:
- each DPRS workgroup will prepare a brief action plan of 'local' responses
to the issues raised by their staff. These plans should list specific actions
which could be implemented over 2003. To facilitate local action plans, customised
survey reports with template action plans have been prepared by ARTD for Client
Liaison, Broadcasting, Hansard, Projects, Infrastructure and Corporate Services.
- Strategic Development Group will prepare an action plan based on responses to DPRS-wide issues.
To ensure staff are fully informed of the responses to the 2002 survey, the Corporate Improvement Area, SDG should consult with the DSC about an appropriate communication strategy, which could include presentations of the action plan at all workgroup staff meetings.
Recommendation 3: Undertake the 2003 Staff Feedback Survey as an action-research process based on staff panels which feed concerns and suggestions for improvements into an action plan prepared by the DSCs.
It is intended that the 2003 Staff Survey be undertaken as a 'bottom-up' process based on a series of planned and resourced staff panels. Staff panels would consist of purposive samples of staff who meet 2-3 times over the 'survey' period to discuss key issues after consulting with their peers. Examples of panels could include:
- workgroup-specific panels (eg senior editors in Hansard; Broadcasting)
- cross-DPRS panels (eg lower classification employees; Client Liaison / ISO)
- specific-issue panels (eg performance communication processes; selection and promotion; role and operation of the DSC)
After their initial consultation and discussions, each panel would be required to prepare a list of issues and suggestions for improvements to a nominated DSC. The DSCs would then synthesis the responses into a draft action plan which would be distributed to all staff for comment prior to presentation to the SMT.
To ensure the success of this approach:
- all staff panels will need to be provided with support in the areas of scheduling
and group facilitation
- the SMT should communicate its ongoing commitment to acting on the results of staff feedback surveys - whether administered through self-completion surveys or staff panels
4.2 Performance communication processes
Recommendation 4: Review of performance communication processes as part of the negotiations for the new certified agreement.
It is timely to review to extent to which the performance communication processes are successfully meeting the dual goal of rewarding outstanding performance and promoting appropriate professional development, particularly in the light of:
- the fact that less than two-thirds are staff (60%) agree that both the performance
communication processes are helpful to them and the IDPs are useful for improving
in their current job
- time demands on managers and supervisors to implement the system.
4.3 Promotion and selection processes
Recommendation 5: Ongoing review of communication and training processes in relation to recruitment, promotions and acting in higher duties
It is clear that the intended communication messages, training and practices related to merit-based selection and fair opportunities for acting in higher duties are not currently translating into high levels of staff confidence with these processes. It was also found that concerns about transparent selection and promotion processes are closely correlated with how staff feel about DPRS as a whole. As part of the follow-up to the 2002 survey (Recommendation 2), feedback should be provided to staff on their specific suggestions for improvements (see Section 3.11) and other DPRS-wide responses.
4.4 Improving client services
Recommendation 6: Strategic Development Group work with key workgroups to develop annual 'seamless service' plans.
Staff identified the greatest barrier to further improvements in the current high quality of services to clients was the need to better cooperation and planning between workgroups. It is intended that the Strategic Development Group coordinate a process during 2003-04 for developing a
- Client Liaison / IOS 'seamless service' plan
- Infrastructure / Broadcasting 'seamless service' plan
A 'seamless service' plan should specify the strategies that will be used to improve internal communication and to streamline the delivery of services to clients. Plans should be signed-off by the Group Managers and updated annually.
Recommendation 7: Examine the feasibility of establishing a web-facility to allow clients to log problems which are then addressed within a standard timeframe.