 |
 |
Performance reporting model
: Diagram
OUTPUT GROUP 1: Broadcast and Transcription
Services
1.1 Broadcast Production
1.2 Transcription
OUTPUT GROUP 2:
Support and Technology Services
2.1 Infrastructure
> 2.2 Services
MANAGEMENT AND ACCOUNTABILITY
FINANCIAL INFORMATION
OUTPUT 2.2 SERVICES
The Services Output includes help desk activities, training, client consultation and problem resolution. The departments first line client support services, such as help desk, training and client liaison, are provided by the Client Services Group, while the second line client services, such as information technology problem resolution, desktop moves and account management, are provided by the Technical Services Group.
Services quantity
Performance indicator: number and percentage change in client service requests (help desk calls, training and client consultation).
Basis for comparison: Trends over time.
Help desk calls
Ext.2020 Calls Serviced
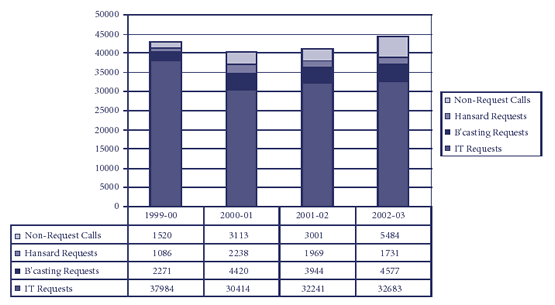
Calls to the Help Desk rose by 8 per cent in 2002-2003, with 44,475 calls compared with 41,115 calls in 2001-2002. 73 per cent were information technology service requests, 10 per cent broadcasting service requests and 4 per cent Hansard service requests, with the remaining 13 per cent being nonrequest calls, i.e. calls of an administrative nature, internal calls and wrong numbers.
Training and client consultation
200203 Training Days and One-To-One Sessions
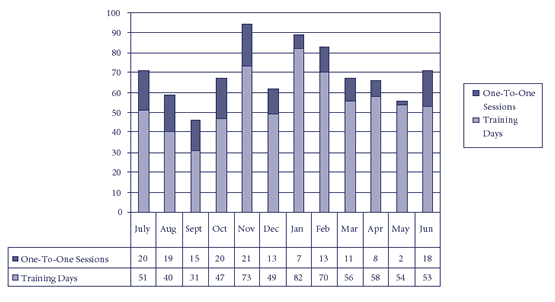
Group training courses increased 28 per cent in 2002-2003 with 662 days compared to 516 days in 2001-2002. There was a similar increase in the demand for one-to-one training sessions with 167 sessions compared to 150 sessions in 2001-2002.Much of this increased demand can be attributed to training associated with the OneOffice platform rollout, with the remainder being the result of returning to normal activity levels following the 2001 election.
Individual client consultancies increased from 6561 hours in 2001-2002 to 8670 hours in 2002-2003. Client preferences for direct consultation over formal training courses and the differing levels of skills and experience among clients and their staff contribute to these results. The time spent by support staff on each consultancy is also rising as both the range of services and their complexity increases.
Services price (cost)
The overall cost of the Services Output in 2002-2003 was $5.061 million, a decrease of 3 per cent compared to 2001-2002 ($5.2 million).
Performance indicator: Full and average costs for client services (help desk, training and client consultation activities).
Basis for comparison: Trends over time.
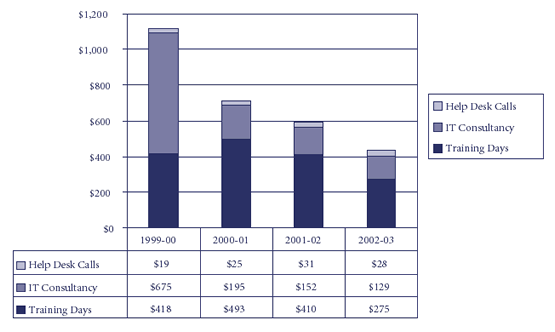
Overall, the full cost of help desk, training and client consultation activities increased slightly in 2002-2003 to $2.8 million from $2.7 million in 2001-2002. This minimal increase was achieved despite significant increases in the volume of activity, a wider range of services supported and the greater complexity of client requirements.
Average per unit costs for help desk calls, information technology consultancies and training days all recorded decreases in 2002-2003 due to the identification of greater efficiencies in servicing and the distribution of larger fixed costs across higher activity levels following the 2001-2002 election year.
Services quality
Services quality Client satisfaction
Performance indicator: Number and percentage of clients who are satisfied or very satisfied with services.
Basis for comparison: Trends over time.
Services Client Satisfaction Levels - Very Satisfied or Satisfied
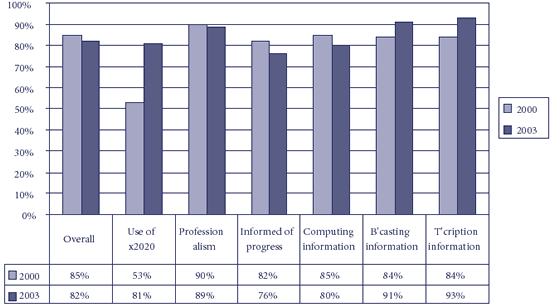
The DPRS 2003 Client Survey sought the views of Senators,Members and senior parliamentary staff regarding their levels of satisfaction with DPRS services. Of those surveyed, 82 per cent were either very satisfied or satisfied with client services overall which, while maintaining a high level, is a decrease of 3 per cent on the DPRS 2000 Client Survey results.
The two areas of concern were declines in client satisfaction levels with being kept informed of progress with service requests and the ease of accessing information regarding computing services. Both these issues will be addressed during 2003-2004.
The performance of training services was assessed by client evaluations of courses and course presenters. The results showed that over 90 per cent of clients gave both overall course and course presenter ratings of either very good or excellent.
Services quality Service timeliness
Performance indicator: Number and percentage of service requests resolved within service standard.
Basis for comparison: Trends over time.
Senators and Members and parliamentary committees consistently rate timeliness as the most critical factor in service delivery. The department responded to 44,475 calls to the help desk in 2002-2003, an 8 per cent increase over 2001-2002, with the following results for timeliness.
Client Service Timeliness - Service Requests Resolution
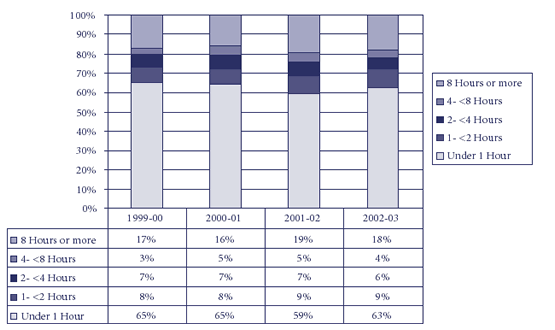
Despite the 8 per cent increase in calls between 2001-2002 and 2002-2003, service timeliness levels have improved with 4 per cent more calls resolved in under one hour than in the previous year. Calls requiring more than eight hours to resolve also fell marginally. These results are pleasing, given the increasing complexity in the nature of calls and the increasing range of services being supported.