 |
 |
Performance reporting model
: Diagram
OUTPUT GROUP 1: Broadcast and Transcription
Services
1.1 Broadcast Production
1.2 Transcription
> OUTPUT GROUP 2:
Support and Technology Services
2.1 Infrastructure
OUTPUT GROUP 2:
SUPPORT AND TECHNOLOGY SERVICES
Outputs from Output Group 2 are provided by the Technical Services Group and the Client Liaison subgroup of the Client Services Group.
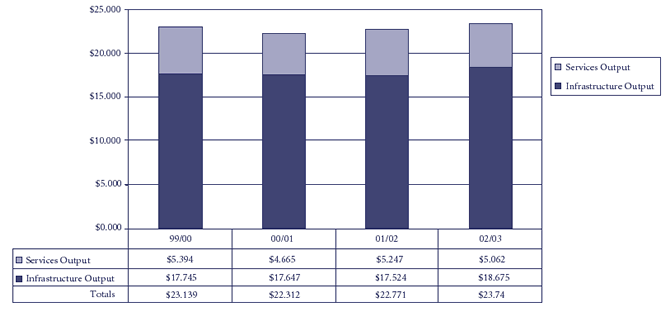
The overall cost for the provision and support of Infrastructure and Services ($23.7 million in 2002-2003) shows a gradual increase each year, reflecting the greater scope and complexity of the infrastructure and applications provided to Senators and Members and the parliamentary departments.
Cost of Support and Technology Services ($m)
Output 2.1 Infrastructure
The key Infrastructure output components are Information Technology, Telecommunications and Broadcasting Support.
Infrastructure quantity
a) Number of Registered Users: 2002-2003 saw a continuing increase in client use of most services. The monthly average of 4031 registered clients was a 14 per cent increase compared to 2002-2001 and a 22 per cent increase compared to 2000-2001.
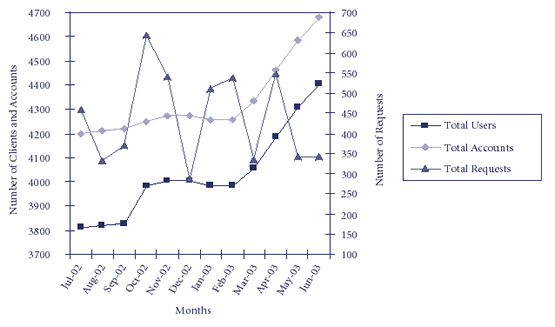
The 14 per cent increase in the number of registered information technology users reflects the greater number of electorate office staff using parliamentary services and an increase in support for parliamentary events where participants were provided with access to parliamentary facilities.
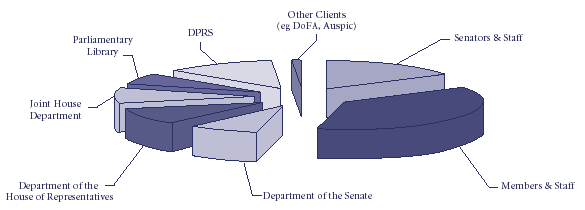
Services provided in 2002-2003 comprised:
- Senators and their staff (16 per cent)
- Members and their staff (37 per cent)
- Department of the Senate (8 per cent)
- Department of the House of Representatives (10 per cent)
- Joint House Department (9 per cent)
- Department of the Parliamentary Library (6 per cent)
- Department of the Parliamentary Reporting Staff (13 per cent)
- Other organisations such as the Department of Finance and Administration and Auspic (less than 1 per cent) which receive services on a subscription basis through memorandums of understanding.
b) Telecommunications, and c) Broadcasting services and support
There was no significant change during 2002-2003 in the telecommunications and broadcasting infrastructure of 4932 connections, including telephony and facsimile services. The broadcasting components consist of 4176 House Monitoring Service connections and 2416 EWIS speakers and 2313 installed clocks.
Infrastructure services request by clients
In 2002-2003 outgoing telephone calls were 19 per cent lower (4.7 million) than the previous year and use of facsimile services was 6 per cent lower (3.9 million pages sent). Internet mail use (12 million messages) was 41 per cent higher than the previous year.
Greater use of the Internet over the last five years has resulted in increased usage costs as traffic has grown. The department negotiated with service providers in late 2002 for better rates based on traffic. While the rates are expected to reduce by 30 per cent per annum, increased use will absorb much of the gains from rate reductions.
Client Use of Infrastructure
Number of Telephone outward calls, Facsimile pages sent and Internet mail messages
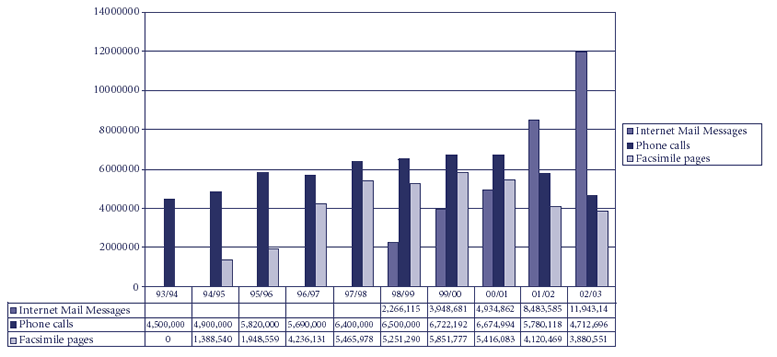
The use of electronic mail has increased considerably over the last two years. Internal mail is relatively static but Internet mail increased significantly, particularly in February and March during the war in Iraq.
Infrastructure Price (Cost)
The overall cost of Infrastructure was $18.68 million, 6.6 per cent more than 2001-2002.
Infrastructure Price (Cost) ($m)
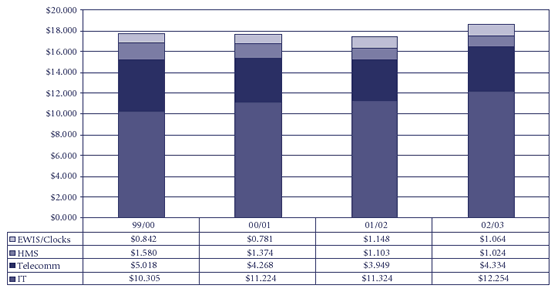
The broadcasting support systems are the Emergency Warning Intercom System (EWIS) and clocks (including division lights and bells) and the House Monitoring Service (HMS), the Parliaments internal broadcasting network which provides 50 TV channels in Parliament House and a lesser number to the media and 30 government agencies.
The cost to maintain these systems is relatively static and the reduction in costs reflects a more efficient maintenance program, better risk management and a minor reduction in the support program. The systems are maintained to provide 100 per cent availability.
The cost of telecommunications rose as a result of increased Internet usage, increased cost for the services of the facilities management team and increased maintenance charges on the new PABX system after the initial warranty period.
Telephone costs have been contained within budget by using competing telecommunication carrier and service provider options. A review of tariffs offered by the carriers and service providers is undertaken every 12 to 18 months, with a review in progress at the end of the reporting period, with implementation expected in July 2003.
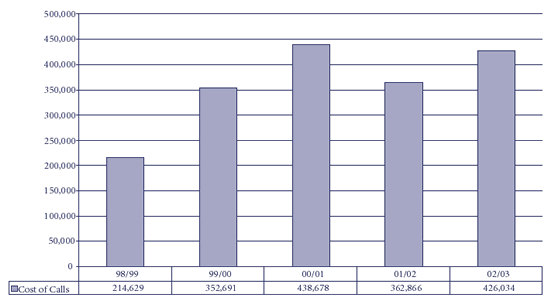
Calls to mobile phones and forwarding calls to mobiles added to the overall telecommunications cost, with calls to mobile phones in 2002-2003 rising 17 per cent and accounting for 20 per cent of the telecommunication call budget. The nature of the telephony market is that discounted rates are significantly harder to negotiate for mobile services than fixed services, so increased calls to mobiles is reflected in disproportionately higher increases in costs.
Calls to Mobile Phones from Parliament House
Since the installation of the original mobile phone antenna system in Parliament House in the early 1990s there have been coverage and performance difficulties. In 2002 Telstra surveyed the building, identified areas of poor coverage and developed a new model antenna.
The 80 existing antennas were replaced with the improved model and an additional 18 antennas installed. The antenna installation commenced in May 2003 and was completed in June 2003, leading to significant improvement in mobile coverage.
Broadcast Facsimile Gateway
The Broadcast Facsimile Gateway (BFG) is provided free to Senators and Members and a limited number of departmental clients, with 224 clients using 6388 data lists to send 3.9 million pages of facsimiles during the year. BFG calls sent internally within Parliament House account for 11.25 per cent of total BFG traffic.
| 1999/2000 | 2000/01 |
2001/02 |
2002/03 | |
|---|---|---|---|---|
| Registered Users | 204 | 211 | 212 | 224 |
| Distribution lists | 5,693 |
5,987 | 6,249 | 6,388 |
| Pages sent by Fax | 5,924,944 | 5,416,013 | 4,119,445 | 3,880,551 |
| Av. pages per Fax | 2.06 | 1.84 | 1.93 | 2.00 |
An audit of the broadcast fax gateway led to around 9000 redundant numbers being deleted. The facility is being upgraded to improve performance of both the broadcast fax and PC to fax services. A test PABX system is being acquired to test the functionality of new versions of telecommunications software to ensure that it is suitable for client use.
Infrastructure quality
Meeting client needs: Client satisfaction is reported under the Services output.
The quality of the Infrastructure output is judged in terms of client satisfaction and availability of services. The objective is to provide Senators and Members with world class services that support their diverse and time critical needs.
DPRS invests considerable effort and funds in acquiring and developing infrastructure to enable clients to achieve their business goals more efficiently. Further improvements in use of services can be achieved by assisting clients to make full use of the available tools and services.
In the recent client satisfaction survey 80 per cent of clients indicated that they were satisfied with the infrastructure and its availability and reliability.
Infrastructure quality - availability
The department's Service Development Strategy provides a framework for managing system availability by classifying systems according to how the operations of Senators, Members and the Parliament are affected if a particular service is not available. The work of Senators and Members and the Parliament is diverse and time critical, requiring a high level of service availability. As a consequence, the department has set high service availability targets and ensures any scheduled downtime for maintenance is negotiated with clients.
INFRASTRUCTURE AVAILABILITY (percentage point variance to last year) |
SITTING HOURS (8 am to midnight) |
BUSINESS HOURS
(8 am to 6 pm) |
OTHER TIMES |
ALL TIMES |
|---|---|---|---|---|
| Information technology | target 99.9% | target 99.9% | target 99.0% | |
| Desktop | 100% (nil %) | 100% (nil %) | 99.98% (+0.1%) | |
| Applications | 99.96% (+0.01%) | 99.95% (+0.15%) | 99.88% (+0.05%) | |
| Telecommunications | target 99.9% | target 99.9% | target 99.9% | target 100% |
| PABX | 100% (+0.01%) | |||
| Facsimile | 99.98% (+0.04%) | 99.92% (+ 0.02%) | 95.68% (-4.30%) | 99.29% |
| Broadcasting | target 100% | |||
| Vision services | 100% (nil %) | |||
| Audio services | 100% (nil %) |
In 2002-2003, the department continued to provide reliable and robust systems to support the work of Senators, Members and the parliamentary departments, with the majority of system unavailability in desktop and applications being due to scheduled maintenance.
Availability of the broadcast facsimile gateway was below standard due to a failure to automatically restart the service after routine maintenance in July 2002. Procedures have been amended to prevent a recurrence of the problem. The broadcast fax gateway was available at close to 100 per cent throughout the rest of the year.
In general, telephony services are available 100 per cent of the time. Scheduled maintenance of the telephony system is restricted to weekends and generally after midnight.
Broadcast systems availability continues to remain high, reflecting the success of the department's preventative maintenance strategy, which focuses resources on services critical to Senators' and Members' chamber and committee work.
Infrastructure quality - project delivery
The department manages information technology, telecommunications and broadcasting projects.
Performance indicator: projects are delivered on time, on budget, with clients satisfied with project deliverables.
20 projects were completed in 2002-2003, of which:
PROJECT PERFORMANCE |
2002-03 (%) |
2001-02 (%) |
|---|---|---|
| SCHEDULE | ||
| On time | 45 |
59 |
| Up to one month late | 10 | 14 |
| More than one month late | 45 | 27 |
| BUDGET | ||
| On budget | 75 | 95 |
| Within 10% of budget | 15 | 5 |
| More than 10% over budget | 10 | - |
The Project Office continues to track project performance and reports on projects through weekly project status reports and a monthly Project Office newsletter, published on the Projects portal.