Chapter 3
Overview of data on Indigenous wellbeing
3.1
This chapter will provide a broad overview of selected data on community
wellbeing, including in areas of health, education, housing and community
infrastructure, juvenile justice, employment and child protection across all
states and territories with regional and remote Indigenous populations. The
committee thought it useful to illustrate broadly some aspects of the wellbeing
of Indigenous populations between both the states and territories in
metropolitan and in regional and remote areas within each jurisdiction are
being measured and reported.
3.2
According to the Australian Bureau of Statistics (ABS) there are two
main types of data useful for evaluation purposes, these are statistical and
administrative collections:
...statistical collections refer to data collected solely for
statistical purposes, such as sample surveys and censuses...[and] administrative
collections refer to data collected in the process of administering or
evaluating a government or community program or service (i.e. the data are a
by-product of an administration process).[1]
3.3
The main source of the data used for this report is the ABS' statistical
and administrative collections as well as other sources such as the Australian
Institute of Health and Welfare and the Ministerial Council on Education, Employment,
Training and Youth Affairs.
3.4
A comprehensive table listing the range of data available on Indigenous
communities was provided to the committee by the ABS and formed the basis of
the table that can be found at Appendix 4 of this report.
3.5
As outlined in its first report, the committee uses the most widely
accepted geographical definition of remoteness which is the Accessibility/Remoteness
Index of Australia (ARIA+). ARIA+ measures the remoteness of a locality based
on the physical road distance to the nearest urban centre and classifies
localities according to the following definitions:
-
major city;
-
inner regional;
-
outer regional;
-
remote; or
-
very remote.[2]
3.6
The committee also wishes to note that data can be interpreted in many
different ways and to suit the purposes of the user. The committee does not
consider the data presented here to be a definitive and absolute picture of
regional and remote Indigenous communities across the states and territories.
Rather the committee intends for the data to present a broad illustration of
the status and wellbeing of regional and remote Indigenous communities.
Issues with current data collections
3.7
During the committee's inquiry a number of submissions and witnesses
presented evidence to the committee on the need for better and more extensive
data collection at both national and state levels.[3] A focus on attaining more
accurate and detailed data would assist in the assessment and monitoring of both
the wellbeing of regional and remote Indigenous communities and the
effectiveness of government policies and service delivery.
3.8
The ABS noted the importance of quality data in its submission, stating
that:
To assess the impact and effectiveness of government policies
on the wellbeing of regional and remote Indigenous communities, high quality evidence
that is comparable over time and across jurisdictions is required. Targets will
only provide motivators for improvement if there is data to show whether or not
they are being met. Good data also provide the broader evidence base for
understanding what interventions might be successful, and in which locations
and situations.[4]
3.9
The committee firmly agrees with the ABS that accurate and relevant data
must provide the evidence base for informing successful policies and to make
progress towards increasing the wellbeing in regional and remote Indigenous
communities.
3.10
The National Centre for Education and Training on Addiction (NCETA)
noted that:
Improved knowledge and understanding of data...is important for
several reasons. It allows benchmarks to be established against which programs
can track progress. It allows goals to be set for improvements and it provides
an empirical basis for the development of targeted interventions.[5]
3.11
The committee also notes that the Commonwealth Minister for Families,
Housing, Community Services and Indigenous Affairs, in an address to the
National Press Club, highlighted the Commonwealth government's commitment to
evidence and evaluation, which the committee agrees requires a commitment to
accurate and extensive data collection.
Inevitably there will be difficult decisions but all these
decisions will be driven by one single criterion - evidence. This is the
Government's obsession and we make no excuses for it. It is my abiding fixation
and I readily acknowledge it.
All our policy decision-making will be based on a thorough,
forensic analysis of all the facts and all the evidence. Once implemented, all
programs will be rigorously and regularly evaluated. This is the principle I will
impose across my portfolio.
Spending buckets of money and hoping for the best, does not
work - a point repeated again by Coroner Hope who says in the Kimberley there
have been massive funding allocations with minimal accountability.[6]
3.12
The Australian Institute of Health and Welfare (AIHW) also presented
data in its submission to the inquiry which included both administrative and
statistical data. The AIHW noted that the availability, representativeness and quality
of data on the health and wellbeing of Indigenous people in regional and remote
areas is insufficient:
Some surveys are limited by the sample size and therefore the
level disaggregation possible. Other surveys, ask different questions of people
living in remote areas, reducing comparability. For administrative data sets
the issues are more related to differences in the completeness of Indigenous
identification by remoteness—with people living in remote and very remote areas
being more likely to identify as Indigenous than those living in urban areas...Information
on area of residence needed to derive remoteness categories is not available
for many administrative data sources. For example, the juvenile justice and
child protection data sets...cannot be disaggregated by geographical area below a
very broad scale. The lack of specific locational information in some health
and welfare administrative data sets makes it impossible to present information
for Indigenous people by remoteness.[7]
3.13
The ABS in its submission outlined similar concerns to the AIHW.
Increased resources and support, from all levels of
government, for improving identification of Indigenous people in administrative
datasets is essential for the ABS and others to maintain the momentum for
further progress in this area.[8]
3.14
Both the ABS and the AIHW also outlined particular concerns and problems
with the collection of administrative data at the committee's Canberra hearing.
The AIHW outlined some issues with collecting Indigenous data.
Basically our problem with Indigenous data is two-fold.
Usually with survey data, sometimes people who are under survey think across
regions. They can ask the question in urban areas but they change the question
slightly in remote areas, and that makes the data not comparable. Or sometimes
they drop a question completely because they think it is too sensitive in
remote areas and therefore we are not going to ask the question, in which case
we have a gap...
...Our problem is really mostly with administrative data.
Identification level can be variable by state and variable by remoteness.
People in remote areas are more likely to identify as Indigenous...They are still
involved in Indigenous cultural practices and so on. As you move into major
cities this becomes less clear. Therefore it is very difficult when we look at
health status by remoteness for us to separate the fact of identification or
whether there is an actual change in health status between the two areas,
really.[9]
3.15
The ABS noted particular concerns with administrative data collections,
stating that:
When we work with administrative systems we are in the hands
of the people who run those systems. We develop standards and we encourage
people to adopt those standards. Indigenous identification is one of the issues
in an area like criminal justice, but there is actually a paucity of data
across-the-board in many of these areas, particularly where the administration
is primarily with state and territory governments, which quite reasonably set
up independent systems, have different legislative frameworks, and then we have
to try to develop a national framework that fits around that. Our experience is
that that takes a very long time and it does not go as fast as anyone,
including us, would like it to.[10]
3.16
The Commonwealth Minister for Families, Housing, Community Services and
Indigenous Affairs, at the 2008 launch of a joint ABS and AIHW report on
Indigenous health, also outlined what the government considers as the current
inadequacies in data collection:
As the authors and drivers of policy we need quality data to
know what works and what doesn't.
But there are glaring gaps in national data collection. For
example this report only contains data on Indigenous deaths from the Northern
Territory, Western Australia, South Australia and Queensland.
This reveals serious gaps in the collection of essential
information including Indigenous mortality. This must be addressed.
The Government knows that if we are to close the gap in
Indigenous disadvantage we must fill in the gaps in data collection.[11]
3.17
The Productivity Commissioner, in a presentation at the ABS NatStats
conference in 2008, noted that improvement of the existing data collections on
births and deaths, hospitals, Medicare, and school enrolment, as well as
addressing the immediate gaps in data on crime victims and perpetrators and
regional data was required to improve the measurement of outcomes for
Indigenous people.[12]
3.18
The committee also notes that extensive gaps in baseline data exist in
relation to the Northern Territory Emergency Response (NTER). The report of the
NTER review board noted that:
While considerable quantitative and qualitative data is
available in the key areas of health, housing, education, policing and
employment in remote Territory communities, it was clear that little or no baseline
data existed to specifically evaluate the impacts of the NTER.
Apart from some initial scoping data, there was little
evidence of baseline data being gathered in any formal or organised format
which would permit an assessment of the impact and progress of the NTER upon
communities. The lack of empirical data has proved to be a major problem for
this Review and is an area that requires urgent attention.[13]
3.19
The Department of Human Services provided information in their
submission on where income managed funds had been allocated, stating that:
As at 23 January 2009, a total of $133,065,182.70 has been
income managed, of which $130,618.623.34 has been allocated by customers to
various priority items. Food is by far the highest expense incurred by income
managed customers. Representing just under 64 per cent, followed by housing at
9.5 per cent. This is further supported by anecdotal reports of more money
being spent on food, children being well-clothed and fed, houses being
furnished and roadworthy vehicles being purchased.[14]
3.20
At the Canberra public hearing the committee inquired as to how the
department had collected this data and how it had established that the majority
of income managed funds was being spent on food. The department responded:
Ms Gaha—We know that 64 per cent of money has been spent in
shops that primarily sell food. We cannot actually say every single item,
because they also sell clothes...
Senator SIEWERT—Exactly. There are household goods and all
sorts of things.
Ms Gaha—That is correct.
Senator SIEWERT—You do not actually know that 64 per cent has
been spent on food.
Ms Gaha—No. We know that that amount of money has been spent
in shops that primarily sell food.
Mr Tidswell—As the table said, it is the allocated funds.
When we sit down with customers, as you are well aware, we work through to
allocate to their priority needs. That is where that data is taken from.
Senator SIEWERT—That is where that comes from.
Mr Tidswell—Yes. It is not after sale.[15]
3.21
The committee notes that although there is anecdotal evidence to support
an increase in money being spent in shops and retail outlets that sell food, as
well as other approved items, it notes that there is no itemised data available
from the use of the BasicsCard to identify what income managed funds have
actually been spent on. It may not be accurate to say that almost 64 per cent
of income managed funds are being spent on food as there is no system to record
whether this actually occurs. The committee considers that this should be
clarified when the Commonwealth government is reporting on the use of income
managed funds.
3.22
The Department of Health and Ageing (DoHA) noted in its submission that
it is 'committed to providing policy advice and implementation of programs
based on the best available evidence'.[16]
The committee notes that DoHA contracted the AIHW to collate and analyse the
data from the NTER Child Health Check Initiative and the AIHW publicly releases
the findings from the data every six months.
3.23
The committee agrees with the NTER Review Board that the quality of data
collection and its use must be given urgent attention and that extensive
consideration must be given to the methodology and process for collecting and
analysing this data. The ABS outlined that high quality data is best obtained:
...when the procedures used are culturally appropriate and
where the Indigenous community is highly engaged in the statistical process.
This is particularly true for remote Indigenous communities. ABS, in its
statistical collection activity, has developed, over a number of years, a
national Indigenous engagement strategy to ensure that Indigenous communities
are better engaged in the statistical process, understand the uses to which the
statistical information is put in developing and evaluating policies that may
impact on them, and have statistical information returned to them in ways in
which they can use it.[17]
3.24
The ABS also cautions against the creation of additional new data
collections suggesting that in order to meet the current requirement for good
expansive data, governments should focus on improving the quality of existing
collections through better 'application of appropriate data management
principles, including the use of agreed definitions and classifications'.[18]
Limiting the number of data collections would also avoid increasing the
respondent load which is very important in Indigenous communities. As the ABS
explained:
Improving the wellbeing of Indigenous Australians is a key
focus for Australian governments. As the demand for evidence to support Indigenous
policy making continues to grow, so does the load placed on the small
Indigenous population by surveys and other research.
There is significant load placed on communities through the
collection of administrative data required as part of, or in support of,
particular service delivery programs. In addition, large-scale, national
surveys such as the ABS collections described in paragraph 9 and surveys commissioned
by other government agencies (state/territory and Australian government), which
generally are not national but can also be quite onerous, add to the respondent
load. However, research in Indigenous communities extends beyond statistical
collections such as national surveys and censuses to include smaller-scale
studies, for example, case studies which may be limited to one or two
Indigenous communities. In an environment of slow change, as the research load on
the Aboriginal and Torres Strait Islander population increases, so does the
likelihood of the Indigenous population becoming disengaged from the data
collection and statistical processes. This impacts on the ability to collect
high quality, relevant information to inform policy and research.[19]
3.25
The committee agrees with the ABS and AIHW that better data collection
and awareness of the importance of quality data is required. The committee also
urges governments to consistently and rigorously familiarise themselves with
available data and be disciplined in utilising the available data when
developing and implementing policies. This was a particular issue highlighted
in the NTER Review Board's report which noted that clearly identifying the size
and composition of the Indigenous population was critical to be able to assess
the NTER's effectiveness and the future resources required to achieve its
objectives. However the NTER did not appear to use the ABS 2006 estimates of
the Indigenous population in the NTER prescribed areas which was estimated at 44
229. The Review board found that internal NTER planning documents cited the
population as 35 929, which according to the Review Board raised 'questions
about the adequacy of the demographic base that has informed the NTER roll-out'.[20]
3.26
The committee is concerned that although quality data from the ABS was
available it was not sufficiently utilised in the development of the NTER
policies. As the ABS noted in its submission:
One of the legislated functions of the ABS (ABS ACT 1975) is
to ensure coordination of the operations of government agencies in the
collection, compilation and dissemination of statistics and related information.
This includes avoiding duplication in information collection, attaining compatibility
between statistics compiled by agencies, and maximising utilisation of
information available for statistical purposes.[21]
The committee is deeply concerned that reliable data was
available from the ABS but it was not used when the measures of the NTER were
being developed.
Recommendation 1
3.27
The committee recommends that COAG make a concerted effort to
improve the quality and scope of existing data collections on regional and
remote Indigenous communities and urges all departments and agencies to
routinely utilise the expertise of dedicated statistical agencies such as the
ABS and AIHW when collecting and analysing data to ensure that it is consistent
and accurate across all jurisdictions.
Undercount of Indigenous
populations in the Census.
3.28
The committee also notes that in its previous report it highlighted
concerns regarding a substantial undercount of the Indigenous population in the
2006 Census.[22]
The ABS advised the committee that they have made reforms and changes that will
more accurately reflect the Indigenous population:
After evaluating the results from the 2006 census, and
particularly undercount for the Northern Territory, WA and Queensland, we have
set up a working group that comprised representatives from state and federal
agencies, local government, various development commissions and Indigenous
organisations to look at the issue surrounding the conduct of the 2006 census.
As a result of that working group we came up with over 30 recommendations on
how we could address some of those issues. Some of those recommendations have
now been included in our plans for the 2011 Census and we will continue to work
closely with that working group in the lead-up to the 2011 census.[23]
3.29
Some of the strategies the ABS are employing for the 2011 Census
include:
-
reducing the overall national under-enumeration rate for the
Indigenous population by reducing the enumeration period for remote
communities;
-
seeking earlier and ongoing engagement with Indigenous groups and
communities and all levels of government;
-
expanding the current Indigenous Community Engagement Program;
-
employment of local engagement managers in areas where the ABS
has had problems with enumeration such as Broome, Fitzroy Crossing, Tennant
Creek and Mount Isa;
-
provision of a greater level of support for Indigenous people in
completing their forms;
-
an expanded public relations campaign;
-
expanding the sample of remote Indigenous communities that are
selected in the post enumeration survey;
-
employment of an additional 300 Indigenous people to provide
assistance to Indigenous households in completing the questionnaires; and
-
establishment of 'flying squads' and mobile teams to travel to areas
where problems have been identified during enumeration.[24]
3.30
The committee will continue to monitor the release of new data
throughout the inquiry and will detail the findings of t
3.31
he new National Aboriginal and Torres Strait Islander Social Survey
(NATSISS) which is due to be released in October 2009 in its next report.
Social and demographic context of Indigenous communities
3.32
When comparing the wellbeing of Indigenous communities across the states
and territories, an understanding of the different social and demographic
contexts is important. There are substantial and very important differences
across the states and territories which no doubt influence the way policy is
developed and the method of service delivery.
3.33
Table 1 illustrates the dramatically higher proportion of Indigenous
people that live in the Northern Territory compared to all other states.[25]
For example, 30 per cent of the total population of the Northern Territory are Indigenous
but in all other jurisdictions the overall Indigenous population is less than 4
per cent. This large difference is again repeated when looking only at remote
and very remote populations in each state and territory. In the Northern
Territory 32 per cent of the remote population are Indigenous, compared with
the next highest number in New South Wales at 19 per cent. This is similar to
very remote areas of the Northern Territory where 74 per cent are Indigenous
compared again with the next highest of Queensland and Western Australia at
just under 40 per cent.
Table 1: Demographic
context of indigenous populations by state and territory
|
|
NSW |
VIC |
QLD |
SA |
WA |
TAS |
NT |
Aust |
|
%
of population that are Indigenous |
2.24% |
0.65% |
3.54% |
1.79% |
3.45% |
3.76% |
30.39% |
2.50% |
|
%
of population in remote areas that are Indigenous |
19.73% |
2.04%* |
14.66% |
2.65% |
13.11% |
4.91%* |
32.19% |
15.19% |
|
%
of population in very remote areas that are Indigenous |
27.49% |
N/A |
39.80% |
29.07% |
39.27% |
N/A |
74.07% |
47.45% |
Source:
ABS 2002 NATSISS * Includes outer regional and remote areas
3.34
Table 2 presents data from the most recent 2002 NATSISS that
identifies the proportion of Indigenous people in each state and territory that
live on homelands and/or traditional country and who identify with a language
group or clan. Again the Northern Territory has the highest percentage of its
Indigenous population, at 38 per cent, who still live on homelands and/or
traditional country followed by Western Australia with just over 26 per cent and
New South Wales with 23 per cent.
Table 2: Social context of indigenous populations by
state and territory
|
NSW |
VIC |
QLD |
SA |
WA |
TAS |
NT |
Aust |
|
% of Indigenous people living
on homelands/ traditional country |
23.8% |
14.9% |
13.4% |
16.1% |
26.4% |
N/A |
38.0% |
21.9% |
Source:
ABS 2002 NATSISS
3.35
Table 3 below shows the percentage of the Indigenous population
identifying with a tribal group or language group or clan in remote and
non-remote areas in New South Wales, South Australia, Western Australia,
Queensland and the Northern Territory. The table illustrates that New South
Wales has the lowest percentage of Indigenous people identifying with a tribal
group or language group or clan. The Northern Territory has the highest
percentage of the population identifying with a tribal group or language group
or clan, at almost 95 per cent in remote areas, followed by South Australia,
remote areas in Western Australia and Queensland.
Table
3: Identification with tribal group or language group/clan
|
NSW |
QLD |
SA |
WA |
NT |
Aust |
|
Remote |
45.3% |
65.4% |
77.6% |
68.7% |
94.3% |
76.6% |
|
Non-remote |
41.5% |
53.0% |
58.8% |
40.8% |
41.5% |
45.7% |
|
Total |
41.7% |
56.2% |
63.3% |
53.8% |
88.4% |
54.1% |
Source: ABS 2002 NATSISS
3.36
Another significant area of difference between the states and
territories in the social and demographic context is the percentage of
Indigenous people who do not speak English as the main language at home, as
illustrated in Figure 1.
Figure 1: Primary language spoken at home
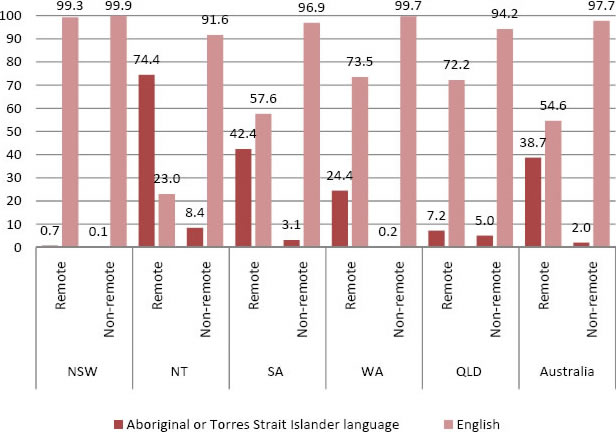
Source: ABS 2002 NATSISS
3.37
In New South Wales less than one per cent of Indigenous people in both
remote and non-remote areas speak an Indigenous language as the main language
at home, whereas in the Northern Territory almost three-quarters of Indigenous
people speak an Indigenous language at home followed next by remote areas of
South Australia with 42 per cent and Western Australia with just under
one-quarter. Most of the other states also have sizeable differences between
remote and non-remote areas except for New South Wales and Queensland where
there is no significant statistical difference between the two populations.
3.38
Overall, this broad outline of some of the main data on the demographic
and social context of Indigenous communities indicates that the Northern
Territory has the largest remote Indigenous populations with the highest level
of Indigenous language speakers and people living on homelands or traditional country.
The committee notes that when developing and implementing policies and
delivering services to Indigenous communities in the Northern Territory the
government would face greater logistical challenges and costs than many of the
other jurisdictions.
General wellbeing in regional and remote Indigenous communities
3.39
The 2002 NATSISS and the 2004-05 National Aboriginal and Torres Strait
Islander Health Survey (NATSIHS) collected data on the general, social and
emotional wellbeing of Indigenous communities including personal stressors,
community issues, mental health, cultural identification and racism. The AIHW
also reports on the wellbeing of Indigenous people including data on 'health,
health determinants, welfare, access to housing and/or homelessness services,
aged care and other services'.[26]
3.40
Figure 2 over the page illustrates some differences between states and
territories in relation to the types of personal stressors experienced in the
last 12 months by Indigenous people in remote and non-remote areas.
3.41
The types of stressors reported by respondents differ significantly
according to remoteness. Figure 2 illustrates that Indigenous adults who lived
in remote areas in the Northern Territory, South Australia, Western Australia
and Queensland were significantly more likely than other Indigenous adults to
say that they had been a witness to violence, had a gambling problem, and/or
had been involved in a serious accident. Remote areas in Queensland recorded
the highest reported stressors across all five listed in the graph with over 50
per cent of respondents reporting overcrowding and alcohol or drug related
problems as personal stressors followed with the next highest percentages in
the Northern Territory, South Australia and Western Australia respectively.
Only in New South Wales did a non-remote area report a higher instance of one
of the stressors, that being alcohol or drug related problems, otherwise all
other stressors were more prominent in remote areas.
3.42
The AIHW notes that the higher incidence of Indigenous people living in
remote or very remote areas reporting stressors than those in major cities is most
likely to be related to socioeconomic and environmental disadvantage:
...for example, 2% of Indigenous houses are community rental housing
in major cities compared with 55% in remote Australia, and more Indigenous
clients received support for homelessness in regional and remote areas than in
major cities.[27]
Figure
2: Type(s) of personal
stressors experienced in last 12 months
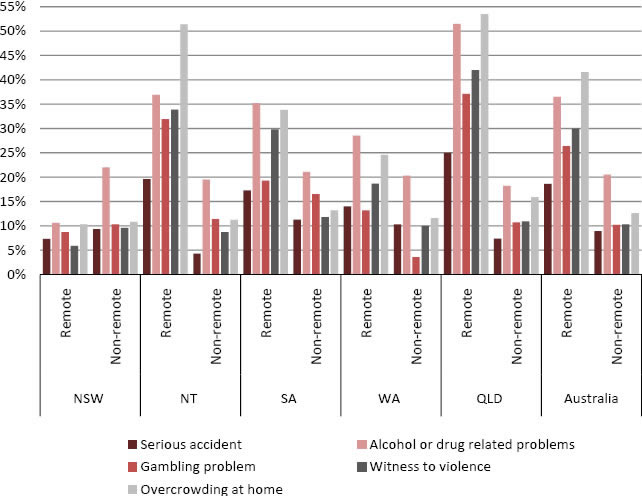
Source: ABS 2002 NATSISS
3.43
The NATSISS also surveyed the percentage of the Indigenous population
over 15 years of age that reported neighbourhood and community problems in both
remote and non-remote areas. The graph below illustrates a small section of the
responses which again differ across jurisdictions. In New South Wales there was
very little difference between remote and non-remote areas however in
Queensland the difference is quite distinct with all of these reported in
higher numbers in remote areas. The remote areas of Queensland reported the
highest levels of all these community problems, with almost 40 per cent of
respondents reporting sexual assault as a problem in remote areas of Queensland
with the next highest in the Northern Territory at just under 10 per cent. Over
50 per cent of respondents reported that illegal drugs were a concern in remote
Queensland and South Australia.
3.44
Also evident is the high rate of reported community and neighbourhood
problems involving young people. Apart from remote areas of New South Wales,
where it was just under 30 per cent, in all other jurisdictions over 30 per
cent of respondents reported that young people were causing problems in the
community, with remote Northern Territory reporting almost 50 per cent and remote
Queensland again the highest at over 60 per cent.
Figure 3: Neighbourhood/community problems
reported, 2002
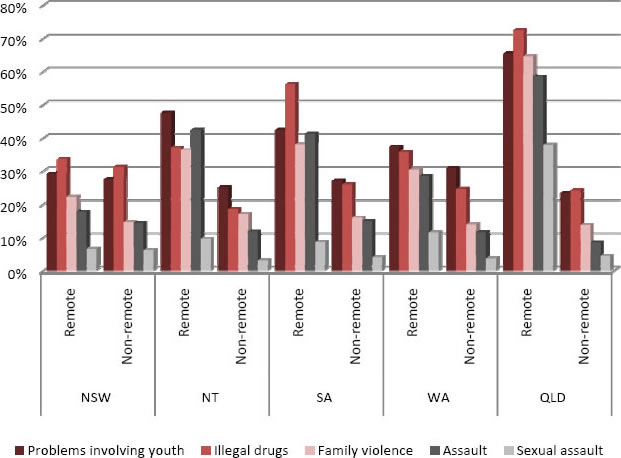
Source:
ABS 2002 NATSISS
3.45
A similar result is also illustrated in the graph over the page which is
a selection of positive wellbeing indicators taken from the most recent
NATSIHS. Apart from New South Wales at least 70 per cent of respondents in the
other states and territories were happy all or most of the time but more New
South Wales respondents in remote areas reported being happy some of the time.
The overall level of happiness reported in Indigenous communities was for the
most part similar across the states and territories.
3.46
On the other hand Figure 4 below also provides data on sadness, with almost
10 per cent of respondents in remote areas of New South Wales and South
Australia as well as both the remote and non-remote areas in Western Australia
being so sad that nothing could cheer them up all or most of the time. Almost
20 per cent of respondents in remote New South Wales, Northern Territory, South
Australia and Western Australia recorded being so sad that nothing could cheer them
some of the time. However again, overall there was no sizeable difference
across the states and territories in positive wellbeing even though many of the
contributing factors—such as housing, safety and education—can differ
significantly in the same areas.
Figure 4: Selected indicators of positive wellbeing, by
remoteness, 2004-05
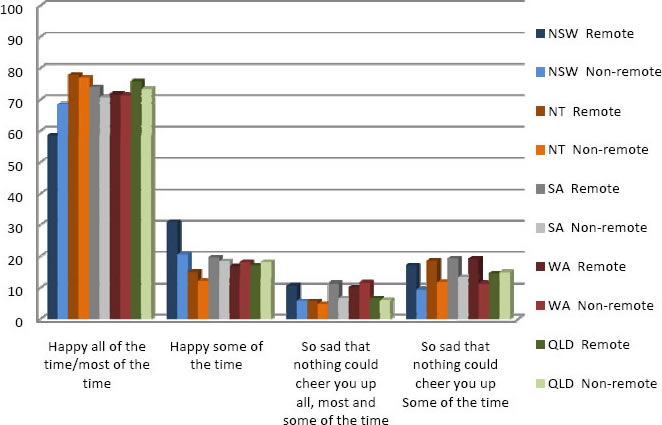
Source:
ABS 2004-05 NATSIHS
3.47
The committee also notes the lack of data on the characteristics of
Indigenous carers and their wellbeing. When asked at the committee's hearing in
Canberra whether the AIHW was aware of any data on carers in Indigenous
communities looking after the elderly population and people with disabilities,
the AIHW responded:
We are not aware of anything specific in relation to
Indigenous carers. We are doing some further work on carers at the moment,
basically off administrative data sets for our biennial publication Australia’s
Welfare, which has not been published yet but may well have come up with
further information. At this stage there is nothing further that we could
suggest.[28]
3.48
The committee finds this lack of data and a seeming lack of any plans to
improve this data concerning and urges the Commonwealth government to consider
improving data collection in this area.
Housing and community infrastructure
3.49
There is comparable data on housing and community infrastructure that
again illustrates sizeable differences between the states and territories.
3.50
The data illustrated here in Table 4 identifies that the Northern
Territory has both the highest number of Indigenous people living in an
overcrowded household and in a dwelling with major structural problems. For
example in the Northern Territory only 39 per cent of Indigenous people live in
a dwelling with no major structural problems whereas all other jurisdictions
record that almost 60 per cent of Indigenous people live in a dwelling with no
major structural problems. Overcrowding in the Northern Territory is three
times greater than the national average and more than twice the rate of
overcrowding in the state with the next highest rate, which is Western
Australia.
Table 4: Indigenous
housing, 2004-05
|
NSW |
VIC |
QLD |
SA |
WA |
TAS |
NT |
Aust |
|
% of Indigenous
people Living in a dwelling with no major structural problems |
64.3% |
62.3% |
64.3% |
59.9% |
59.2% |
73.5% |
39.5% |
60.4% |
|
% of Indigenous
households that were overcrowded in 2006 |
9.0% |
8.3% |
13.6% |
10.7% |
14.2% |
6.7% |
33.7% |
12.4% |
Source: ABS 2004-05 NATSIHS
3.51
In regards to houses being connected to essential infrastructure, the
AIHW's report on Indigenous housing indicators 2005-06 found that:
The majority of discrete Indigenous communities in Australia
were connected to an organised supply of water (99%), sewerage (98%) and
electricity (97%). The Northern Territory had the largest number of communities
not connected to an organised supply of these services, with seven not connected
to water or sewerage and 20 not connected to electricity.[29]
3.52
The Overcoming Indigenous Disadvantage report noted that data on access
to clean water and functional sewerage needs to be collected on a regular basis
to allow 'comparison between services in Indigenous communities and those delivered
by major utilities'.[30]
3.53
The committee notes that although all states and territories need to
focus on improving Indigenous housing there is a clear deficiency in the
standard and availability of Indigenous housing in the Northern Territory when
compared to the other jurisdictions with significant remote and very remote
Indigenous populations. The committee notes that current Commonwealth and
Northern Territory policy is focused on alleviating some of this housing
distress by the selection of 15 out of the 26 priority communities earmarked
for new housing being in the Northern Territory. This is discussed in more
detail in Chapter 4.
3.54
The levels of community infrastructure and services provided in Indigenous
communities also differ greatly between states and territories. As previously
noted, the Northern Territory has the poorest housing figures, yet in some
areas of access to community infrastructure it records some of the more
positive outcomes. For example, as Figure 5 illustrates, the Northern Territory
has the highest proportion of its Indigenous population in discrete Indigenous
communities with a women's shelter and, along with Queensland, the highest
recorded percentage for swimming pools.
3.55
The data presented in Figure 5 below suggests that access to youth
centres is low across all jurisdictions with only Queensland having more than
50 per cent of its population of discrete Indigenous communities with access to
youth centres. All the other jurisdictions all recorded less than 30 per cent.
The lack of access to youth centres as well as other youth programs in remote
Indigenous communities in the Northern Territory in particular is supported by
the Central Australian Youth Link Up Service's outline in their submission on
the infrastructure needs in the Central Australian region of the Northern
Territory.[31]
Figure 5: Proportion of reported usual population of discrete Indigenous
communities with access to facilities, 2006
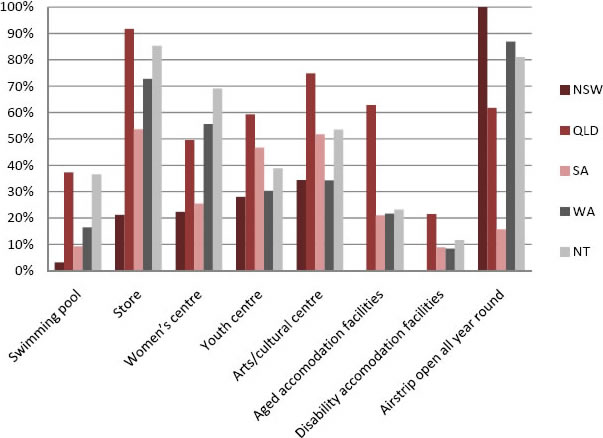
Source: AIHW 2008 Aboriginal and Torres Strait
Islander Health Performance Framework report
3.56
The committee also notes that Figure 5 illustrates that New South Wales
recorded the lowest proportions across all four selected categories, recording
almost half the availability/existence of community infrastructure of
Queensland. For example New South Wales has no aged or disability accommodation
facilities in its discrete Indigenous communities. All other states, apart from
South Australia, also registered a very low proportion of access to both aged
facilities and to disability accommodation facilities, with no state or
territory recording more than 20 per cent of the reported usual population in
discrete Indigenous communities having access to disability accommodation
facilities.
3.57
The committee is concerned that the data indicates very low access to
aged facilities and disability accommodation facilities in all jurisdictions in
discrete Indigenous communities. Such facilities, as well as other respite
facilities, are very important in any community in a regional or remote area.
The committee discusses this further in relation to the NTER, and will pursue
further investigations into aged care support and facilities in its remaining
reports.
Figure 6: Indigenous
access to telephone and internet in remote areas
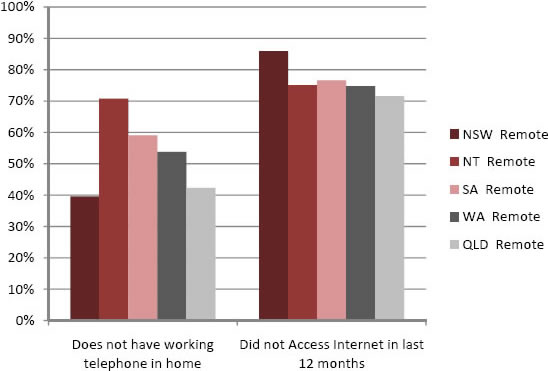
Source:
ABS 2002 NATSISS
3.58
Figure 6 above depicts access to telephones and the internet in remote
areas across the states and territories. Access to the internet was
comparatively limited across all jurisdictions with at least 70 per cent of
people not using the internet in the last 12 months. However with telephone
access in the home results were much more varied, with just over 70 per cent of
Indigenous people in remote areas of the Northern Territory not having access
to a telephone in their own home, compared to 40 per cent in New South Wales.
Clearly a greater focus is required in bridging the 'digital divide' in
regional and remote Indigenous communities.
Indigenous educational attainment and standards
3.59
In the area of education the data again illustrates large differences
between the standards of reported Indigenous attainment levels across the
jurisdictions. The graph below outlines the educational attainment of
Indigenous people aged over 15 years that were surveyed in the NATSISS. From
this graph the highest proportion of Indigenous people who have never attended
school live in remote areas of the Northern Territory, almost 10 per cent,
followed by remote areas of Western Australia, South Australia, Queensland and
finally New South Wales with 1.6 per cent. Across all jurisdictions the number
of people who never attended school was much lower in non-remote areas.
Figure 7: Level of educational attainment of Indigenous
persons aged 15 years or over, 2002
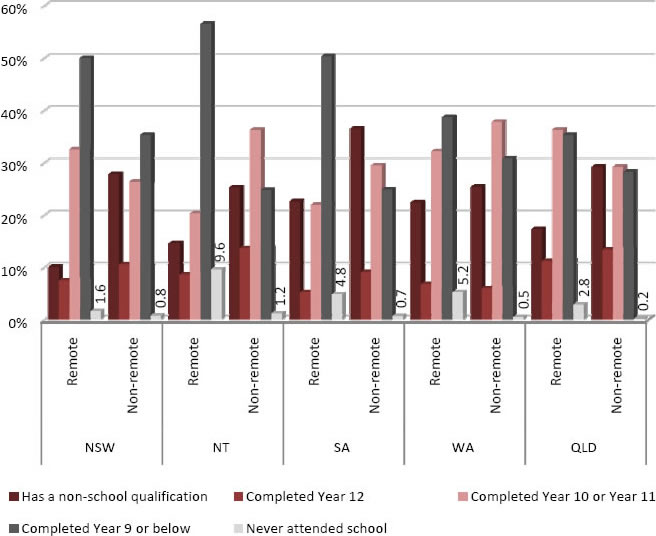
Source:
ABS 2002 NATSISS
3.60
Figure 7 above also shows that remote areas in New South Wales have the
lowest percentage of Indigenous people with non-school qualifications at just
below 10 per cent. Only the remote areas of South Australia and Western
Australia registered more than 20 per cent of Indigenous persons aged over 15
with a non-school qualification.
3.61
NCETA notes in its submission that:
Potential factors contributing to the low levels of
Indigenous students’ school retention rates include availability and
accessibility of schools, especially secondary schools, racism at school,
parents’ negative experiences of schooling, wellbeing of the children (poor
health, hunger, hearing difficulties, substance abuse), and the perceived
quality and relevance of available schooling.[32]
3.62
The National Assessment Program—Literacy and Numeracy (NAPLAN) test is
another recent addition to nationally comparable data collections on
educational achievement that specifically identifies Indigenous students and
geographical locations. The committee notes the Council of Australian Governments
(COAG) has stated that the results of the NAPLAN tests will be used as performance
indicators by the COAG Reform Council to measure progress against the Closing
the Gap target to 'halve the gap for Indigenous students in reading, writing
and numeracy within a decade'.[33]
3.63
The most recent tests for which results have been released were
conducted in May 2008 for Years 3, 5, 7 and 9 across Australia. This was the
first time all students in the same year level have been assessed on the same
test items across reading, writing, language conventions (spelling, grammar and
punctuation) and numeracy in all states and territories. The Ministerial
Council on Education, Employment, Training and Youth Affairs (MCEETYA) in the
report on the results of the 2008 NAPLAN tests stated that:
The tests broadly reflect the curriculum content across all
States and Territories, and the types of test questions and test formats were
chosen so that they would be familiar to teachers and students.
NAPLAN is an important innovation in national literacy and
numeracy assessment in Australia. It reports the full range of student
achievement against a common scale and uses a common set of tests to resolve
the technical difficulties associated with equating State and Territory based
tests.[34]
3.64
The NAPLAN results show that overall at all year levels Indigenous
students were less likely to be achieving at or above the national minimum
standards than non-Indigenous students. The report notes that across year
levels:
...there is a decline in the difference between Indigenous and
non-Indigenous student mean scores for Reading, Spelling, Grammar and Punctuation,
but there is an increase in the differences for Writing. The differences in
Numeracy are the same at each year level. The participation rate for Indigenous
students declines as year level increases.[35]
3.65
The committee has outlined in this report the reading and numeracy
results for Years 3 and 7 across all jurisdictions with remote and very remote
populations. The results from the NAPLAN for these areas are illustrated
Figures 8-11 on the following pages.
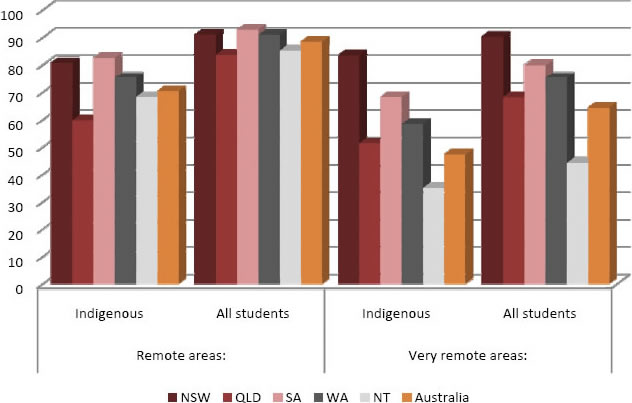
3.66
For the year 3 results in reading, remote and very remote areas in New
South Wales and South Australia had the highest percentages of Indigenous
students at or above national minimum standard, at around 70 per cent in remote
areas and 60 per cent in very remote areas. However, in very remote areas in
Queensland, Western Australia and the Northern Territory less than 40 per cent
of Indigenous students were at or above national minimum standard, with the
Northern Territory scoring around 14 per cent. Again in numeracy New South
Wales and South Australia performed the best out of all jurisdictions in remote
areas while in very remote areas only the Northern Territory recorded less than
50 per cent of students at or above national minimum standard.
3.67
Figure 9 illustrates reading achievements for Year 7 students. The
committee notes the very low percentage of Indigenous students that are at or
above the benchmark in very remote areas in South Australia and the Northern
Territory. In South Australia only 17 per cent were at or above the benchmark
and in the Northern Territory it was just under 14 per cent. The Northern
Territory government has previously acknowledged the need to improve Indigenous
literary and numeracy skills in a 2008 policy document:
The ability to read and write and to be numerate is the
foundation for all school learning. Good literacy and numeracy skills are critical
if young people are to complete their schooling successfully. These skills are
also required if they are to participate fully in the economic and social
development of the NT and the nation.
Despite substantial investment by the NT and Australian
governments in supporting the improvement of literacy and numeracy skills for students,
and the genuine effort of Department of Education and Training (DET) staff over
many years to improve results, there has been no significant improvement in NT
students ‘ literacy and numeracy outcomes.[36]
Figure 8: Percentage of Year 3 students at or above national
minimum standard in reading, 2008
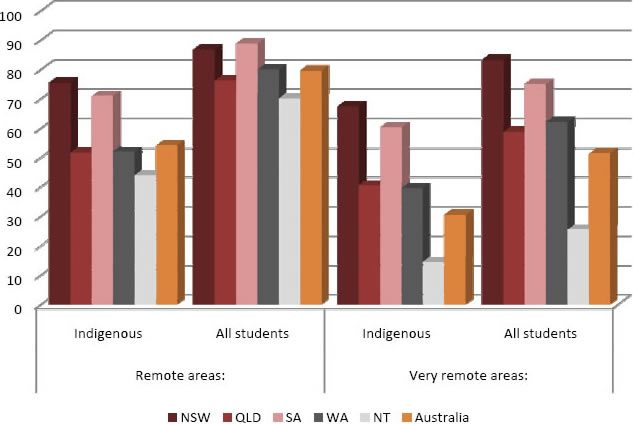
Figure 9: Percentage of Year 3 students at or above national minimum standard
in numeracy, 2008
Source:
MCEETYA 2008 NAPLAN
Figure 10: Percentage of Year 7 students at or above national minimum standard in
reading, 2008
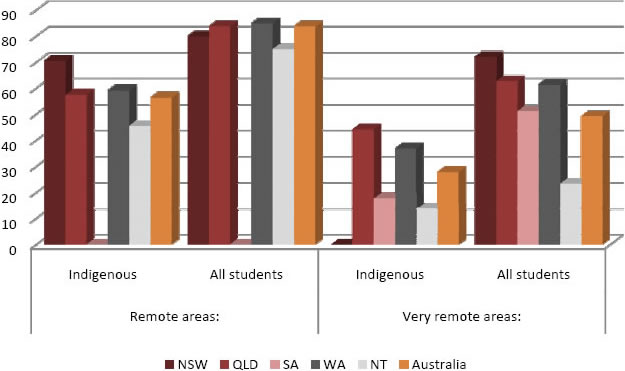
Note: Where there are no
results this indicates that the data was not published as there were no
students tested or the number of students tested was less than 30.
Figure 11: Percentage of Year 7 students at or
above national minimum standard in numeracy, 2008
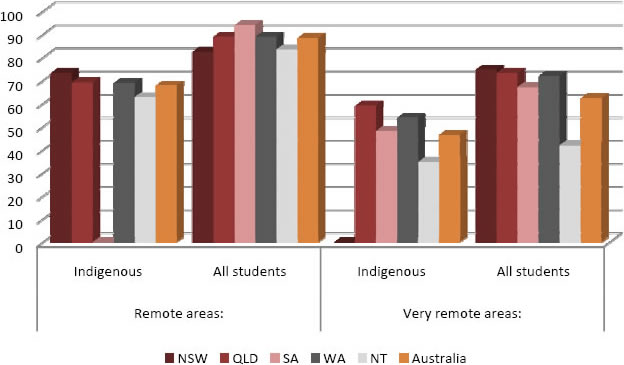
Source: MCEETYA 2008 NAPLAN
3.68
The MCEETYA report noted that the Year 7 results for reading and
numeracy showed that:
In the Northern Territory, Indigenous students are
one-quarter to one-third as likely to be achieving at or above national minimum
standards in literacy domains and half as likely to be achieving at or above
national minimum standard in Numeracy...
...the mean score for Indigenous students [across Australia] is
substantially lower than that for non-Indigenous students, and is cause for
major concern. In Reading, for example, the difference in the means across
Australia is 74 points, the difference in the Northern Territory is 145 points
and in Western Australia it is 83 points.[37]
3.69
In addition to student attainment, student attendance levels are another
area of interest to the committee for comparison across the states and
territories. The MCEETYA National Report on Schooling in Australia 2007
outlined the data on comparable school attendance across the jurisdictions for
full time students in Years 1-10. The report noted that school attendance was 'a
new performance measure and currently student attendance data is not collected
uniformly across jurisdictions and schooling sectors'.[38]
The report also noted that:
...due to variance in the systems in place for collecting
student attendance data across the sectors and jurisdictions it is not yet
possible to collect the data consistently across Australia in all
jurisdictions/sectors.[39]
3.70
Figure 12 over the page depicts the attendance rates for government
schools but the MCEETYA report did not disaggregate the data by remoteness area
and did not list any source of such disaggregated data in the statistical
annex.
3.71
The committee considers this is a priority area as the COAG National
Indigenous Reform Agreement has identified national, jurisdictional and
geo-locational—the school's geographical location—school attendance rates as
one of the two performance indicators to be used to measure progress against
the Closing the Gap target to 'Halve the gap for Indigenous students in Year 12
attainment or equivalent attainment rates by 2020'.[40]
Figure 12: Student attendance rates in government schools in
2007
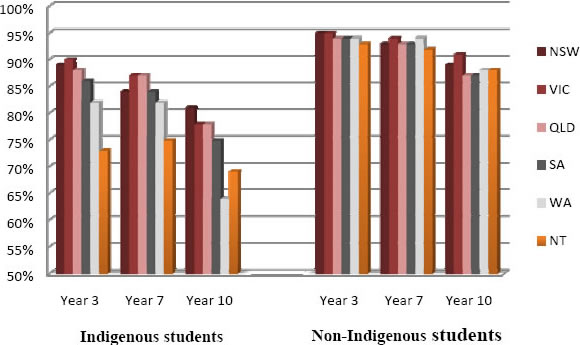
Source: MCEETYA
2009 National Report on Schooling in Australia 2007
3.72
In general, student attendance in Victoria, Tasmania and New South Wales
tended to be higher than the other jurisdictions. The Northern Territory
attendance rates were lower than those of other states for each year level. The
Northern Territory had the lowest levels of attendance in all years for
Indigenous students except in year 10 where Western Australia was slightly
lower at just under 65 per cent compared to the Northern Territory's 68 per
cent. The MCEETYA reported noted that the data indicated that:
...Indigenous students attended school at lower rates than
non-Indigenous students, with the variation in attendance more pronounced in
the later years of schooling. For some States and Territories, there was a
difference of more than ten percentage points in attendance rates between
Indigenous and non-Indigenous students. In the Northern Territory, particularly
from years 6 to 10, the difference was close to 20 percentage points.[41]
3.73
The committee notes that the Northern Territory Department of Education
and Training has published its own school attendance data, which is provide
below in Table 5, but this is not comparable to other jurisdictions. The
committee acknowledges the particular logistical difficulties faced by the
Northern Territory government with a high proportion of its Indigenous
population residing in remote and very remote areas. However the committee is
concerned that this data suggests that very little progress has been made since
2008.
Table 5: School
attendance in the Northern Territory 2008-09
|
|
2008 |
2009 |
|
Geolocation |
Indigenous |
Non-Indigenous |
Total |
Indigenous |
Non-Indigenous |
Total |
|
Provincial |
81.1% |
90.6% |
88.7% |
82.6% |
91.9% |
90.1% |
|
Remote |
81.9% |
92.4% |
87.7% |
82.5% |
92.7% |
88.0% |
|
Very
Remote |
65.7% |
91.0% |
69.1% |
63.5% |
90.1% |
67.0% |
Source:
Northern Territory Department of Education and Training - Enrolments and
attendance 2008-2009
The health of the Indigenous population
3.74
The AIHW report Aboriginal and Torres Strait Islander Health Performance
Framework 2008 report analyses data on the comparative state and territory
government expenditure on health goods and services for Indigenous people. The
report noted that the Northern Territory ($5,461) and South Australia ($4,011)
had the highest average expenditure per person for Indigenous people. As Figure
13 below depicts, the increased expenditure is related to the proportion of the
Indigenous population that reside in remote and very remote areas.
Figure 13: Expenditure ratio on Indigenous health
Source: AIHW
2008
3.75
The committee notes that there is no universally collected primary
healthcare data currently available. At the committee's hearing in Canberra on
9 June 2009 the committee asked the AIHW if there was anything being done to
address this vacuum:
Generally in terms of primary healthcare data it is a
difficult area to get data on. We have, say, seven million hospital separations
a year that we collect data on but a great many more are primary care episodes.
Filtering out and trying to get a useful data collection out of that is an
interesting problem. A few months back we published a report towards primary
healthcare data looking at what existing data there is because there are
various electronic collections that do collect data. It is certainly something
that we are hoping to do further work on. I think the Primary Healthcare
Strategy will be a key document from which data collection will be launched
because that overall policy will be clear about what needs to be collected. It
is really a case of what should be collected. We are doing some work at the
moment with the states and territories on trying to develop a national minimum
dataset, that is the minimum number of standard items that should be collected
in relation to primary healthcare and community health. We are certainly trying
to take it forward.[42]
3.76
In terms of other basic health indicators available, the 2004-05 NATSIHS
collected various data on Indigenous health in regional and remote Indigenous
communities including information on general health, smoking, alcohol
consumption, long term health conditions, oral health, Body Mass Index,
immunisation and women's health issues.
3.77
The committee notes that very little data is currently available about
the patterns and levels of alcohol and drug use by Indigenous people,
especially amongst young Indigenous people. NCETA noted in its submission that
it has undertaken investigation of data that examines the pattern of alcohol
and drug use by school aged children. The study found that
Indigenous students were 1.27 times more likely to have used
any illicit drug in the last year compared to non-Indigenous students (with
age, gender, school type (Government, Catholic, Independent), self-rated
academic performance, alcohol and tobacco use, socio-economic disadvantage, and
language spoken at home controlled for).
The most commonly used illicit drugs among Indigenous students
were cannabis, inhalants, and tranquillisers.[43]
3.78
The NCETA noted that very little of the available data has been
published and is currently preparing documents that report these findings. The
committee looks forward to the release of additional data on the patters of
alcohol and drug use of young people and would also like to see the data
reported by geographical location and on a state and territory level.
Figure 14: Alcohol risk of Indigenous persons aged 18 years
and over, 2004-05
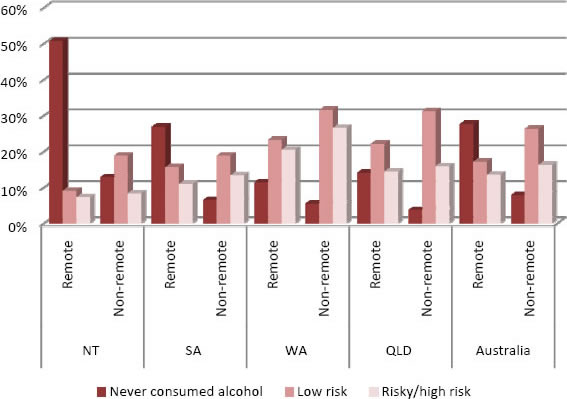
Source: ABS 2004-05
NATSIHS
3.79
Figure 14 above illustrates the alcohol risk of Indigenous people across
states and territories and in both remote and non-remote areas. Of particular
interest is that 50 per cent of Indigenous people in remote areas of the
Northern Territory reported having never consumed alcohol which was far above
any other jurisdictions either remote or non-remote. Overall a higher proportion
of Indigenous people in remote areas had never consumed alcohol than in
non-remote areas across all jurisdictions and there was less reported low risk,
risky and high risk drinking in remote areas as well.
3.80
The committee also notes the data available on Indigenous health workers
and the numbers of medical practitioners. As discussed in Chapter 5, the number
of Aboriginal Health Workers (AHW) has been declining in some states and
territories recently. This is also supported by data analysed by the AIHW which
is illustrated over the page in Figure 15. As the graph shows, from 2001–2006
the number of male AHWs increased in New South Wales, Victoria and Queensland
but decreased in the Northern Territory and Western Australia. For female AHWs,
numbers in New South Wales and Queensland increased by over 20 per cent in South
Australia and the Northern Territory, slightly increased in the Northern
Territory and South Australia but decreased in Western Australia.
Figure 15: Male AHWs by state and territory, 1996, 2001 and
2006, Census.
Figure 16: Female AHWs by state and territory, 1996, 2001 and
2006, Census.
Source: AIHW 2009
Aboriginal and Torres Strait Islander health labour force statistics and data
quality assessment.
3.81
In Figure 17 below, apart from New South Wales all remote areas had a
lower reported daily consumption of fruit and vegetables than non-remote areas,
with daily fruit consumption the lowest in remote Western Australia and vegetable
consumption the lowest in the Northern Territory.
Figure 17: Selected dietary habits of Indigenous persons
aged 12 years and over, 2004-05
Source: ABS 2004-05 NATSIHS
Table 6: No. of
psychiatric beds in public acute hospitals with psychiatric units per 100 000 people, 2004-05
|
NSW |
VIC |
QLD |
SA |
WA |
TAS |
NT |
Aust |
|
Inner regional |
12.9 |
11.7 |
22.7 |
0 |
5.8 |
20.1 |
N/A |
14.4 |
|
Outer regional |
0.4 |
4.7 |
16.4 |
0 |
14.7 |
0 |
23.8 |
9.3 |
|
Remote |
0 |
0 |
0 |
0 |
0 |
0 |
6.6 |
1.2 |
|
Total all regions (including
major cities) |
13.3 |
18.1 |
23.4 |
11.2 |
20.9 |
17.8 |
16.0 |
17.2 |
Source:
AIHW (2007) Mental health services in Australia 2004-05
3.82
In terms of mental health, the AIHW released a comprehensive report on mental
health services in Australia in April 2007. The aim of the report was to
provide information on a wide range of mental health-related services provided
in Australia, as well as the resources associated with those services. Although
the report is not Indigenous-specific it does provide information on mental
health facilities available by remoteness area as Table 6 above illustrates.
Only the Northern Territory has public psychiatric beds available in remote
areas and it also has the most available per 100 000 people in outer regional
areas. The committee was surprised to note that South Australia has no beds
available in outer regional or remote areas.
Employment
3.83
The ABS 2002 NATSISS also collected data on the size of the Indigenous
labour force and the difficulties Indigenous people have finding employment.
Figure 18 below outlines the percentage of Indigenous people not in the labour
force by state and territory and remoteness. Remote areas of the Northern
Territory recorded the highest percentages, just on 50 per cent, followed by
the remote areas of New South Wales and the non-remote areas of Western
Australia and South Australia respectively. In Queensland, South Australia and
Western Australia the percentage of Indigenous people not in the labour force
was greater, even if only slightly, in non-remote areas than in remote areas.
Figure
18: Percentage of Indigenous persons aged 15 years or over not in the labour
force, 2002
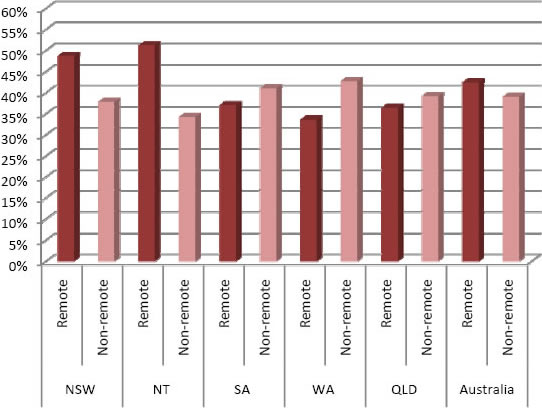
Source: ABS 2002 NATSISS
3.84
Figure 19 over the page illustrates that over 80 per cent of unemployed
Indigenous people in remote areas find it difficult to find work, rising to
over 90 per cent in New South Wales where the most common barrier to finding
work is that there are no jobs at all. However in the Northern Territory and
Western Australia the greatest barrier is insufficient education, training or
skills to find a job and this reason is second only to no jobs in local area or
line of work in Queensland.
3.85
NCETA notes in its submission that:
Employment status and employment opportunities are key
factors in the health and wellbeing of individuals and the communities in which
they live. Employment status and opportunities are also heavily implicated in
the risk of problematic alcohol and other drug use. So, from a prevention perspective,
the need to ensure that adequate employment options exist is of fundamental importance.[44]
Figure 19: Main difficulty finding work for unemployed
Indigenous persons aged 15 years or over in remote areas, 2002
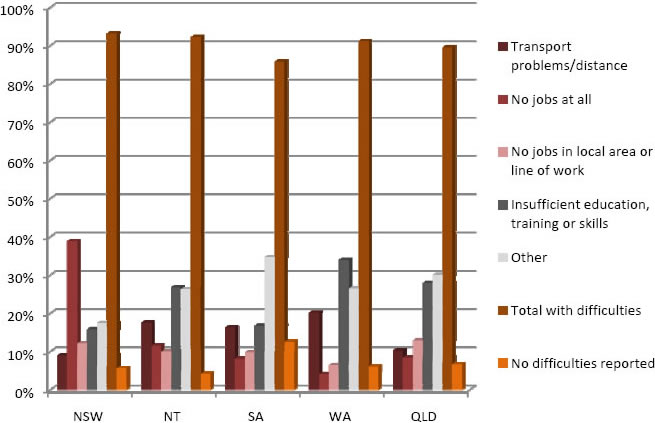
Source:
ABS 2002 NATSISS
3.86
Figure 20 over the page outlines the percentage of the total Indigenous
population in remote and non-remote areas for which government pensions and
allowances have been the main source of income. The majority of Indigenous
people have been on government pensions and allowances for more than two years
with a higher percentage of Indigenous people in Western Australia and
Queensland in non-remote areas on government pensions and allowances than in
remote areas. In remote areas in the Northern Territory and South Australia
fewer than 5 per cent have been on government pensions and allowances for less
than one year whereas in New South Wales is more than double that number at
13.5 per cent. Also of interest is that overall the Northern Territory has a
smaller percentage of Indigenous people in remote and non-remote areas on government
pensions and allowances than New South Wales.
Figure 20: Times
that government pensions and allowances have been the main source of income in the
last 2 years for Indigenous people aged 15 years and over, 2002
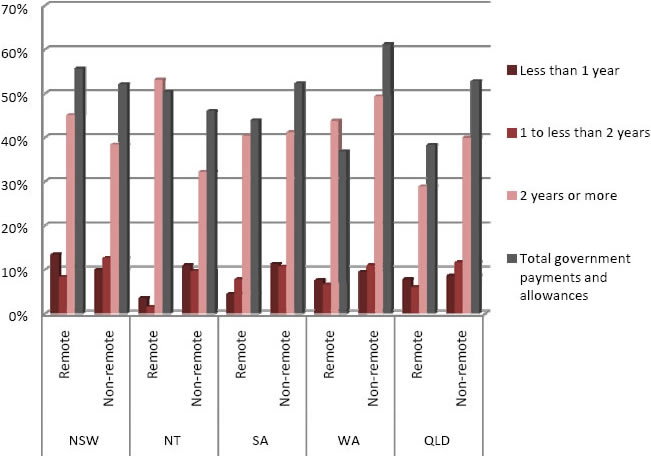
Source:
ABS 2002 NATSISS
Welfare and security of children and young people
3.87
The committee is unable to compare data on juvenile justice and child
protection across states and territories in regional and remote areas. This is
because, as the AIHW noted in its submission, :
...data on young people in juvenile justice facilities or under
juvenile justice supervision can be disaggregated by state and territories but
cannot be disaggregated by geographical location. The same is the case for
children in the child protection system where the child protection data set
does not allow for the reporting of the data by region or remoteness.[45]
3.88
The committee was particularly concerned with the limited data available
in this area given that at the time of arrest and incarceration details on
where the offence was committed and where the person resided would be recorded.
The committee is also concerned with the lack of detailed data in this area
given that juvenile detention rates are one of the 12 Headline Indicators for
the Productivity Commission's annual Overcoming Indigenous Disadvantage report.[46]
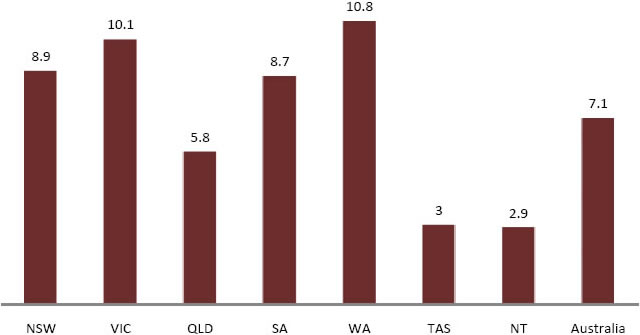
3.89
Although geographical regions within jurisdictions cannot be compared,
the more general differences between states and territories can. The AIHW
report on Juvenile justice in Australia 2006-07 identifies that while
rates of juvenile justice supervision:
...for non-Indigenous young people were similar across all
states and territories, there was considerable variation in the rates for
Aboriginal and Torres Strait Islander young people. Western Australia had the
highest Indigenous rate, with around 80 per 1,000 Indigenous young people under
supervision, followed by South Australia with 50 per 1,000...the Northern
Territory, Tasmania and Victoria had the lowest rates, which ranged from 20 to
26 per 1,000.[47]
3.90
The report also notes that both Western Australia and Tasmania have had
large increases in the rate of Indigenous people under supervision. In Western
Australia, the rate of Indigenous young people under juvenile justice
supervision:
...increased from 70 per 1,000 in 2003–04 to 80 per 1,000 in
2006–07...In contrast, the Indigenous rate decreased in South Australia from 62
to 50 per 1,000.[48]
3.91
The report outlines the average daily number of young people in
detention by Indigenous status in each state and territory. On a daily average
almost 90 percent of young people in detention in the Northern Territory are
Indigenous followed by Western Australia with just over 70 per cent. It is also
clearly evident that a further disaggregation of this data into remoteness
areas would provide valuable information and allow better comparison between
states with large urban populations and those with relatively large remote
populations.
Table 7: Average
daily number of young people in detention 2006-07
|
NSW |
QLD |
WA |
SA |
NT |
Aust |
|
Indigenous |
184 |
91 |
83 |
21 |
26 |
443 |
|
Total all young
people |
386 |
145 |
117 |
52 |
29 |
941 |
|
% that are
Indigenous |
48% |
63% |
71% |
40% |
90% |
47% |
Source: AIHW 2008
3.92
The committee's research has shown that there are similar problems with
data collections related to child protection. The most recent Overcoming
Indigenous Disadvantage report noted that existing data collections needed to
be developed to:
...better reflect the underlying extent of child protection
issues that are not necessarily apparent from administrative data on substantiations,
notifications and orders.[49]
3.93
Figure 21 below illustrates the number of Indigenous children on care
and protection orders in each state and territory, which differs greatly. It
should also be noted that even though the Northern Territory has a low ratio it
does not necessarily give a complete picture as it may also indicate a lack of
services in remote and very remote areas where a substantial proportion of the
Indigenous population reside.
Figure 21: Ratio of Indigenous to non-Indigenous children on
care and protection orders, July 2007
Source: AIHW 2008
3.94
The AIHW's report Child protection Australia 2006–07 also lists
the type of abuse or neglect that is reported by state and territory. There are
many notable differences, for example in Western Australia, 50 per cent of the
notifications are for neglect while in Queensland it is 33 per cent and in
Victoria it is 19 per cent. In addition South Australia only has 2.7 per cent
of notifications for sexual abuse while Western Australia has 12.5 and the
Northern Territory has almost 10 per cent. The Northern Territory and Victoria
have by far the highest notifications for physical abuse with just over 30 per
cent with the next closest at 22 per cent.
3.95
The comparisons with non-Indigenous children are also interesting as
although Indigenous children across all jurisdictions have a higher percentage
of notifications for neglect and for emotional abuse, excluding Queensland,
while non-Indigenous children, with the exception of the ACT and Tasmania (for
which the data should be interpreted with caution due to the small number of
Indigenous children), have a higher percentage of notifications for sexual and
physical abuse. It also must be noted that there may be substantial
under-reporting of child abuse across all jurisdictions.
Figure 22: Percentage of children aged 0-17 years who were the subject of
substantiated notifications: type
of abuse or neglect, by Indigenous status and state/territory, 2006-07
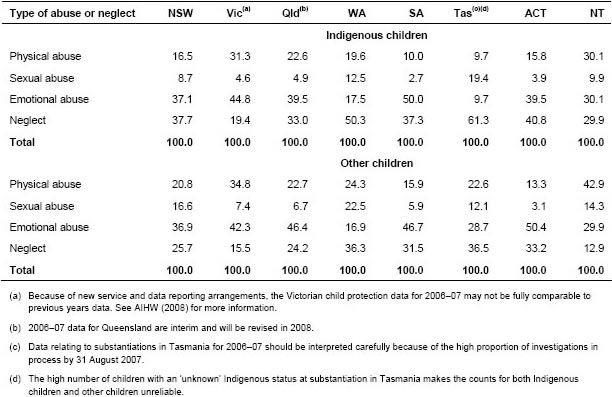
Source: AIHW 2008
3.96
The committee notes that the Australian Institute of Family Studies, in
its submission, outlined that:
A simple examination of the statistics showing an
over-representation of Indigenous children and young people in the child
protection and out-of-home care systems does not answer why this occurs. Such
correlational data need to be examined in detail to see whether there is
something inherent in Indigenous populations, in the policies and procedures of
authorities (such as overt or covert racism, which may mean that problems in
Indigenous families are more likely to be observed and come to the attention of
authorities), or whether such overrepresentation can be explained by some other
underlying causes (e.g., socio-economic disadvantage).[50]
Conclusions from the data
3.97
Throughout the broad examination of some basic data on areas related to
the terms of reference for the committee's inquiry, such as health, welfare,
wellbeing, child protection and employment, what becomes obvious is the great
difference between the status and wellbeing of Indigenous people across the
country. It also provides some additional quantitative evidence to substantiate
the constant pleas the committee receives from witnesses that there can be no
one-size-fits-all solution as there is no one consistent problem across jurisdictions
or communities.[51]
This was also acknowledged recently by the Commonwealth Minister for Families,
Housing, Community Services and Indigenous Affairs in an address to the
National Press Club:
The Government realises that there is no single solution to
what is a systemic, complex problem. It just doesn't make sense to think that
what works in one remote Indigenous community can be effectively transposed to
another. This has to be tackled community by community, with local input and
ownership.[52]
3.98
Providing an overview of some of the available data also illustrates the
importance of good data collection and analysis for developing policy and
assessing the needs of people who live in particular areas. Using accurate and
relevant data specific to the location of the intended area of implementation
is essential, as situations and needs can vary between remote and very remote
areas as well as in regional areas. The committee notes that more work on
improving data collection that can be disaggregated to regional locations and
by remoteness areas needs to be undertaken.
Navigation: Previous Page | Contents | Next Page