This Flagpost looks at changes in different generation’s first preference votes to the major parties over the past eight House of Representatives elections, based on Australian Election Survey (AES) data.
The AES (run by the Australian National University) has conducted post-election sample surveys after every federal election since 1987. While (the many) pre-election opinion polls capture voter intention, post-election surveys more accurately identify who actually voted for whom.
Methodology and notes are below the final chart (Figure 5).
First preferences by party and generation
As an introduction, Figure 1 shows the AES results to the four groups at the 2022 election by generation. The most noticeable difference is the increased Greens vote with each younger generation, and then the opposite for the Coalition. The ALP’s vote is the most consistent, followed by Other.
Figure 1: First preferences by generation and party, AES survey 2022

Source: Australian Election Study 2022, Australian National University
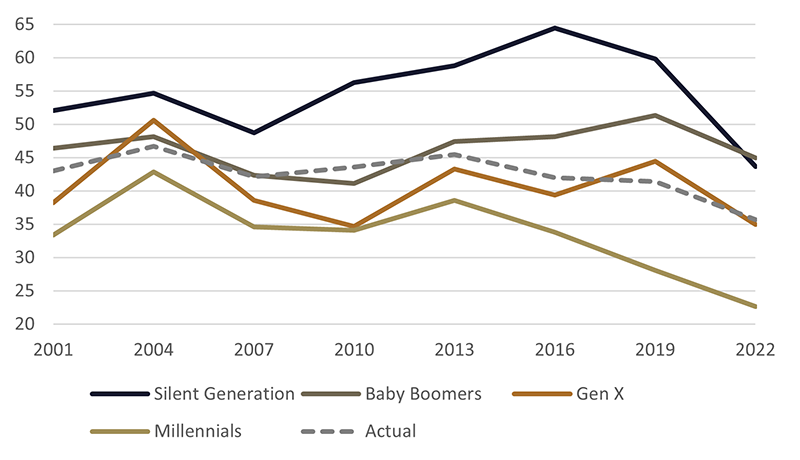
Figure 2 is the Coalition’s first preference percentage for each generation. The Coalition’s vote demonstrates the clearest example of the result changing by age, and it also has the largest spread among the generations. The Silent Generation has most strongly voted for the Coalition, especially from 2010 to 2019, but their vote dropped dramatically in 2022. Baby Boomers are closer to the actual election result (the dotted line in the charts below), with the Millennials’ Coalition vote falling consistently over the past three elections.
Figure 2: First preferences to Coalition by generation, AES surveys 2001 to 2022

Source: Australian Election Studies 2001 to 2022, Australian National University; Australian Electoral Commission Virtual Tally Room
Figure 3 shows first preference results to The Greens, the party with the second-most dispersed result among the generations (note the Y-axis has a much smaller range than in Figure 2). In terms of each generation’s strength of vote, they have the opposite result of the Coalition (higher for younger respondents and lower for older). The erratic results for Millennials in the first half of the chart has an inverse relationship to the ALP’s vote (Figure 4). This may be affected by both the greater variability caused by smaller sample sizes (which in turn creates larger percentage changes) and the close relationship of Green and ALP votes as evidenced by their high preference flows.
The increased Greens vote across all generations in 2022 resulted in their best ever first preference result and three seats in addition to the single one they have held since 2010.
Figure 3: First preferences to The Greens by generation, AES surveys 2001 to 2022

Source: Australian Election Studies 2001 to 2022, Australian National University; Australian Electoral Commission Virtual Tally Room
Figure 4 shows little variation among the generations for the ALP, other than the lower Silent Generation result. The last two elections show the AES results for all generations trending upwards contrary to the actual overall result of a slight decrease. Interesting is the re-convergence of the generations in 2022.
Figure 4: First preferences to ALP by generation, AES surveys 2001 to 2022

Source: Australian Election Studies 2001 to 2022, Australian National University; Australian Electoral Commission Virtual Tally Room
Figure 5 shows a very close result to ‘Other’ among the generations for all elections. This would be expected as ‘Other’ takes in candidates from across the political spectrum. Note that ‘Other’ has the fewest first preference votes in the AES which means a few votes can cause relatively large changes in percentages. The dotted line for ‘Actual’ clearly shows the shift away from major parties over the past several elections. There would have been another high in 1998 when One Nation ran federally for the first time so 2001 and 2004 reflect the decreasing vote to One Nation in those two subsequent elections.
Figure 5: First preferences to Other by generation, AES surveys 2001 to 2022

Source: Australian Election Studies 2001 to 2022, Australian National University; Australian Electoral Commission Virtual Tally Room
Methodology and notes
Only respondents who gave valid answers to both their first preference in the House of Representatives and their year of birth are included. Valid responses number:
- 2001 = 1,856
- 2004 = 1,513
- 2007 = 1,657
- 2010 = 2,040
- 2013 = 3,778
- 2016 = 2,428
- 2019 = 2,038
- 2022 = 2,195
Year of birth was grouped into common Western demographic generations as per the Pew Research Centre:
- Silent Generation: up to 1945
- Baby Boomers: 1946 to 1964
- Generation X: 1965 to 1980
- Millennials: 1981 to 1996
Note that:
- each line is the percentage of first preferences by that generation at each election
- each generation is the same cohort ageing three years between elections
- Generation Z (1997 to 2012) have been excluded as they do not appear in the data before 2016 and are very low in numbers from 2016.
These generations were cross-tabulated with respondents’ first preference votes to the following four groups: Liberal Party and/or Nationals as ‘Coalition’, the Australian Labor Party, The Australian Greens and all remaining parties and candidates — ‘Other’.