The Australian Taxation Office (ATO) has released new data on the Higher Education Loan Program (HELP, formerly HECS) debts, covering the 2020–21 financial year.
This article summarises the ATO HELP data. Previous versions were published for the 2019–20 financial year release, 2018–19 financial year release, 2017–18 financial year release, and the 2016–17 financial year release.
All figures are at 30 June for the relevant financial year. Figures have not been adjusted for inflation.
Total amount of outstanding HELP debt
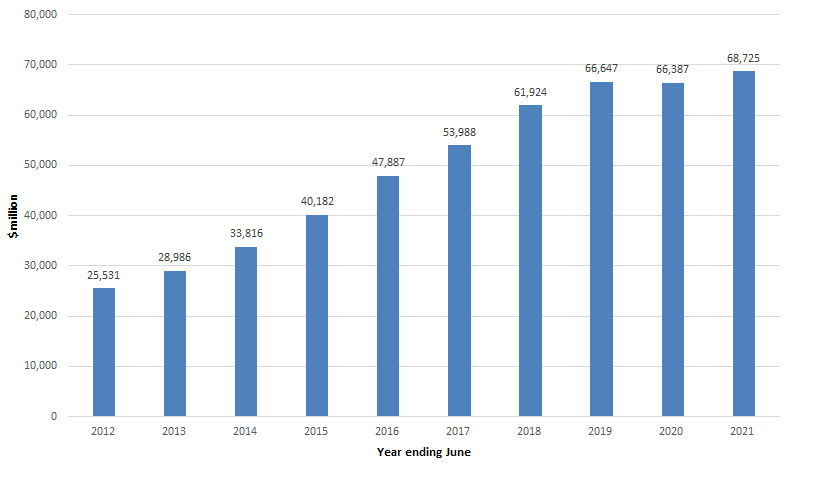
In 2020–21, outstanding HELP debt rose to just over $68.7 billion, up from $66.4 billion in 2019–20 (Figure 1).
The change in the outstanding balance from 2019–20 to 2020–21 reflects the combination of $6.3 billion of new debt and $0.3 billion additional indexation costs incurred by borrowers, as well as a total of approximately $4.3 billion of compulsory and voluntary repayments by people living in Australia and overseas (see Table 1 of the ATO data). Relatively small amounts for debts written off and bonuses on voluntary repayments are also deducted from the total amount of debt outstanding each year.
Since 2019–20, income contingent loans for vocational education and training (VET) students have not been included in the ATO HELP data. This means the data up to 2018–19 is not strictly comparable to the last two years, as it includes loans under the former VET FEE-HELP and current VET Student Loans Schemes.
Figure 1: total amount of outstanding HELP debt 2011–12 to 2020–21 financial years ($m)

Source: ATO, HELP statistics 2020–21, (Canberra: ATO, 2021), Table 5.
The Australian Government Actuary estimates that of new debt incurred in 2020–21, 15.1 per cent is not expected to be repaid. This is a slight increase on the 14.7 per cent estimate for new loans incurred in 2019–20 (Department of Education, Skills and Employment, Annual Report 2020–21, 49).
Number of people with outstanding HELP debt
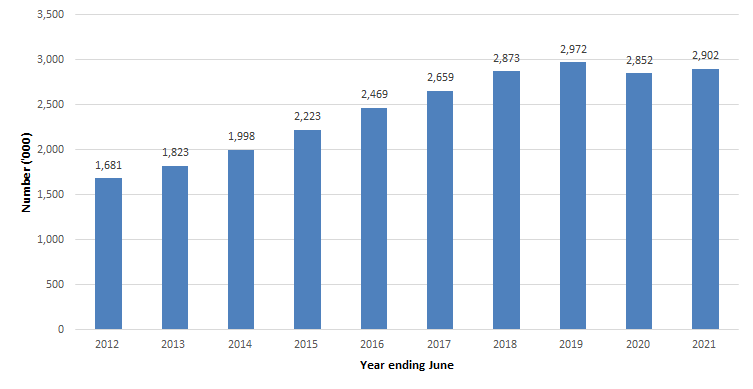
There were 2.9 million people with an outstanding HELP debt in 2020–21 (Figure 2). In percentage terms, this represents a 1.7% increase from 2019–20 (there was a decline in the previous year on year period, which was to be expected due to the change in scope). Since the commencement of HECS in 1989, approximately 2.1 million people have repaid their debt in full, while 18,594 people’s debts have been written off due to death (see Table 2 of the ATO data).
Figure 2: total number of people with outstanding HELP debt 2011–12 to 2020–21 financial years (‘000)

Source: ATO, HELP statistics 2020–21, (Canberra: ATO, 2021), Table 5.
Size of outstanding HELP debts
The average amount of outstanding debt is $23,685, up from $23,280 in 2019–20 (see Table 1).
The number of people with debts above $50,000 has continued to grow, reaching 278,069 (9.6% of all debtors) in 2020–21, up from 256,053 (9.0% of all debtors) in 2019–20. A quarter of people with debts above $50,000 owe more than $100,001. For the first time, the ATO data contains a breakdown of debtors owing more than $100,001, showing the majority (90%) owe between $100,001 and $150,000 (see Table 5 of the ATO data). However, there are also a small number of people with larger debts, including two who owe $400,000 or above. The HELP loan limit, which came into effect on 1 January 2020, now prevents people from incurring HELP debts of this magnitude. The 2021 limit is $108,232, or $155,448 for students studying medicine, dentistry and veterinary science courses leading to initial registration, or eligible aviation courses.
Table 1: average debt and number of people with outstanding HELP debt by size of outstanding balance 2011–12 to 2020–21 financial years
|
2012 |
2013 |
2014 |
2015 |
2016 |
2017 |
2018 |
2019 |
2020 |
2021 |
| Average debt |
$15,191 |
$15,898 |
$16,925 |
$18,075 |
$19,396 |
$20,303 |
$21,557 |
$22,425 |
$23,280 |
$23,685 |
| Up to $10,000 |
723,714 |
768,048 |
799,772 |
827,484 |
851,313 |
893,574 |
910,732 |
910,821 |
841,645 |
852,358 |
| $10,000.01 to $12,000 |
117,981 |
120,642 |
119,501 |
129,860 |
136,734 |
139,944 |
149,823 |
155,742 |
146,131 |
147,408 |
| $12,000.01 to $14,000 |
103,094 |
104,464 |
119,592 |
129,003 |
142,151 |
141,177 |
153,444 |
152,355 |
137,501 |
140,168 |
| $14,000.01 to $16,000 |
99,648 |
104,059 |
109,580 |
116,075 |
124,820 |
129,834 |
138,964 |
140,701 |
129,823 |
128,139 |
| $16,000.01 to $18,000 |
94,334 |
104,921 |
110,775 |
121,207 |
122,157 |
124,045 |
131,439 |
133,832 |
123,403 |
121,569 |
| $18,000.01 to $20,000 |
80,624 |
90,900 |
106,938 |
123,654 |
139,835 |
144,259 |
133,292 |
130,733 |
135,020 |
126,612 |
| $20,000.01 to $30,000 |
269,787 |
296,244 |
338,949 |
403,064 |
473,584 |
509,360 |
548,229 |
563,779 |
544,486 |
549,429 |
| $30,000.01 to $40,000 |
114,051 |
131,384 |
157,758 |
195,492 |
242,240 |
281,594 |
328,753 |
350,824 |
347,708 |
359,132 |
| $40,000.01 to $50,000 |
42,338 |
53,877 |
67,468 |
84,863 |
110,455 |
135,795 |
169,781 |
189,044 |
189,955 |
198,723 |
| $50,000.01 to $60,000 |
17,444 |
23,705 |
32,258 |
43,096 |
56,919 |
70,265 |
87,380 |
99,389 |
102,829 |
109,483 |
| $60,000.01 to $70,000 |
7,322 |
10,589 |
15,002 |
21,035 |
29,235 |
37,363 |
50,425 |
58,675 |
60,708 |
65,825 |
| $70,000.01 to $80,000 |
3,507 |
5,009 |
7,433 |
10,629 |
15,164 |
19,996 |
27,393 |
33,374 |
35,273 |
38,890 |
| $80,000.01 to $90,000 |
2,126 |
2,943 |
4,147 |
5,827 |
8,120 |
10,809 |
14,850 |
18,772 |
20,400 |
22,767 |
| $90,000.01 to $100,000 |
1,391 |
1,851 |
2,527 |
3,563 |
5,216 |
6,996 |
9,369 |
11,477 |
12,299 |
13,866 |
| $100,000.01 and above |
3,339 |
4,652 |
6,273 |
8,189 |
10,996 |
14,046 |
18,729 |
22,514 |
24,544 |
27,238 |
Note: amounts of debt up to $10,000 have been aggregated for Table 1—more detail is available in the source tables from the ATO.
Source: ATO, HELP statistics 2020–21, (Canberra: ATO, 2021), Table 5; Parliamentary Library estimates.
The time taken to repay HELP debts has also been rising, reaching an average of 9.4 years in 2020–21, up from 9.3 years in 2019–20 (see Table 3 of the ATO data). In 2020–21, the average time to repay was more than a year longer than it was in 2011–12, when the average HELP balance was $15,191, and took on average 8.2 years to repay.
Further information and analysis
The Department of Education, Skills and Employment (DESE) has published some additional analysis of HELP data in the HELP debt and repayments report 2018–19. This report provides some details not available in the ATO release, such as debt incurred by year, field of education, and socioeconomic status. Totals in the DESE publication may differ from those in the ATO data due to differences in reporting times and parameters.