Australia's regional centres
Introduction
3.1
This chapter provides a snapshot of regional capitals across Australia in
terms of assessing demographic trends, challenges and opportunities, while
exploring the impact of a changing environment on regional capitals.
Consideration is also given to the strategic importance of regional capitals to
their local communities and Australia more generally.
Development of regional capitals in Australia
Trends in regional centres
3.2
Population in Australia has increased in cities and regional centres and
declined in small rural inland towns.[1]
Four key trends occurred between 1911 and 2006 in Australia:
-
the settlement of Northern Australia;
-
the growth of coastal towns and cities;
-
the emergence of larger centres; and
-
the disappearance of many smaller towns.[2]
3.3
The graph overleaf illustrates these trends, described by the Department
of Infrastructure and Regional Development (the department) in the following
terms:
The blue area, which represents the size and distribution of
the 1911 regional population, shows that at the beginning of the century the
Australian population living outside the capital cities was spread among a
large number of relatively small towns. In 1911, some 40 percent of this
regional population lived in towns of between 200 and 1000 people. The green
area, which represents the size and distribution of the 2006 population living
outside the major capital cities, shows the reversal of this pattern, with a
clear shift in the regional population to larger centres.[3]
3.4
The growth of regional capitals can be attributed to a range of factors,
including reduction in the cost of communications and transport and new
technologies in agriculture.[4]
Rather than an urbanisation trend of people movement to capital cities, since
the 1970s, Australians have been moving to regional cities and towns. The
Regional Australia Institute explained that as a consequence of this trend:
There are now 4½ million people living in regional cities
around Australia, which is a population of the same size as Sydney and
Melbourne. If you include a broader suite of small places, which this inquiry
does, then you go beyond that up towards five million people.[5]
3.5
Yet despite this reality, most urban policy discussions focus on capital
cities. A large number of submitters to the inquiry called for a change in
focus, away from capital cities and towards regional cities.[6]
Mr Jack Archer, Chief Executive Officer, Regional Australia Institute, stated
that government policy should 'shy away from big grand national sweeps' and
instead seek to 'understand the development pathways for different places and
support those and support locals to pursue them'.[7]
Strategic importance of regional capitals
3.6
Regional capitals perform an important strategic function in their local
communities. RCA reports that regional capitals contribute 15 per cent of
Australia's Gross Regional Product and hold a labour force of more than 2
million people. Further, 40 per cent of Australia's exports are produced in
regional Australia, and much of this output passes through regional capitals.[8]
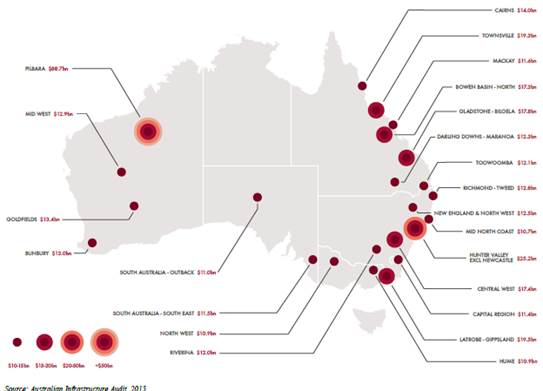
Infrastructure Australia projected gross regional product for major regional
centres in 2031, as illustrated below.[9]
In some regions such as the Pilbara and Gladstone the private sector has funded
the bulk of the infrastructure. However in most regions government investment
in economic infrastructure is required.
3.7
Regional capitals also offer a number of non-economic benefits. RCA
submits that these benefits include:
-
a good alternative to congested and sprawling urban capital
cities;
-
a substantial base infrastructure that can be developed, as
required;
-
faster freight access to south east Asian countries (in northern
Australia, compared to east coast capital cities);
-
affordable house prices at 20-30 per cent lower than state
capital land prices;
-
land available for business and residential development;
-
a model for efficient and sustainable growth; and
-
diversification of the national economy.[10]
3.8
These claims were substantiated by a number of other submitters to the
inquiry, many of which work to promote the benefits of living in the regions to
residents of capital cities.[11]
3.9
A primary case in point was that of Evocities. Evocities is a successful
regional marketing campaign that was established to attract new residents to
inland NSW. Seven councils are members of the campaign: Albury, Armidale,
Bathurst, Dubbo, Orange, Tamworth and Wagga Wagga. A key tool is the Evocities
website, alongside a job search website and investment website for small
businesses.[12]
Evocities reports that 2300 families from Sydney have relocated to its regional
capitals since the campaign commenced.[13]
Evocities is funded by mixed sources, including $2.4 million from councils,
$230,000 from the NSW state government, $1.7 million from the federal
government and corporate sponsorship of $360,000. Government funding ceased in
2011-2012 and now the member councils provide most of the funds. [14]
Challenges facing regional capitals
3.10
Despite the many advantages of regional capitals, each has its own
challenges. ABS research indicated that of the 55 Regional Development
Australia Committee regions surveyed, all identified at least one threat to
their economy. For the majority, reliance on a small number of
concentrated industries was the greatest concern. Under such circumstances, and
without diversification, the prospect of industry failure or even downsizing
would have serious repercussions on local communities.[15]
This section considers a range of challenges facing regional capitals across
Australia.
Ageing population
3.11
Some regional capitals, particularly those on the coast, have ageing
populations. RCA reported that 70 per cent of regional capitals have a senior
dependency ratio of 21.2 per cent. Indeed, for some regional capitals this rate
is higher than 30 per cent. This means that for every 10 people of working age
(15 to 64 years), another three are over 65 years of age. However, as the
examples below illustrate, it is not just coastal regional centres that are
experiencing this trend.[16]
3.12
Byron Shire Council reported two key trends in its population. First, a
growing aged population and second, a significant out-migration of persons in
the 19–35 years age group as young people seek jobs and higher education
opportunities elsewhere. This trend is particularly apparent in the smaller
towns in the Byron Shire such as Mullumbimby. At the same time, the largest
population growth is occurring in those over 59 years of age.[17]
The City of Launceston reported similar trends.[18]
The WA Local Government Association reported that Broome, Busselton, Esperance,
Karratha and Northam have each experienced population growth amongst those over
65 years of age that exceeds the state average.[19]
3.13
An ageing population presents a number of challenges for regional
centres, including lower productivity, increased health costs, and less return
on land rates.[20]
For example, as the cohort aged over 65 increases, the number of people who can
claim a rate reduction under the Local Government Act 1993 (NSW) will
increase, and in turn reduce the revenue of NSW local governments.[21]
3.14
Aging populations, combined with a low skilled youth cohort, can also
create skill shortages. Mr Mike Brindley, Regional Development Australia
Tasmania identified the dairy industry in Tasmania as an example where there is:
...a profound lack of suitably qualified or job-ready young
people wanting to enter into the industry. I notice a lot of people have been
sourced from the mainland and from overseas to help in the dairy industry
expansion. That has been one area where it has been critical to seek young
people to work on farms, as we have an older generation exiting that industry.
The main thing we are hearing is job-readiness, reliability and punctuality,
and a willingness to work long hours is quite a significant inhibitor.[22]
3.15
Yet not all regional centres are experiencing an ageing population. For
example, Wagga Wagga attributes its larger percentage of persons aged 20-24
compared to the national average to its facilities (including universities and
two defence bases).[23]
Higher unemployment rates
3.16
A number of regional capitals reported higher unemployment rates than
capitals cities, particularly youth unemployment.[24]
The Hunter region, NSW, reported a high level of youth unemployment in
particular.[25]
Northern Tasmania's unemployment rate is 8.2 per cent, higher than both the
Tasmanian rate of 6.6 per cent and the Australian rate of 6.3 per cent.[26]
3.17
Higher rates of unemployment are not the experience of all regional
centres. For example, the City of Karratha had an unemployment rate of only 2.2
per cent in the 2011 Census.[27]
Wagga Wagga had a relatively low unemployment rate of 4.9 per cent in
September 2011.[28]
Other regional centres, such as Lismore, reported a higher than average
unemployment rate that has been progressively falling in the past decade.[29]
Lower productivity compared to the
national average
3.18
RCA describes productivity as a measure of:
...how efficiently people combine resources to produce goods
and services. Productivity can be measured as goods and services produced per
hour worked, per worker employed or per combination of labour inputs and
capital inputs (this is known as multifactor productivity).[30]
3.19
Regional capitals generally have lower productivity rates compared to
the national average. Productivity was less than the Australian average for 33
of 50 regional capitals (and for a third of these, productivity fell during a
three year period).[31]
Nevertheless, some regional capitals reported high productivity. The City of
Karratha produces the sixth largest economic output of all Australian
municipalities and worker productivity is greater than 6 times the national
figure.[32]
3.20
RCA referred the committee to drivers of population, participation and
productivity that would increase the strategic importance of regional capitals
and increase national output:
- Effective
cross-sectorial and intergovernmental partnerships and integrated regional
planning
- Human
capital, particularly education and skills
- Economic,
environmental and socially sustainable communities and population growth
- Access
to international, national and regional markets
- Comparative
advantage and business competitiveness.[33]
High school graduation and tertiary
entrance rates
3.21
Regional capitals tend to have lower year 12 completion rates and their tertiary
entrance rates are lower than the national average.[34]
RCA provided the following graph to illustrate the difference between
educational attainment and job type in regional capitals and across Australia.[35]
3.22
The City of Greater Shepparton reported high youth unemployment and only
32.9 per cent of residents completing year 12, while only 10 per cent
continued to higher education.[36]
The city attributed these rates to lack of aspiration, poor public transport
and limited education options. Albury Wodonga Councils reported a lower level
of year 12 attainment than the national average. As a consequence many of its
residents 'lack basic employability skills, even for lower skilled vacancies
and entry level positions such as apprenticeships and traineeships'.[37]
3.23
Low educational attainment can impact the labour participation rate and
hamper the ability of regional capitals to attract highly skilled workers. The
Regional Universities Network noted that these low rates of education
attainment in regional areas are particularly problematic as most employment
growth in Australia occurs in highly skilled jobs. For these reasons, education
participation rates must increase to 'address a long standing equity issue,
meet the needs of the future workforce, and enable regional industries to
diversify and grow'.[38]
Social infrastructure and support
3.24
Some regional capitals, and the towns surrounding them, accommodate some
of the most entrenched disadvantaged communities in Australia.[39]
The well regarded Dropping off the Edge report documented persistent
communal disadvantage in Australia, much of which exists outside of Australia's
capital cities.[40]
Ms Elizabeth de Chastel, Catholic Social Services Australia
(CSSA), told the committee during the Canberra hearing that:
Long-term unemployment is a common factor in these
disadvantaged communities as well as associated indicators such as criminal
convictions, poor access to internet, domestic violence and lack of
qualifications. The research findings also show that the indicators of disadvantage
were different in each community as well.[41]
3.25
Wagga Wagga reported relatively high levels of social disadvantage and
high levels of welfare dependency.[42]
A range of initiatives are required to address the needs of these populations,
including ensuring a mix of social housing throughout the community, support
for youth focused activities and ensuring that funding programs are
coordinated.[43]
3.26
CSSA asked people in local communities for feedback on government
funding. Recurrent themes in the feedback included a perception that funding
often was not targeted to meet the needs of the local community, services were
often poorly coordinated, there was competition between service providers for
funding, and often no long term strategy for supporting the community.[44]
3.27
Sister Mary Ryan, Director of Centacare Family Services, reminded the committee
that economic development of regional capitals like Geraldton is not always
accompanied by social benefits for the community. She suggested that 'the
ordinary person in the street – not just Aboriginal people – has not gained
anything at all' from the rise in prosperity in the city of Geraldton.[45]
Higher costs associated with
dealing with extreme weather events
3.28
Costs associated with dealing with the impact of drought and other
extreme weather events are often higher in regional capitals.[46]
Charles Sturt University (CSU) submitted that 'Australia's changing environment
has had, and will continue to have a major impact and effect on regional
capitals'.[47]
Given its role as a leading university in agricultural research, the CSU has
been closely involved in addressing the 'devastating effects of prolonged
drought, as well as subsequent flooding and other associated natural
catastrophes'.[48]
CSU described the impact in the following terms:
These events continue to cause substantial economic pain, and
community suffering across regional capitals in Australia, where previous
fertile and productive land increasingly yields fewer and less predictable crop
cycles, and is unable to sustain levels of livestock previously relied upon to
support families and communities. Similarly, the changing timing of climatic
temperatures and seasons has had a major impact on crop cycles, not only with traditional
agricultural crops, but also in the production of grapes for wine, and other
important growth sectors for regional economies. Moreover, such changes to
water availability also pose a significant threat to the viability of growing
regional capitals, and require investment in significant infrastructure.[49]
3.29
For these reasons, CSU called for continuing investment in environmental
research to address these challanges and to 'develop solutions that secure the
future of Australia's regional capitals and industries'.[50]
3.30
Many regional centres have incorporated climate change to their region's
strategic plans. For example, the City of Ballarat observed that 'climate
change is likely to impact on the Ballarat community over the coming decade'.
The impacts include:
...expected changes in the intensity and frequency of extreme
weather events, changes to the water cycle affecting agriculture and other key
industries, and concerns about the ongoing threat of natural disasters such as
bushfires and floods. In terms of a growing population, the impact of such changes
can have increasingly significant impacts.[51]
3.31
The City of Ballarat has ensured that its response to these threats is
embedded in all parts of the Ballarat Strategy: both to minimise the city's
contribution to climate change in terms of greenhouse gas emissions, but also
to build resilience to climate change. These measures include policy responses
to prepare for both flooding and drought, and, as a consequence, continued
focus on the conservation of water.[52]
3.32
The Tasmanian Government commissioned the Antarctic Climate and
Ecosystems Cooperative Research Centre to conduct climate change modelling.
Climate profiles were created for each local government area and a range of
scenarios were detailed. As a consequence of this planning there have been
policy responses across all areas of government.[53]
3.33
The Coffs Harbour City Council noted that there are significant costs
associated with maintaining a coastal port in the face of increased extreme
weather events, describing it as an expensive infrastructure exercise:
...with nearly $3 million spent recently to remedy slipway contamination,
and nearly $4 million to conduct extensive hydrology and feasibility studies
into the viability of a boat maintenance facility (that would involve constructing
additional breakwaters). The NSW State Government also recently spent $20
million on refurbishing the southern breakwater, and will spend an additional
$15 million to reinforce the northern breakwater.[54]
3.34
The increase in extreme weather events has had a significant financial
impact on residents and businesses in Townsville. The Townsville City Council
provided evidence to the committee that insurance premiums in Northern
Queensland inhibit investment and increase the costs for businesses and
residents. The table on the following page illustrates the range of premiums
payable for a single level brick house built in 1990 and insured for $350,000.[55]
|
Location
|
Cost ($)
|
|
Brisbane
(Ferny Hills)
|
1 957.16
|
|
Brisbane
(Runcorn)
|
2 197.66
|
|
Mackay
|
3 882.50
|
|
Townsville
(Annandale)
|
4 581.42
|
|
Innisfail
|
5 803.49
|
|
Ingham
|
7 304.52
|
|
Cairns
|
9 190.16
|
|
Weipa
|
10 861.92
|
Range
of premiums payable for a single level brick house built in 1990 and insured
for $350,000.[56]
3.35
The premium attached to insurance for homes in Northern Queensland is
staggering. Townsville City Council noted that some insurers will not insure
properties in this region because the risk of damage due to flood, cyclone or
other natural disaster is deemed too high. Townsville City Council identified a
range of measures to assist residents, including the creation of a Commonwealth
owned insurance agency (similar to one offered in the Northern Territory), the
removal of stamp duty from insurance premiums, the expansion of the role of the
Australian Reinsurance Pool Corporation, or the creation of a National Disaster
Insurance Pool.[57]
3.36
The Queensland government has created a Community Resilience Fund
specifically targeted at improving the resilience of local governments to
natural disasters and has been working with insurance providers and residents
to ensure that homes that are retrofitted to withstand extreme weather events
enjoy lower premiums.[58]
Costs associated with building and
maintaining infrastructure from a low rate base
3.37
Many regional capitals struggle to fund the maintenance of
infrastructure from a low rate base.
3.38
The City of Ballarat reported that 'rate capping' would have a severe
impact on the capacity of local governments to invest in infrastructure to
promote growth. The city described its discretion to increase rates as 'one of
the few options the Council does have to provide funds to maintain existing
infrastructures and service provision, while debt and grant facilities are used
to fund new/growth infrastructures'.[59]
3.39
The City of Launceston submitted that limits of local government
boundaries present significant challenges for the city, arguing that it is
inequitable when 67 000 residents are paying to maintain infrastructure also
enjoyed by 40 000 others in the Greater Launceston area:
One of the significant challenges for Launceston is the
constraints of local government boundaries. That significant numbers of the
residents of the Greater Launceston region reside beyond the Launceston City Council
municipal boundaries places a significant financial burden on the Launceston
ratepayers. Regional facilities such as the Aurora Stadium football and surrounding
sporting precinct, the Launceston Aquatic Centre, Princess Theatre and the
Queen Victoria Museum and Art Gallery, are heavily subsidised by the Launceston
ratepayers.
The Council has engaged in discussions with the State
Government seeking a partnership approach that pursues a fairer funding model
for these major regional facilities that shares the cost.[60]
3.40
Tamworth Regional Council made a similar point, criticising the federal government
for not taking into account the services provided by regional capitals to the
surrounding region:
Federal Funding...is distributed on a range of factors including
population and the relative ―disability of a Council‘s demographic – but
it does not take into account that Regional Centres provide a whole range of
infrastructure, facilities and services to surrounding Councils where their
ratepayers do not make any contribution – for example, sporting fields,
regional playgrounds, swimming pools etc. are all paid for and subsidised by
local ratepayers, but a visitor from a surrounding area does not make any substantial
contribution toward the cost of providing that facility.[61]
3.41
These problems are exacerbated by the fact that large grants from the
federal government for infrastructure are not usually accompanied with funds
for maintenance. For example, the Mayor of Dubbo, Councillor Dickerson, gave
the following example to the committee:
[We] got some money out of the federal government recently
for an athletics facility, which is a fantastic facility—an international-class
athletics facility. It was a $5.7 million build, of which about $3.5 million
came from the federal government—fantastic. In terms of all of our long-term
strategic planning, we put money aside because we know that track will be
replaced in 20 years time. We have to be putting money aside now. That is
costing us money every day, but it is a great facility for Dubbo. So those big
pools of money sometimes are not great from the community.[62]
3.42
A similar observation was made by Councillor Van Styn during the
committee's Geraldton hearing. Federal funding usually is associated with
establishment costs and not the 'operation, maintenance and renewal' of assets.
This presents a 'real problem' for regional capitals.[63]
Limitations on debt financing
3.43
A number of other factors can constrain the ability of regional capitals
to raise capital. Some councils described difficulties that they had
encountered when attempting to raise debt finance.[64]
3.44
In Victoria, all local governments are required to manage debt levels at
a cap of 60 per cent of rates. This can present challenges for regional centres
like Ballarat where most growth must be accommodated in greenfield sites. The
costs associated with this development include capital works and infrastructure
spending to accommodate new residents – who are not yet paying rates.[65]
The City of Ballarat explained in its submission that:
For Ballarat the effective level of the debt it can use to
fund growth and development opportunities is 60% x $74.9m = $44.9m. In terms of
context, in 2014 the City of Ballarat spent $37.4m on developing new /growth
infrastructures, on top of $32.9m in 2013. Ballarat is currently spending
around 83% of its borrowing capacity every year on new infrastructures. This is
not sustainable. To support new infrastructure spending which will benefit
residents over the long term, the City is increasingly required to spend
revenues generated by current residents, creating intergenerational equity
related issues.
The debt the City is able to incur equates to around 1.2
years’ worth of new capital infrastructure spending. The City would be in a
position to increase its spending on new infrastructures if it was able to
access more debt funds and not be subject to the 60% revenue funding cap. With
borrowings of $34.2m, the City can only access an additional $10.7m of
borrowings before it reaches its borrowing limit.
This development, which will generate future rates revenue,
must be funded under the borrowing limit, which is based on current rate
levels. This timing difference is a major impediment to local government, particularly
regional capital growth and development.[66]
Other funding constraints
3.45
Submitters identified a range of other constraints on funding, including
poorly developed funding markets and the high cost of debt capital, and called
for tailored funding and grant models. [67]
During the committee's hearing in Geelong, Mr Schinck, City of Ballarat,
described a range of responses that were necessary to address these
constraints, including funding models that 'relieve the pressure on ratepayers
and government funding'. Examples include:
Those investment streams can come from non-public and private
sector organisations in terms of direct investment, investment in houses,
superannuation funds...[68]
[In relation to variable funding models] This can be
everything from tax incentives for regionally targeted investment, to group
funding models, social capital bonds, partnership funding models, treasury
models—which Regional Cities Victoria has looked at—and even the use of defined
superannuation benefits. [69]
3.46
Funding is discussed in more detail in Chapter 4.
Urgent infrastructure needs
3.47
Nearly all regional capitals that submitted to the inquiry reported
urgent infrastructure needs and observed that finding funding to address these
needs presented a challenge.[70]
Two examples follow.
3.48
Townsville is struggling to meet its future water and energy needs.
During the committee's hearing in Townsville, the committee learned that a
range of solutions were being pursued to address these needs and that applications
for federal and state funding had been submitted. Mr Graeme Bolton
explained the pressing needs of Townsville:
Some of them range from very small amounts like $5 million or
$6 million for a couple of road intersection upgrades which would unlock the
potential for a new abattoir and a new feedlot. The return on investment on
that was that, from our calculations, you would get a return on it within two
years in terms of the throughput and the value of that industry.
They also then go up to something like the Integrated Stadium
and Entertainment Centre. The current facilities for the Cowboys are
significantly under standard, and they are going to have to be upgraded. We are
going to have to do something. They cannot continue on there past couple of
years. That is roughly $270 million for a stadium plus entertainment centre.
Then you are looking at water security. One option is the
Haughton duplication. That is somewhere about $180 million. But there are other
opportunities out there such as the Hell's Gate dam, which would be
significantly higher, but that has the potential to open up new agricultural
areas and new opportunities for other businesses.[71]
3.49
The City of Geraldton has urgent electricity supply needs. The current
132 kilovolt power supply limits the development of the region as a 330
kilovolt electricity supply which is 200km away, has not been extended to
Geraldton due to financial constraints upon the state government. Geraldton
explained the consequences of this limitation:
As a result, any potential industry that will require more
than 1.5MW is required to install back-up generator capacity to continue
operations whilst the power supply is being curtailed by the energy provider.
This creates a significant barrier or disincentive to potential industries that
could provide value added services to the mining industry and important
economic growth. Because of the low 1.5MW threshold, the policy also impacts on
other service industries including retail shopping centres.
In addition to the above, the lack of connectivity to the
330KV transmission lines prevents expansion of renewable energy production
(such as wind farms and solar farms) within the region by preventing access to
markets in the southern part of the state where demand is highest.
Geraldton’s continued economic growth is and will continue to
be thwarted whilst the current power supply arrangements are in place.[72]
Access to communication technology
3.50
RCA reported that variable broadband quality is a particular problem for
regional capitals. In some areas, broadband coverage is good in the city, but
poor in residential areas and for others it is the opposite:
The majority of the regional cities surveyed classified their
current broadband coverage and quality as poor to variable. A smaller group
classified their current broadband coverage as satisfactory to good.[73]
3.51
CSU observed that uneven distribution of communications technology has
the potential to significantly distort regional markets. Some regional capitals
will receive economic benefits and others will find it difficult to compete
without adequate communications infrastructure. This has an impact on
universities and also a range of industries and businesses:
With both the national and global economy increasingly
reliant of a digital presence, and with business increasingly conducted online
and utilising new technologies, the lack of even adequate, let alone state of
the art, communications technology infrastructure applies a major handbrake to
regional capital growth and economic expansion.[74]
3.52
RCA noted that when the National Broadband Network (NBN) was initially
announced it was welcomed as a way to close the economic and social inequity
between residents in regional capitals and those in metropolitan areas.[75]
Further, the NBN was viewed as a key piece of infrastructure to attract and
retain students, residents, industries and businesses. Regional capitals that
were the beneficiaries of an early rollout noted that the results are
excellent. For example, Armidale attributed its recent growth, in part, to the
rollout of fibre to the premises NBN.[76]
Launceston has also benefited from the early roll out.[77]
3.53
However, many regional capitals are concerned that the current policy
decision to reprioritise the delivery timetable and the move from fibre to the
premises to fibre to the node will result in some regional areas waiting longer
for a service. They were concerned that in the end they may obtain a service
that is inferior to that available in metropolitan areas.[78]
3.54
Those that did not yet have the NBN felt the loss keenly and lamented
the government's decision to no longer provide fibre to the premises, but fibre
to the node. Mr Bolton, Townsville City Council, described the difference in
the following terms:
[T]he analogy would be that it would be like creating a new
town and putting the highway through to the middle of town but not putting in
any of the connecting roads or driveways into the houses. You create access to
part of the way but you cannot get that last crucial bit from the main road
through to your front door.[79]
Freeze on indexing for federal
financial assistance grants
3.55
In the 2014–2015 budget the federal government announced a pause in the
indexation of the Local Government Financial Assistance Grants.[80]
All local governments who submitted to the inquiry were highly critical of the
federal government's decision to freeze indexation.
3.56
The City of Greater Geelong submitted that this decision would
disproportionally impact 'high growth regional capitals'.[81]
Albury and Wodonga Councils submitted that the freeze would result in a
significant loss of revenue.[82]
The WA Local Government Association noted that the freeze, combined with
reductions in state government grants, 'may result in rates increases and cuts
to services and will therefore have an adverse impact on communities in
regional capitals and the regions they serve'.[83]
This decision is discussed in more detail in Chapter 4.
Conclusion
3.57
The challenges faced by regional capitals are particular to each region.
Nevertheless some shared challenges have emerged and many of these challenges
also contain opportunities for growth. Regional capitals themselves offered a
range of solutions to the problems identified. Given the federal structure in
Australia, state governments have a crucial role to perform, as do
universities, local councils, local communities and businesses. The next
chapter examines how the federal government is assisting regional centres to
respond to challenges and harness opportunities.
Navigation: Previous Page | Contents | Next Page