Executive summary
- This
paper, a companion to the Key Economic and Social Indicator Dashboard
published by the Parliamentary Library, provides tables and charts for a
broad range of social, demographic and economic indicators across all
Australian states and territories, and compares these with Australian
averages.
- Each
table presents data for the past five financial years to 2023-24, where
available, while each chart plots data for the 2023-24 financial year or
latest available year.
- The
State Statistical Bulletin is published twice per year covering data for
either the previous financial year or calendar year.
Introduction
The purpose of this paper is to
present a range of economic and other statistical indicators for the states and
territories of Australia. To facilitate comparisons, indicators are presented
in relative terms such as growth rates, percentages, or proportions of gross
state product, so comparisons can be made using equivalent measures.
This publication is a companion to the Key
Economic and Social Indicator Dashboard which contains Australia-wide data
only, but on a more frequent basis.
A glossary of social, demographic and economic terms used in
the tables is provided at the end of this publication.
Data Sources
Data sources are listed at the bottom of the page for each
indicator. All data is from an original ABS series unless otherwise indicated
as a trend or seasonally adjusted series.
Historical Data
Longer-term data series for every
table in this paper and for the Parliamentary Library’s companion publication,
the Key
Economic and Social Indicator Dashboard is available. Please contact the
Parliamentary Library if you would like a copy of these historical
spreadsheets.
Chapter 1: Labour Market
1.1 Employment
| |
2019-20 |
2020-21 |
2021-22 |
2022-23 |
2023-24 |
| Number employed (a) – '000 |
| New South Wales |
4 022.2 |
4 026.3 |
4 065.7 |
4 308.6 |
4 404.5 |
| Victoria |
3 352.1 |
3 289.2 |
3 418.7 |
3 565.2 |
3 690.6 |
| Queensland |
2 510.8 |
2 571.9 |
2 703.6 |
2 805.2 |
2 890.3 |
| South Australia |
850.5 |
860.7 |
897.1 |
927.8 |
943.5 |
| Western Australia |
1 369.0 |
1 397.1 |
1 478.5 |
1 525.1 |
1 583.2 |
| Tasmania |
260.2 |
267.7 |
278.3 |
285.3 |
284.1 |
| Northern Territory |
130.5 |
132.0 |
132.2 |
136.0 |
138.0 |
| Australian Capital Territory |
241.0 |
248.1 |
246.8 |
261.0 |
266.1 |
| Australia |
12 736.2 |
12 793.0 |
13 221.0 |
13 814.1 |
14 200.3 |
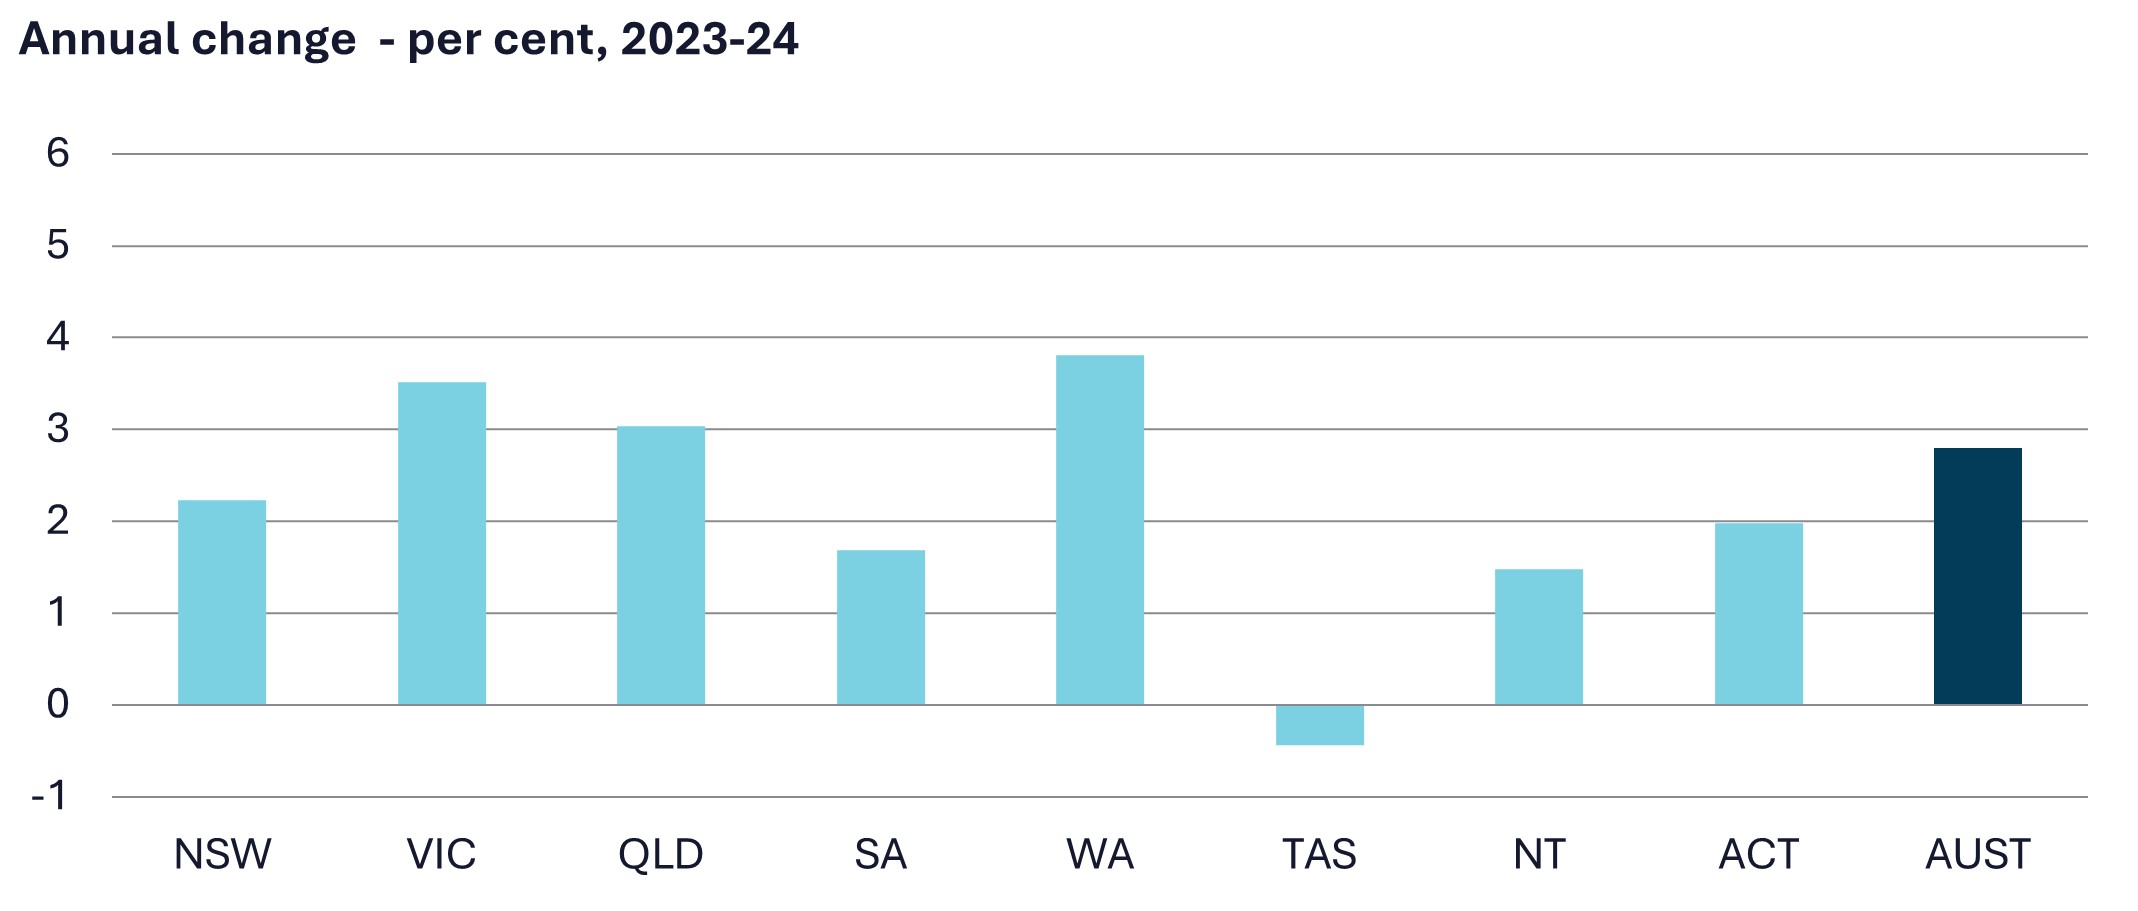
| Annual change – per cent |
| New South Wales |
-0.3 |
0.1 |
1.0 |
6.0 |
2.2 |
| Victoria |
0.9 |
-1.9 |
3.9 |
4.3 |
3.5 |
| Queensland |
0.1 |
2.4 |
5.1 |
3.8 |
3.0 |
| South Australia |
0.0 |
1.2 |
4.2 |
3.4 |
1.7 |
| Western Australia |
0.8 |
2.1 |
5.8 |
3.2 |
3.8 |
| Tasmania |
2.0 |
2.9 |
4.0 |
2.5 |
-0.4 |
| Northern Territory |
-1.2 |
1.2 |
0.2 |
2.8 |
1.5 |
| Australian Capital Territory |
3.4 |
3.0 |
-0.6 |
5.8 |
2.0 |
| Australia |
0.3 |
0.4 |
3.3 |
4.5 |
2.8 |
(a) Total full-time and part-time employed; Annual average of monthly data.
Source: Australian Bureau of Statistics
(August 2024), Labour Force, Australia, Detailed
1.2 Unemployment
| |
2019-20 |
2020-21 |
2021-22 |
2022-23 |
2023-24 |
| Number unemployed (a) – '000 |
| New South Wales |
214.0 |
259.0 |
180.0 |
144.7 |
168.3 |
| Victoria |
190.5 |
216.1 |
153.0 |
136.9 |
153.6 |
| Queensland |
169.6 |
183.3 |
126.2 |
106.3 |
123.1 |
| South Australia |
60.7 |
60.8 |
44.6 |
39.4 |
37.7 |
| Western Australia |
87.6 |
90.5 |
58.4 |
56.3 |
61.3 |
| Tasmania |
16.6 |
18.4 |
13.1 |
11.9 |
12.3 |
| Northern Territory |
9.4 |
9.0 |
6.9 |
6.1 |
6.4 |
| Australian Capital Territory |
8.8 |
10.8 |
10.0 |
8.4 |
10.3 |
| Australia |
757.2 |
847.8 |
592.3 |
510.0 |
572.9 |
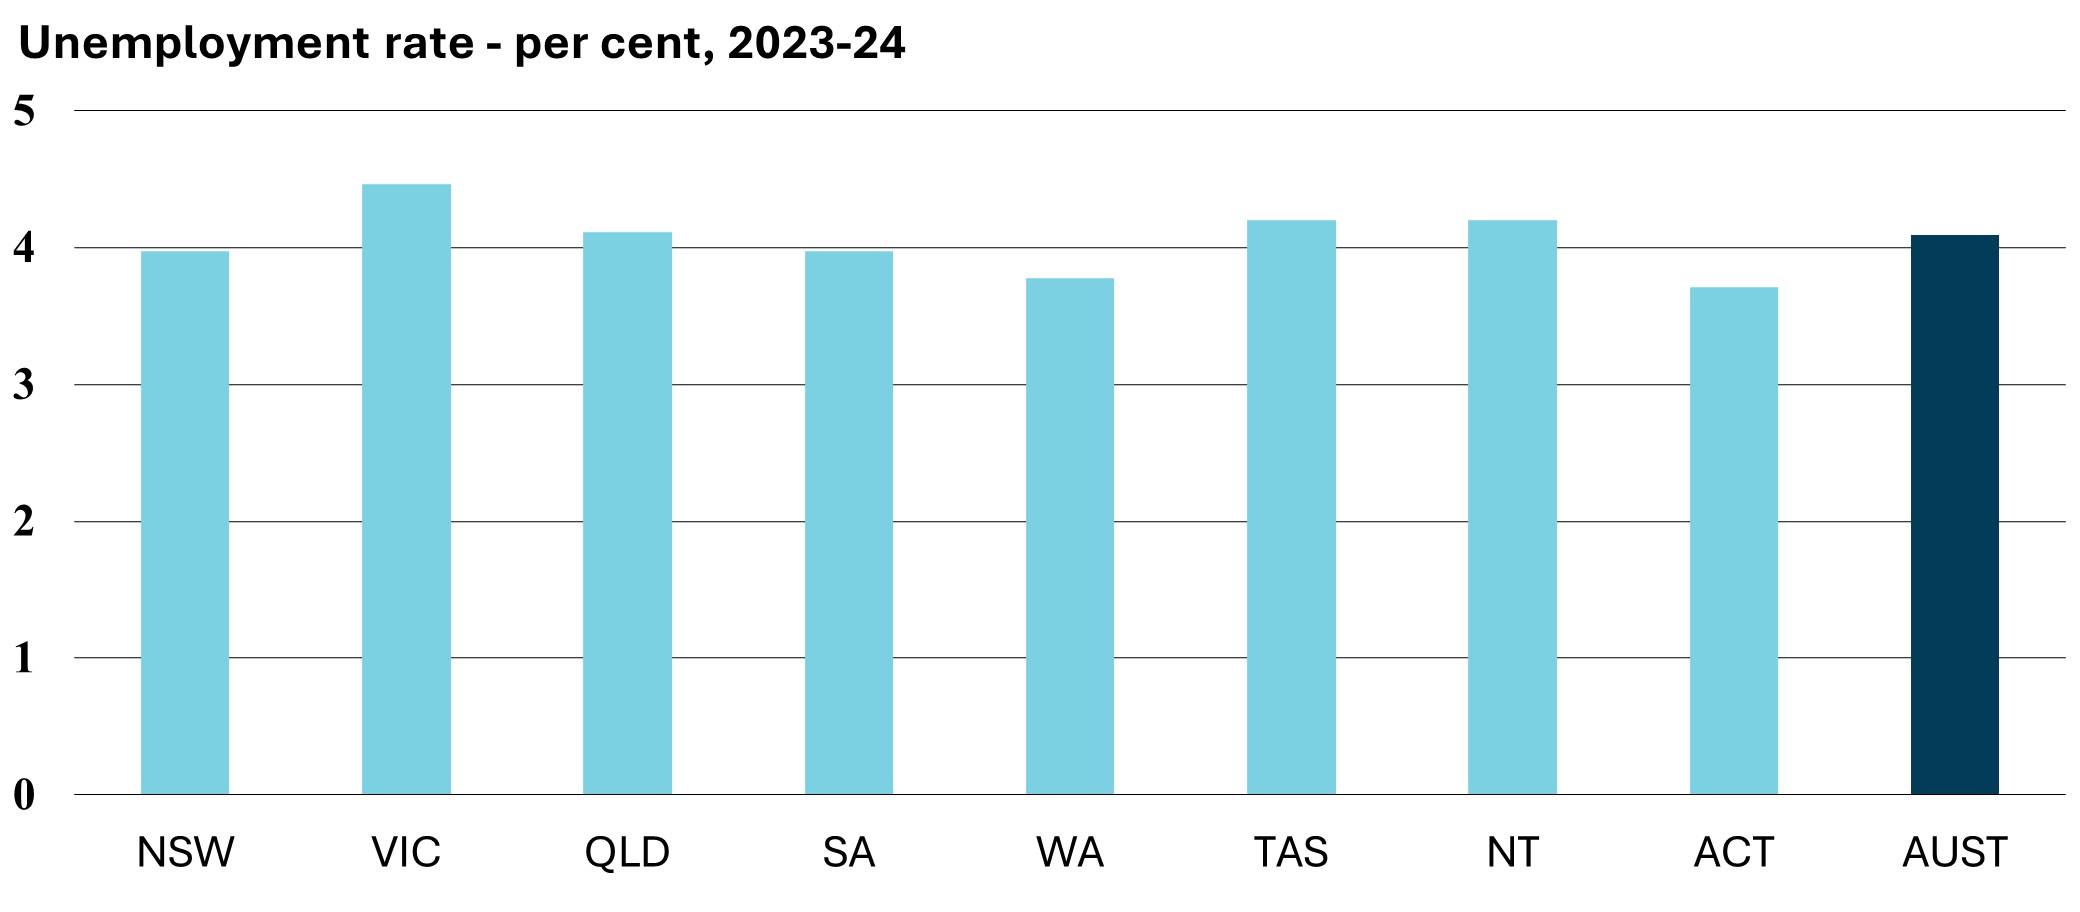
| Unemployment rate (b) – per cent |
| New South Wales |
6.7 |
5.0 |
3.5 |
3.3 |
4.0 |
| Victoria |
7.1 |
4.7 |
3.7 |
3.7 |
4.5 |
| Queensland |
7.5 |
5.3 |
3.9 |
4.0 |
4.1 |
| South Australia |
7.9 |
5.2 |
4.4 |
3.9 |
4.0 |
| Western Australia |
7.4 |
4.7 |
3.3 |
3.6 |
3.8 |
| Tasmania |
6.5 |
5.0 |
4.2 |
4.2 |
4.2 |
| Northern Territory |
6.8 |
5.8 |
4.3 |
4.5 |
4.2 |
| Australian Capital Territory |
4.1 |
4.1 |
3.3 |
3.3 |
3.7 |
| Australia |
6.9 |
5.1 |
3.7 |
3.6 |
4.1 |
(a) Annual average of monthly data.
(b) Number unemployed as a proportion of
the labour force, trend terms, as at June of financial year.
(c) The ABS advises caution when using
trend series during the COVID period (April 2020 to March 2022) due to large
month-to-month changes.
Source: Australian Bureau of Statistics
(August 2024), Labour Force, Australia
1.3 Labour force
| |
2019-20 |
2020-21 |
2021-22 |
2022-23 |
2023-24 |
| Labour force (a) – '000 |
| New South Wales |
4 236.2 |
4 285.3 |
4 245.7 |
4 453.3 |
4 572.8 |
| Victoria |
3 542.6 |
3 505.3 |
3 571.8 |
3 702.1 |
3 844.1 |
| Queensland |
2 680.3 |
2 755.2 |
2 829.8 |
2 911.4 |
3 013.4 |
| South Australia |
911.2 |
921.5 |
941.8 |
967.2 |
981.2 |
| Western Australia |
1 456.6 |
1 487.6 |
1 536.9 |
1 581.4 |
1 644.5 |
| Tasmania |
276.8 |
286.1 |
291.4 |
297.2 |
296.4 |
| Northern Territory |
139.9 |
140.9 |
139.1 |
142.1 |
144.4 |
| Australian Capital Territory |
249.8 |
258.9 |
256.8 |
269.3 |
276.5 |
| Australia |
13 493.4 |
13 640.8 |
13 813.3 |
14 324.1 |
14 773.2 |
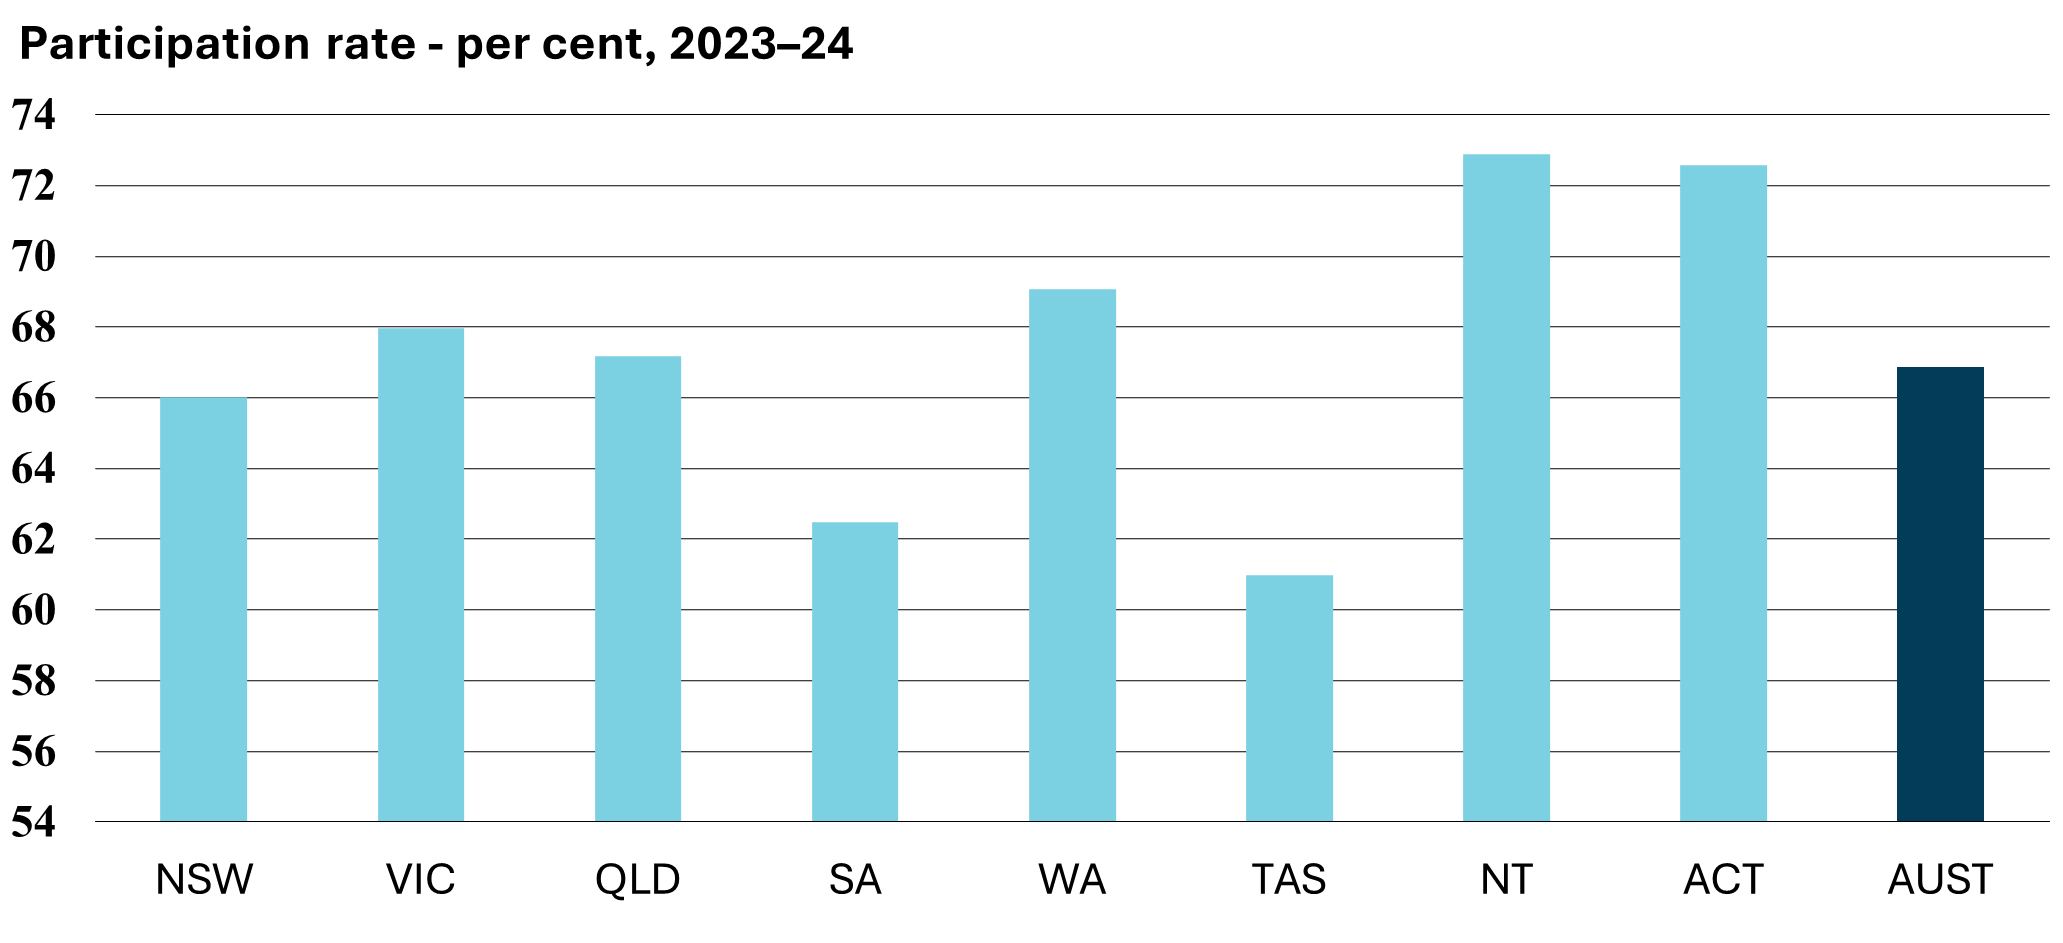
| Participation rate (b) (c) – per cent |
| New South Wales |
63.3 |
65.6 |
65.5 |
65.9 |
66.0 |
| Victoria |
64.0 |
66.1 |
66.7 |
67.4 |
68.0 |
| Queensland |
63.3 |
66.2 |
66.8 |
66.4 |
67.2 |
| South Australia |
61.0 |
62.6 |
62.9 |
64.0 |
62.5 |
| Western Australia |
65.8 |
67.9 |
69.0 |
68.6 |
69.1 |
| Tasmania |
60.2 |
61.4 |
61.4 |
62.3 |
61.0 |
| Northern Territory |
73.5 |
73.3 |
72.4 |
72.6 |
72.9 |
| Australian Capital Territory |
70.9 |
70.7 |
71.4 |
72.5 |
72.6 |
| Australia |
63.9 |
65.7 |
66.5 |
66.7 |
66.9 |
(a) Annual average of monthly data.
(b) Labour force as a proportion of the
civilian population aged 15 years and over trend series, as at June.
(c) The ABS advises caution when using
trend series during the COVID period (April 2020 to March 2022) due to large
month-to-month changes.
Source: Australian Bureau of Statistics
(August 2024), Labour Force, Australia
1.4 Youth Unemployment
| |
2019-20 |
2020-21 |
2021-22 |
2022-23 |
2023-24 |
| Number unemployed (a) – '000 |
| New South Wales |
76.0 |
83.7 |
59.4 |
48.0 |
62.4 |
| Victoria |
62.3 |
75.2 |
55.9 |
48.4 |
58.2 |
| Queensland |
67.8 |
61.5 |
46.6 |
40.8 |
49.6 |
| South Australia |
20.7 |
22.1 |
14.7 |
15.1 |
14.8 |
| Western Australia |
30.3 |
30.1 |
21.9 |
20.5 |
24.7 |
| Tasmania |
5.5 |
6.3 |
4.4 |
4.5 |
4.7 |
| Northern Territory |
3.1 |
3.0 |
2.0 |
2.1 |
2.2 |
| Australian Capital Territory |
3.7 |
3.7 |
3.6 |
3.0 |
4.2 |
| Australia |
271.5 |
282.4 |
208.0 |
183.4 |
221.9 |
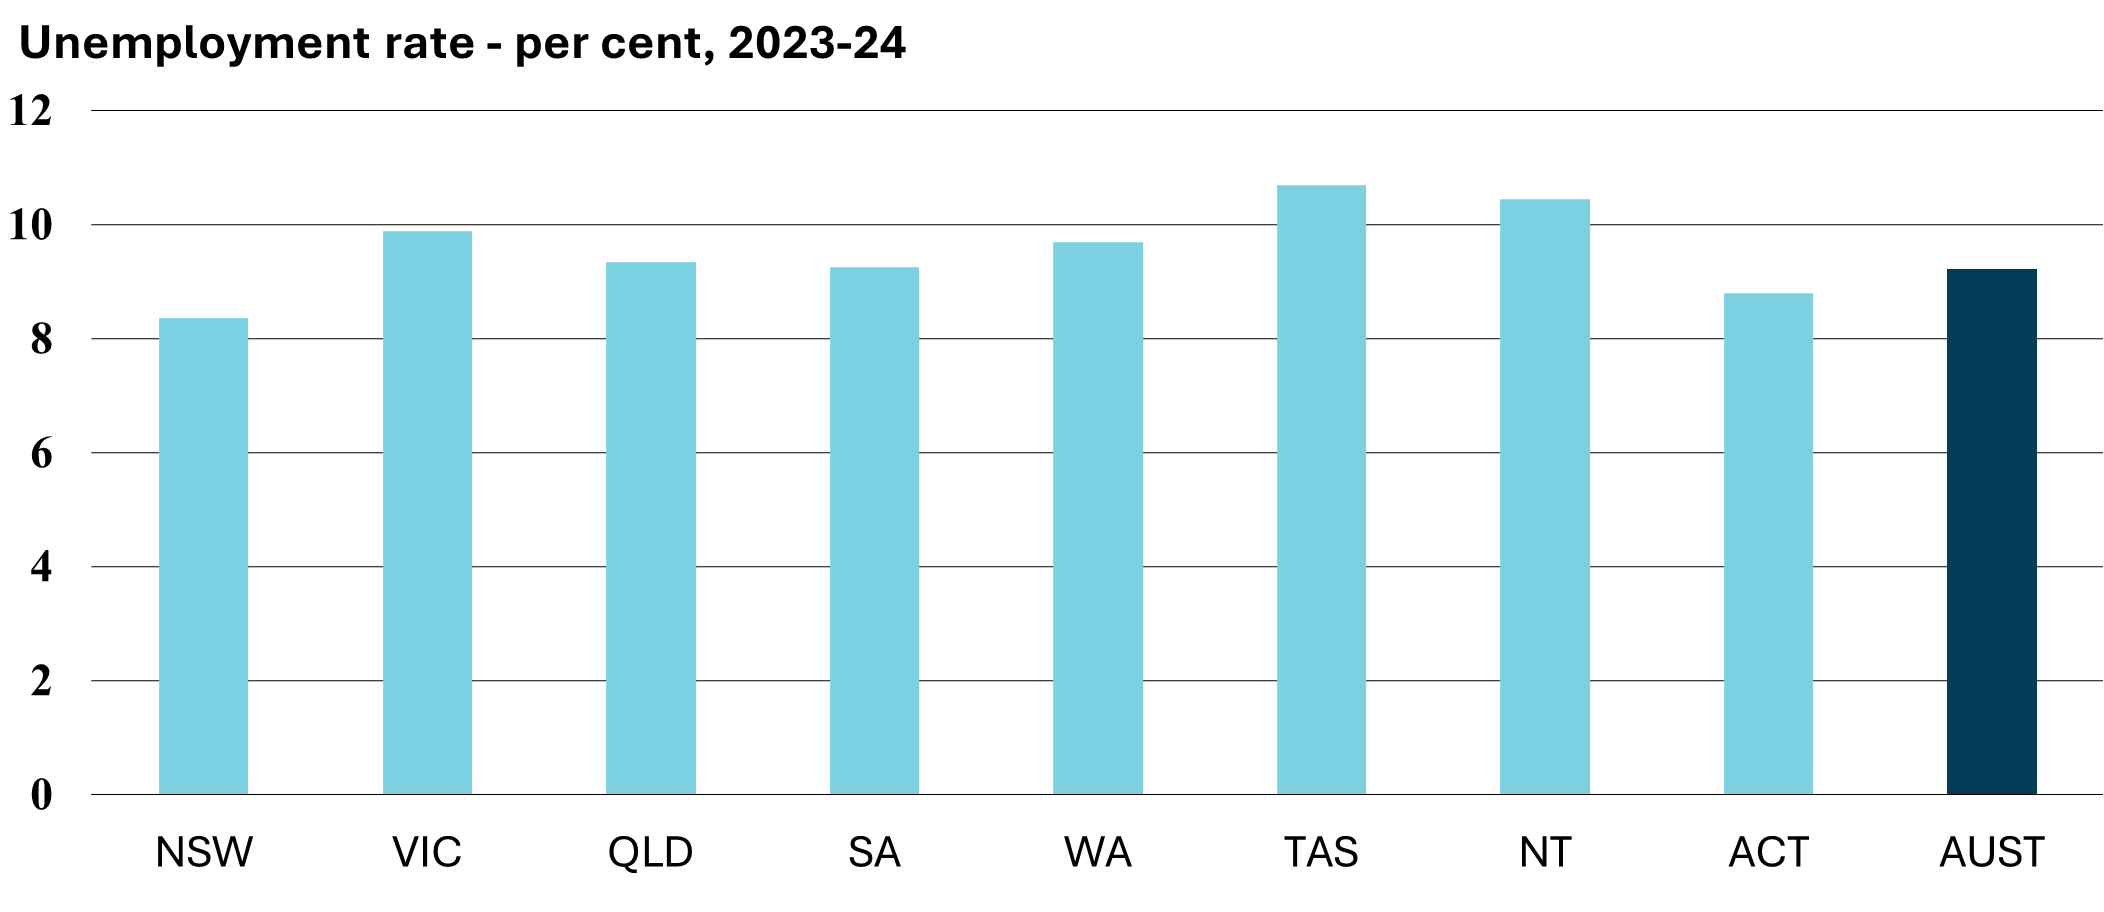
| Unemployment rate (a) – per cent |
| New South Wales |
11.6 |
12.7 |
9.2 |
6.7 |
8.4 |
| Victoria |
11.9 |
14.2 |
10.5 |
8.5 |
9.9 |
| Queensland |
15.1 |
13.3 |
9.8 |
8.1 |
9.4 |
| South Australia |
14.3 |
14.8 |
9.7 |
9.4 |
9.3 |
| Western Australia |
13.8 |
13.4 |
9.3 |
8.2 |
9.7 |
| Tasmania |
12.8 |
14.3 |
10.3 |
10.3 |
10.7 |
| Northern Territory |
15.6 |
14.5 |
10.4 |
10.3 |
10.5 |
| Australian Capital Territory |
8.7 |
8.8 |
8.8 |
6.9 |
8.8 |
| Australia |
12.8 |
13.4 |
9.7 |
7.9 |
9.2 |
(a) 15-24 year olds, annual average of
monthly data.
(b) 15-24 year olds, annual average of
monthly rates, original terms.
Source: Australian Bureau of Statistics
(August 2024), Labour Force, Australia
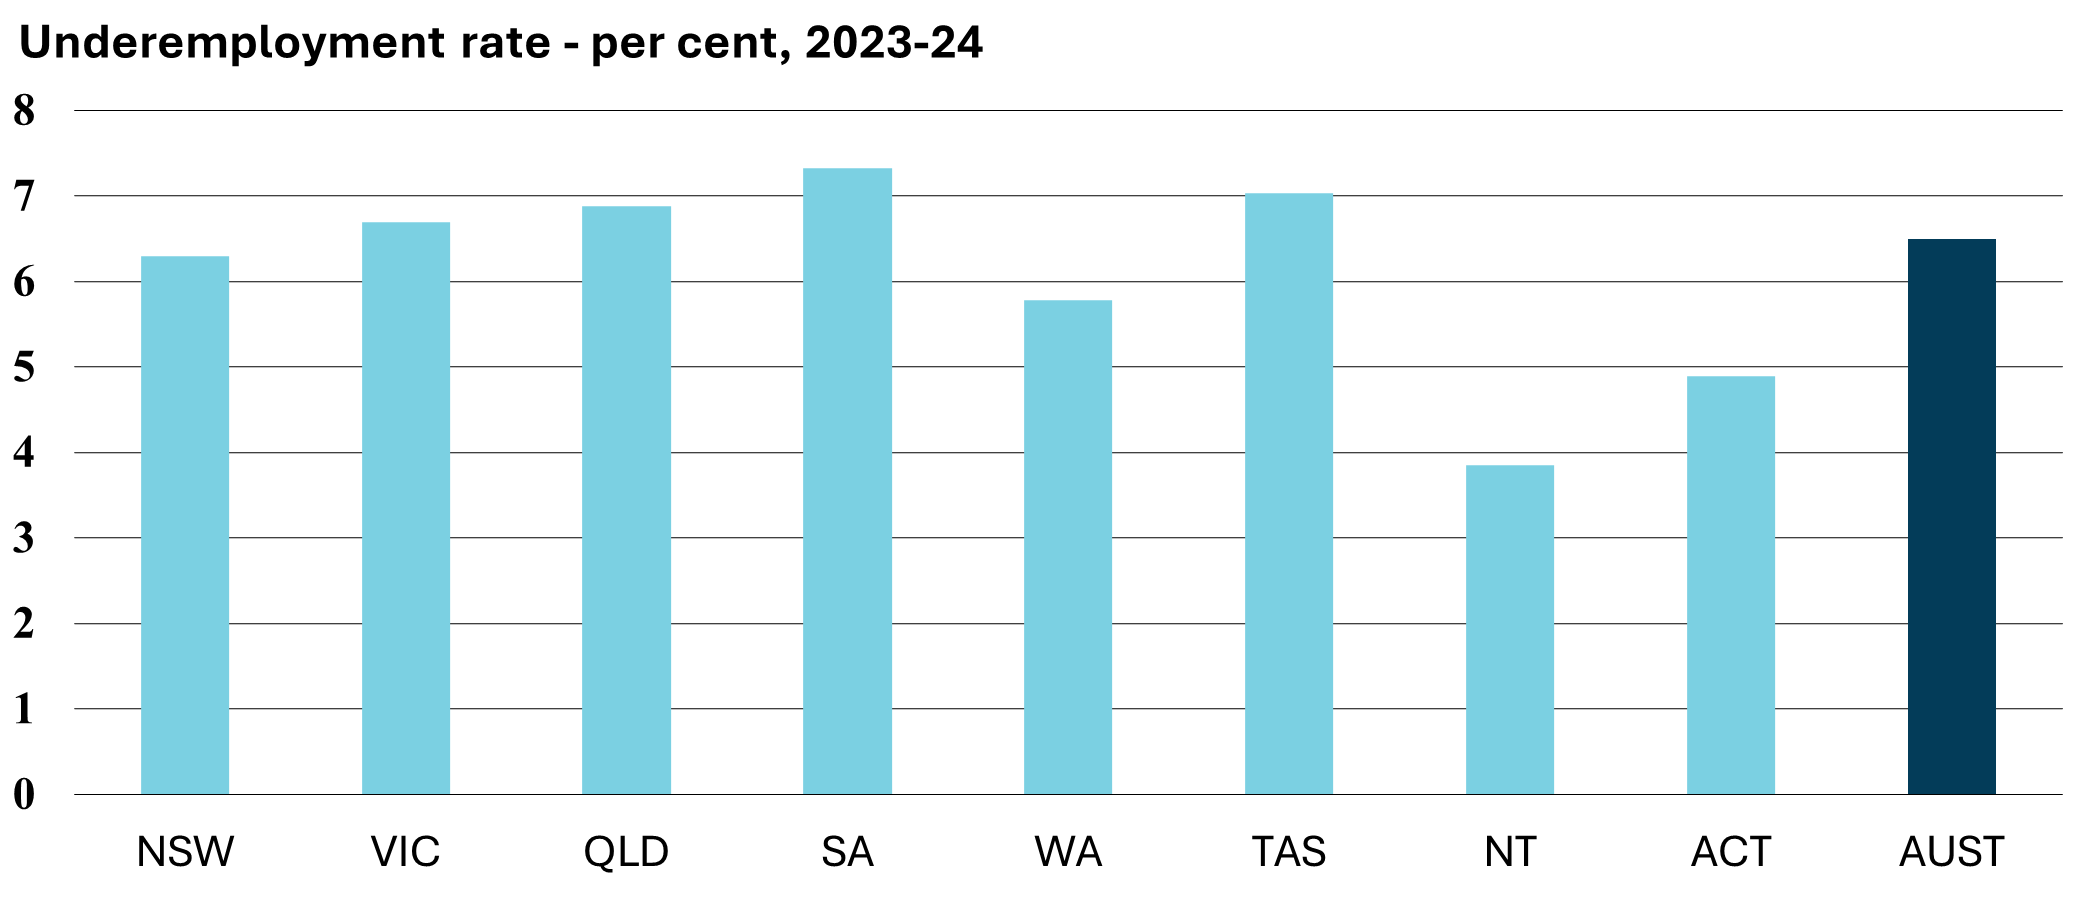
1.5 Underemployment
| |
2019-20 |
2020-21 |
2021-22 |
2022-23 |
2023-24 |
| Number underemployed (a) – '000 |
| New South Wales |
387.4 |
367.7 |
314.6 |
261.8 |
287.8 |
| Victoria |
338.8 |
359.3 |
260.8 |
219.1 |
257.2 |
| Queensland |
250.6 |
244.3 |
205.5 |
190.9 |
207.1 |
| South Australia |
95.0 |
86.9 |
72.8 |
67.7 |
71.8 |
| Western Australia |
144.5 |
120.2 |
100.5 |
92.2 |
95.0 |
| Tasmania |
32.5 |
28.3 |
22.5 |
21.5 |
20.8 |
| Northern Territory |
9.5 |
8.7 |
7.8 |
6.4 |
5.6 |
| Australian Capital Territory |
15.0 |
15.1 |
15.2 |
13.0 |
13.5 |
| Australia |
1 273.3 |
1 230.5 |
999.7 |
872.7 |
958.9 |
| Underemployment rate (b) – per cent |
| New South Wales |
9.2 |
8.6 |
7.5 |
5.9 |
6.3 |
| Victoria |
9.6 |
10.3 |
7.3 |
5.9 |
6.7 |
| Queensland |
9.4 |
8.9 |
7.3 |
6.6 |
6.9 |
| South Australia |
10.4 |
9.4 |
7.7 |
7.0 |
7.3 |
| Western Australia |
9.9 |
8.1 |
6.5 |
5.8 |
5.8 |
| Tasmania |
11.8 |
9.9 |
7.7 |
7.2 |
7.0 |
| Northern Territory |
6.8 |
6.2 |
5.6 |
4.5 |
3.8 |
| Australian Capital Territory |
6.0 |
5.8 |
6.0 |
4.8 |
4.9 |
| Australia |
9.5 |
9.0 |
7.3 |
6.1 |
6.5 |
(a) Annual average of monthly data.
(b) Number underemployed as a proportion
of the labour force, average of monthly rates.
Source: Australian Bureau of Statistics
(August 2024), Labour Force, Australia
Chapter 2: Wages and Prices
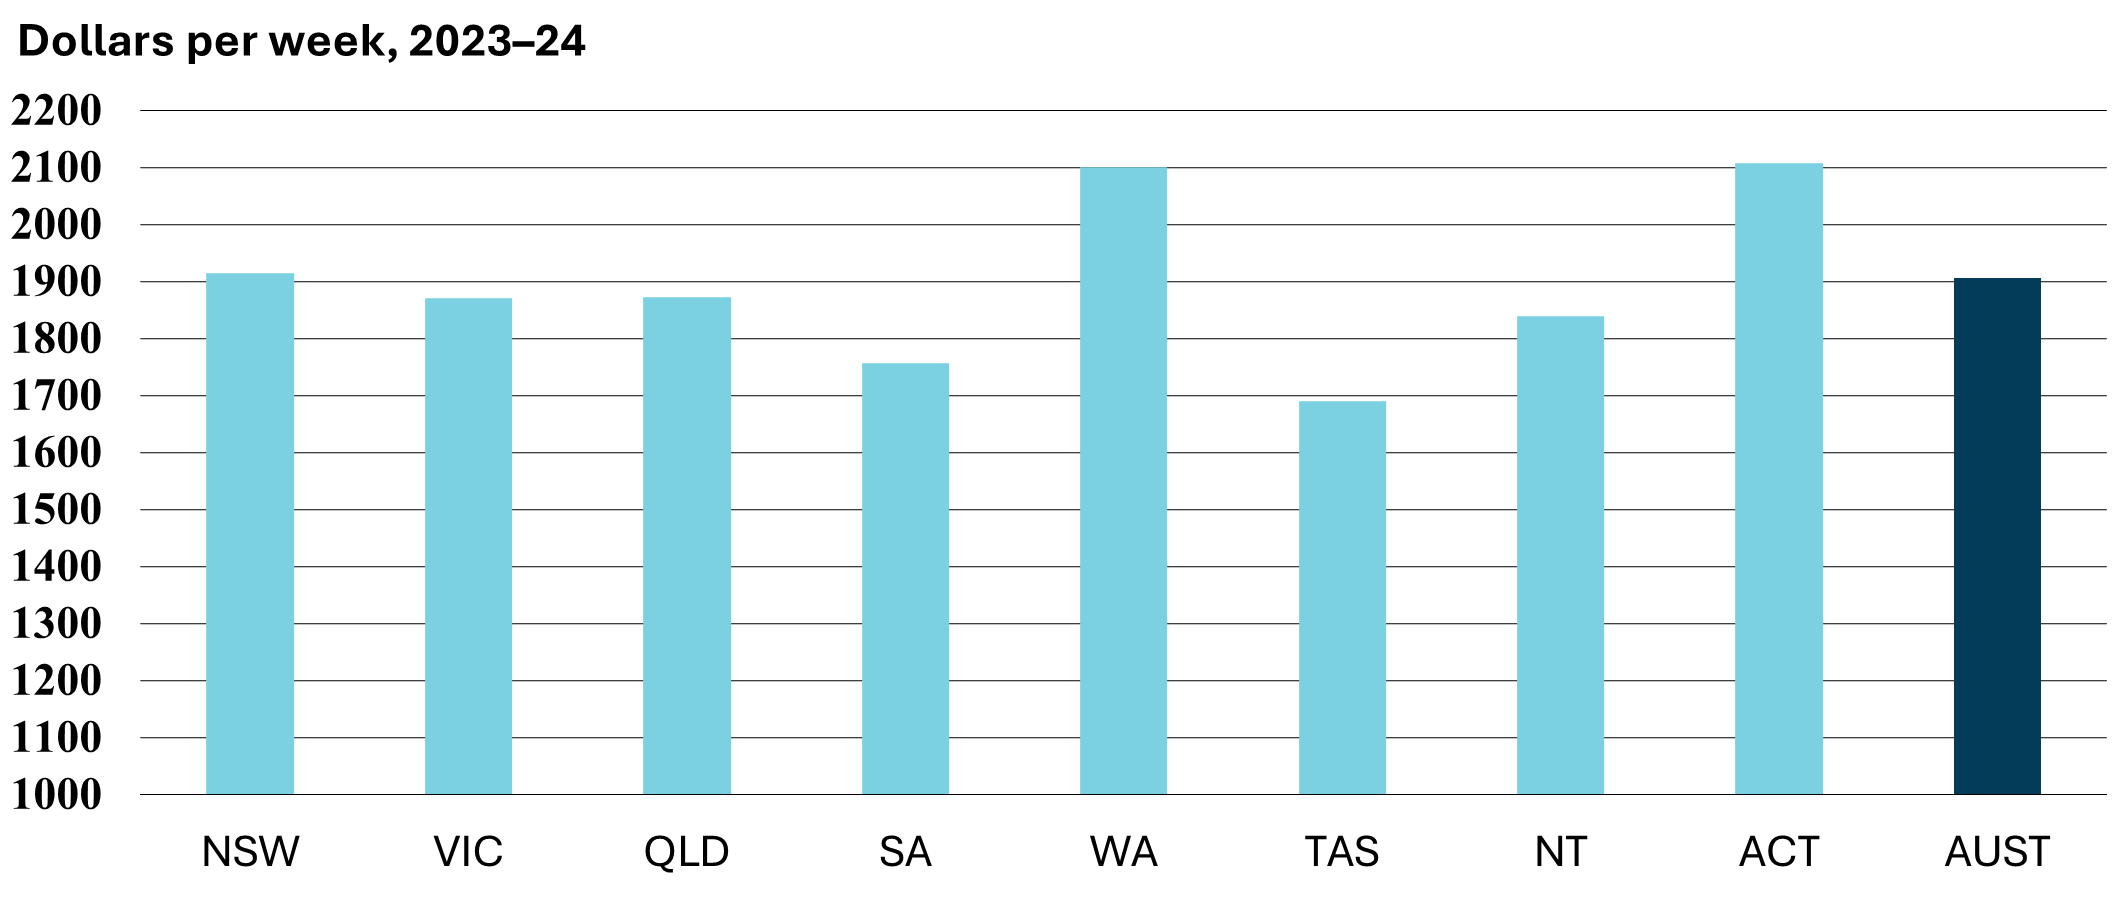
2.1 Average weekly ordinary time earnings
| |
2019-20 |
2020-21 |
2021-22 |
2022-23 |
2023-24 |
| AWOTE (a) (b) – $ per week |
| New South Wales |
1 714.6 |
1 758.1 |
1 775.6 |
1 821.1 |
1 913.6 |
| Victoria |
1 677.9 |
1 734.6 |
1 755.3 |
1 813.4 |
1 870.1 |
| Queensland |
1 627.4 |
1 631.1 |
1 688.3 |
1 775.9 |
1 872.9 |
| South Australia |
1 513.4 |
1 556.3 |
1 607.2 |
1 667.9 |
1 756.2 |
| Western Australia |
1 809.3 |
1 860.1 |
1 916.6 |
2 013.9 |
2 101.0 |
| Tasmania |
1 469.0 |
1 504.4 |
1 555.1 |
1 602.9 |
1 690.4 |
| Northern Territory |
1 693.4 |
1 699.5 |
1 704.5 |
1 760.0 |
1 839.3 |
| Australian Capital Territory |
1 845.6 |
1 899.4 |
1 982.1 |
2 021.0 |
2 107.1 |
| Australia |
1 686.2 |
1 724.4 |
1 759.1 |
1 822.9 |
1 906.1 |
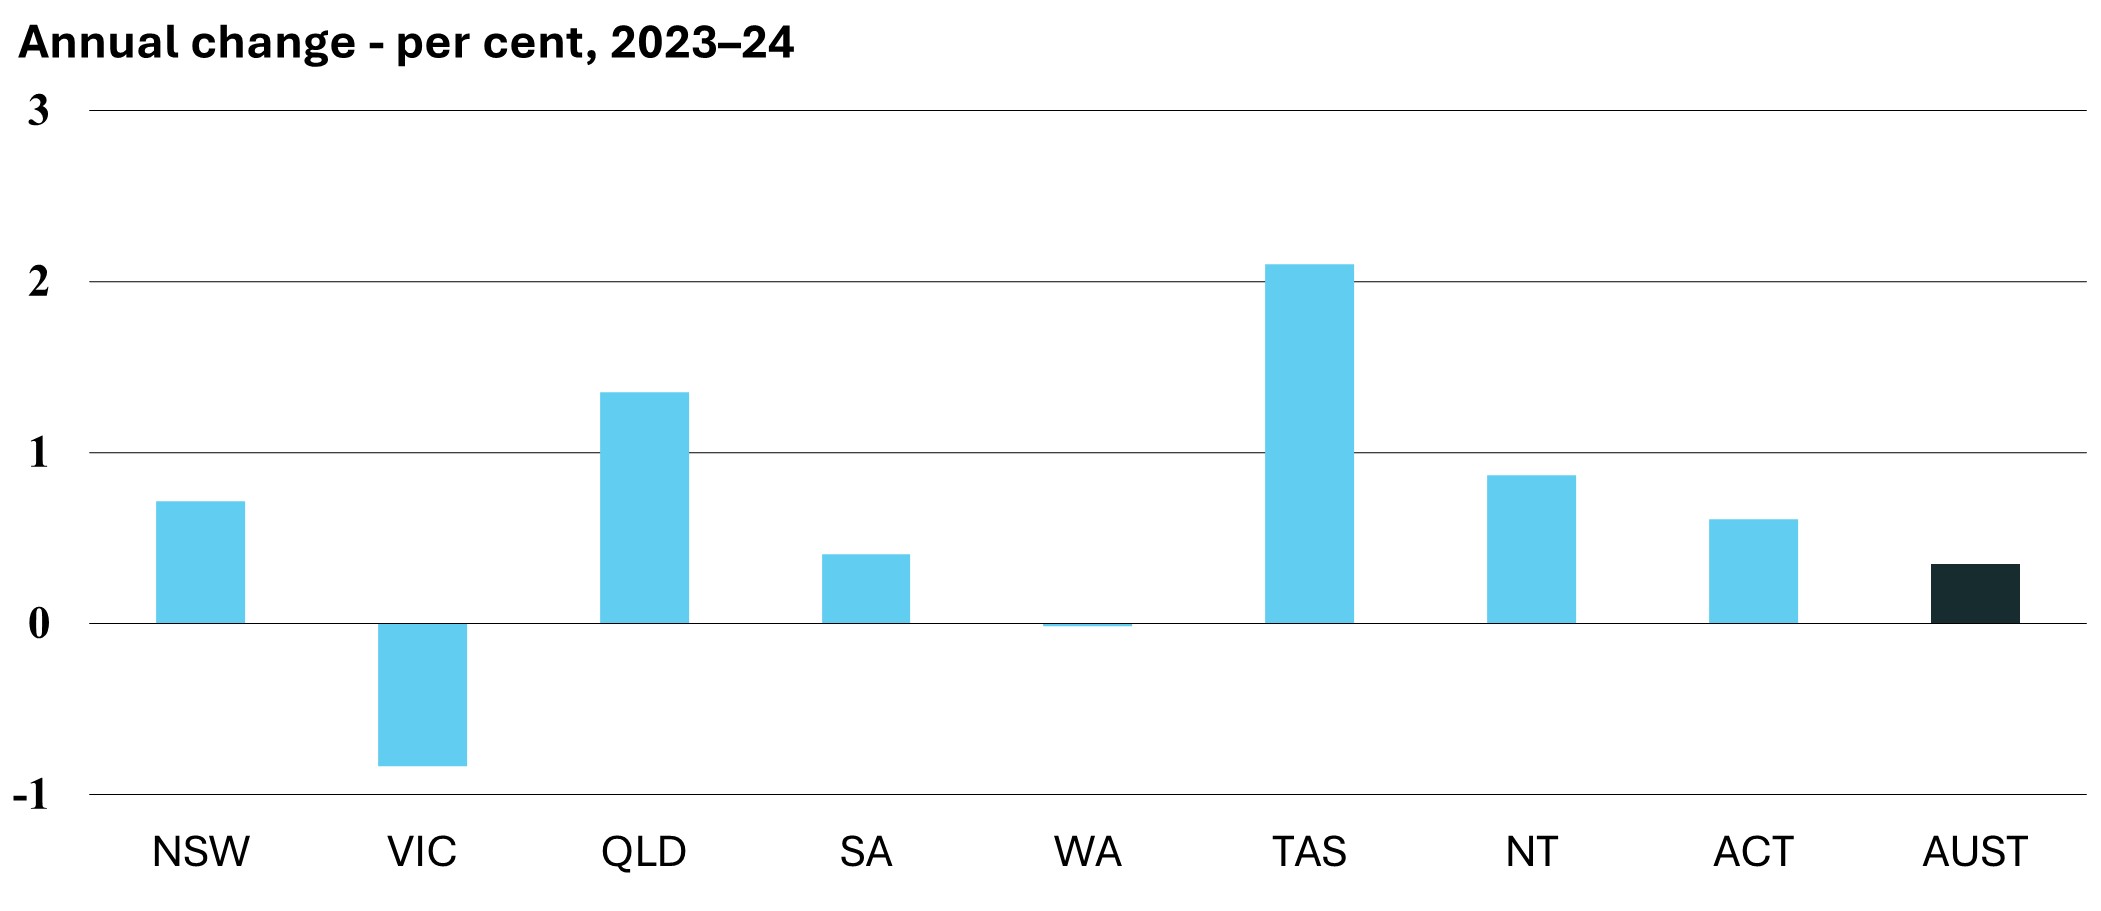
| Annual change – per cent |
| New South Wales |
4.3 |
2.5 |
1.0 |
2.6 |
5.1 |
| Victoria |
5.6 |
3.4 |
1.2 |
3.3 |
3.1 |
| Queensland |
3.3 |
0.2 |
3.5 |
5.2 |
5.5 |
| South Australia |
3.0 |
2.8 |
3.3 |
3.8 |
5.3 |
| Western Australia |
2.3 |
2.8 |
3.0 |
5.1 |
4.3 |
| Tasmania |
4.2 |
2.4 |
3.4 |
3.1 |
5.5 |
| Northern Territory |
1.6 |
0.4 |
0.3 |
3.3 |
4.5 |
| Australian Capital Territory |
1.9 |
2.9 |
4.4 |
2.0 |
4.3 |
| Australia |
4.1 |
2.3 |
2.0 |
3.6 |
4.6 |
(a) Annual average of bi-annual data.
(b) Average weekly ordinary time earnings
for full-time adult employees.
Care should be taken when comparing
average weekly earnings of states over time due to compositional changes.
Source: Australian Bureau of Statistics
(May 2024), Average Weekly Earnings, Australia
2.2 Real average weekly ordinary time earnings
| |
2019-20 |
2020-21 |
2021-22 |
2022-23 |
2023-24 |
| Real AWOTE (a) (b) – $ per week |
| New South Wales |
1 937.3 |
1 957.1 |
1 902.1 |
1 821.1 |
1 834.1 |
| Victoria |
1 893.4 |
1 929.7 |
1 876.9 |
1 813.1 |
1 798.0 |
| Queensland |
1 855.1 |
1 821.8 |
1 789.2 |
1 753.5 |
1 777.3 |
| South Australia |
1 730.0 |
1 752.8 |
1 736.5 |
1 669.5 |
1 676.2 |
| Western Australia |
2 109.6 |
2 134.8 |
2 075.9 |
2 053.7 |
2 053.4 |
| Tasmania |
1 665.2 |
1 675.0 |
1 649.5 |
1 586.9 |
1 620.2 |
| Northern Territory |
2 008.7 |
1 977.1 |
1 870.8 |
1 815.9 |
1 831.6 |
| Australian Capital Territory |
2 122.3 |
2 139.3 |
2 129.4 |
2 039.2 |
2 051.7 |
| Australia |
1 918.0 |
1 930.1 |
1 885.2 |
1 825.3 |
1 831.6 |
| Annual change – per cent |
| New South Wales |
3.3 |
1.0 |
-2.8 |
-4.3 |
0.7 |
| Victoria |
3.9 |
1.9 |
-2.7 |
-3.4 |
-0.8 |
| Queensland |
2.1 |
-1.8 |
-1.8 |
-2.0 |
1.4 |
| South Australia |
1.2 |
1.3 |
-0.9 |
-3.9 |
0.4 |
| Western Australia |
0.9 |
1.2 |
-2.8 |
-1.1 |
0.0 |
| Tasmania |
1.7 |
0.6 |
-1.5 |
-3.8 |
2.1 |
| Northern Territory |
1.4 |
-1.6 |
-5.4 |
-2.9 |
0.9 |
| Australian Capital Territory |
0.7 |
0.8 |
-0.5 |
-4.2 |
0.6 |
| Australia |
2.7 |
0.6 |
-2.3 |
-3.2 |
0.3 |
(a) Annual average.
(b) Average weekly ordinary time earnings
for full-time adult employees expressed in average 2022–23 dollars; converted
to real terms using the Consumer Price Index for each state or territory.
Care should be taken when comparing
average weekly earnings of states over time due to compositional changes.
Sources: Australian Bureau of Statistics,
Average Weekly Earnings, Australia; Australian Bureau of Statistics, Consumer
Price Index, Australia
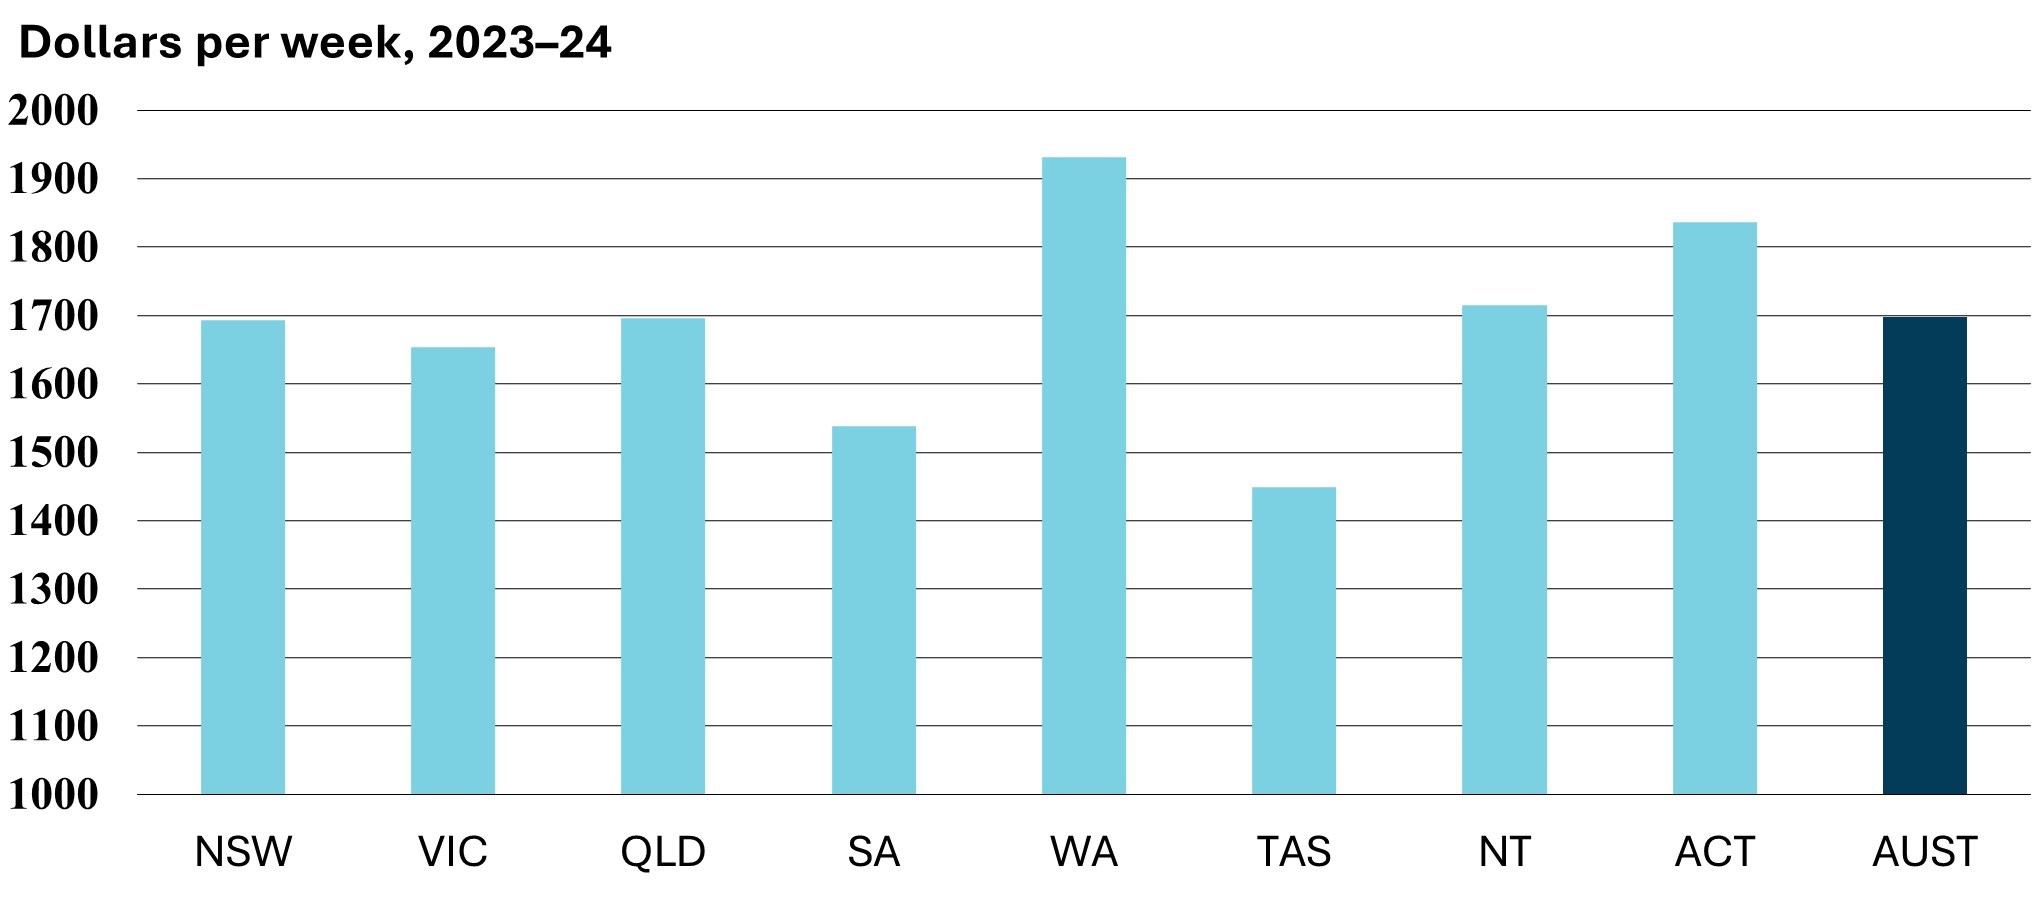
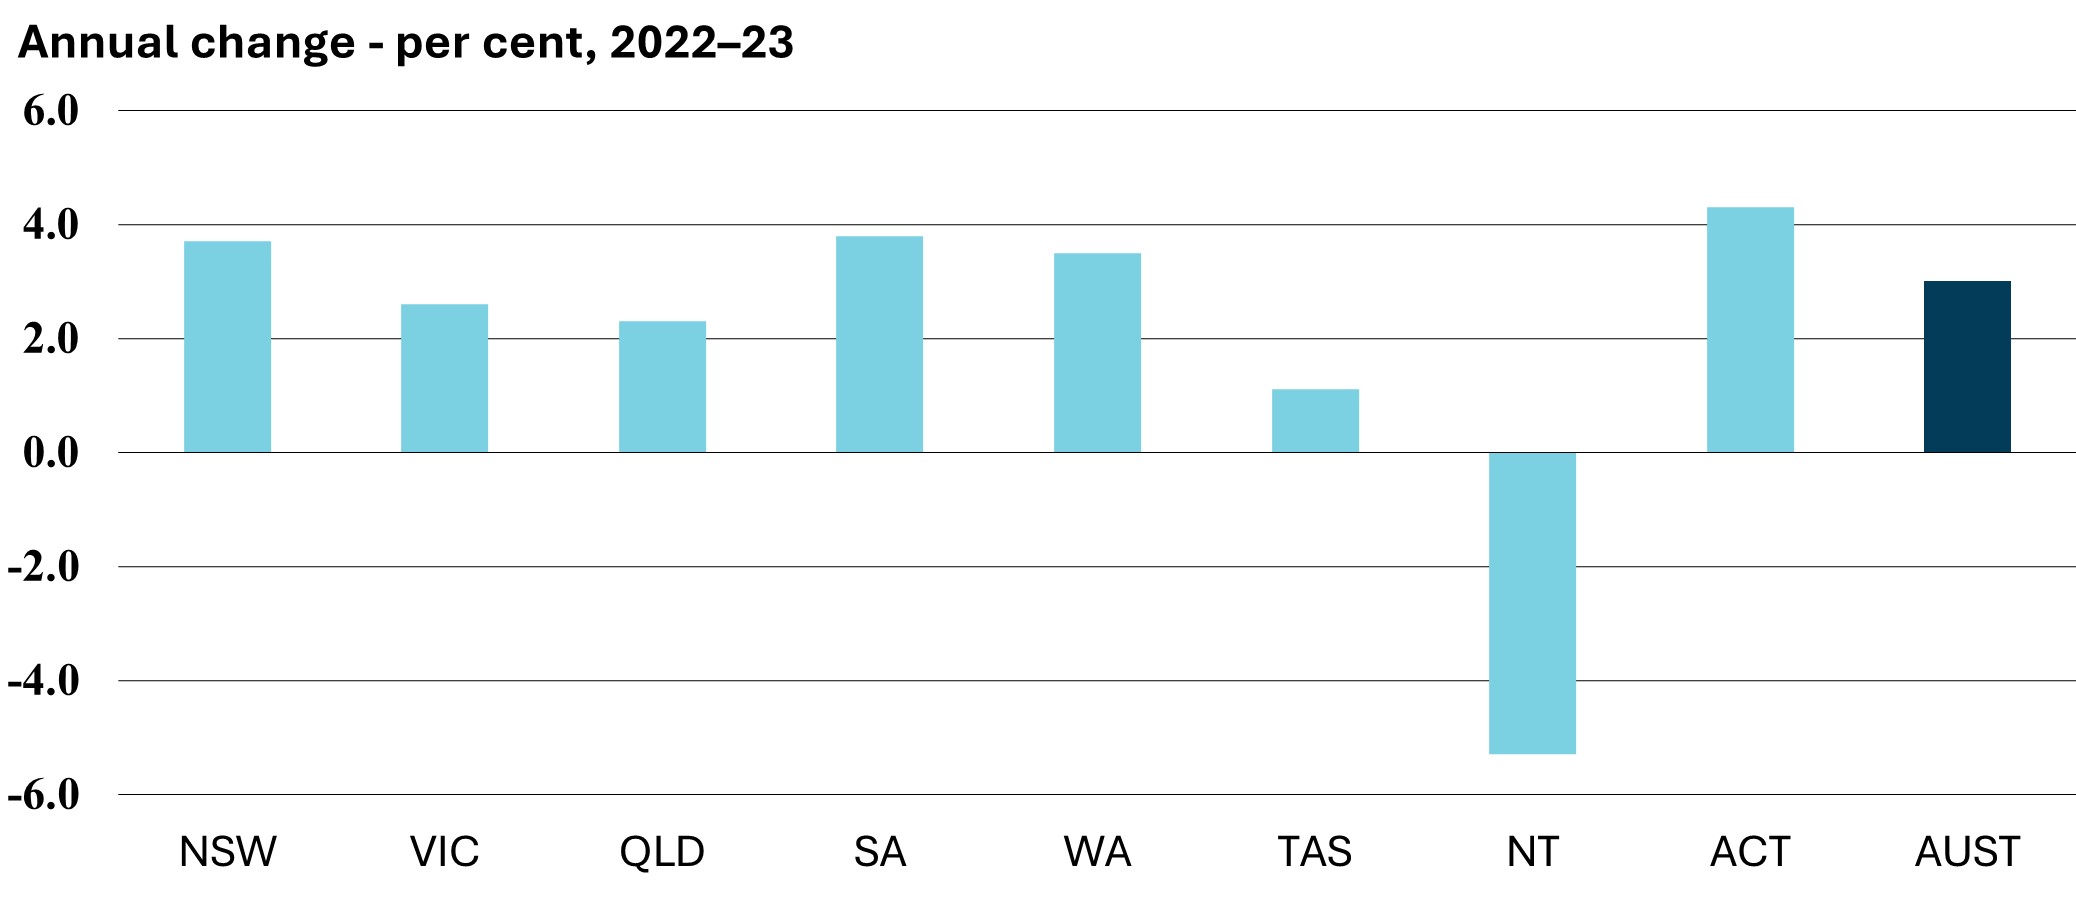
2.3 Male total average weekly earnings
| |
2019-20 |
2020-21 |
2021-22 |
2022-23 |
2023-24 |
| MTAWE (a) (b) – $ per week |
| New South Wales |
1 551.5 |
1 572.0 |
1 577.8 |
1 620.9 |
1 692.6 |
| Victoria |
1 471.1 |
1 504.7 |
1 549.6 |
1 586.5 |
1 654.1 |
| Queensland |
1 486.0 |
1 490.8 |
1 566.6 |
1 622.1 |
1 695.7 |
| South Australia |
1 327.8 |
1 353.8 |
1 421.5 |
1 456.5 |
1 539.0 |
| Western Australia |
1 710.4 |
1 754.7 |
1 811.7 |
1 899.8 |
1 930.8 |
| Tasmania |
1 282.9 |
1 279.5 |
1 326.2 |
1 388.9 |
1 448.5 |
| Northern Territory |
1 602.7 |
1 559.3 |
1 562.5 |
1 658.4 |
1 714.9 |
| Australian Capital Territory |
1 597.0 |
1 638.8 |
1 727.2 |
1 785.1 |
1 836.6 |
| Australia |
1 518.0 |
1 541.0 |
1 582.1 |
1 631.1 |
1 698.3 |
| Annual change – per cent |
| New South Wales |
3.0 |
1.3 |
0.4 |
2.7 |
4.4 |
| Victoria |
4.6 |
2.3 |
3.0 |
2.4 |
4.3 |
| Queensland |
2.9 |
0.3 |
5.1 |
3.5 |
4.5 |
| South Australia |
4.0 |
2.0 |
5.0 |
2.5 |
5.7 |
| Western Australia |
4.1 |
2.6 |
3.2 |
4.9 |
1.6 |
| Tasmania |
1.4 |
-0.3 |
3.7 |
4.7 |
4.3 |
| Northern Territory |
1.9 |
-2.7 |
0.2 |
6.1 |
3.4 |
| Australian Capital Territory |
-2.7 |
2.6 |
5.4 |
3.4 |
2.9 |
| Australia |
3.4 |
1.5 |
2.7 |
3.1 |
4.1 |
(a) Annual average of bi-annual data.
(b) Total average weekly earnings for all
male employees. Not adjusted for CPI.
Source: Australian Bureau of Statistics
(May 2024), Average Weekly Earnings, Australia
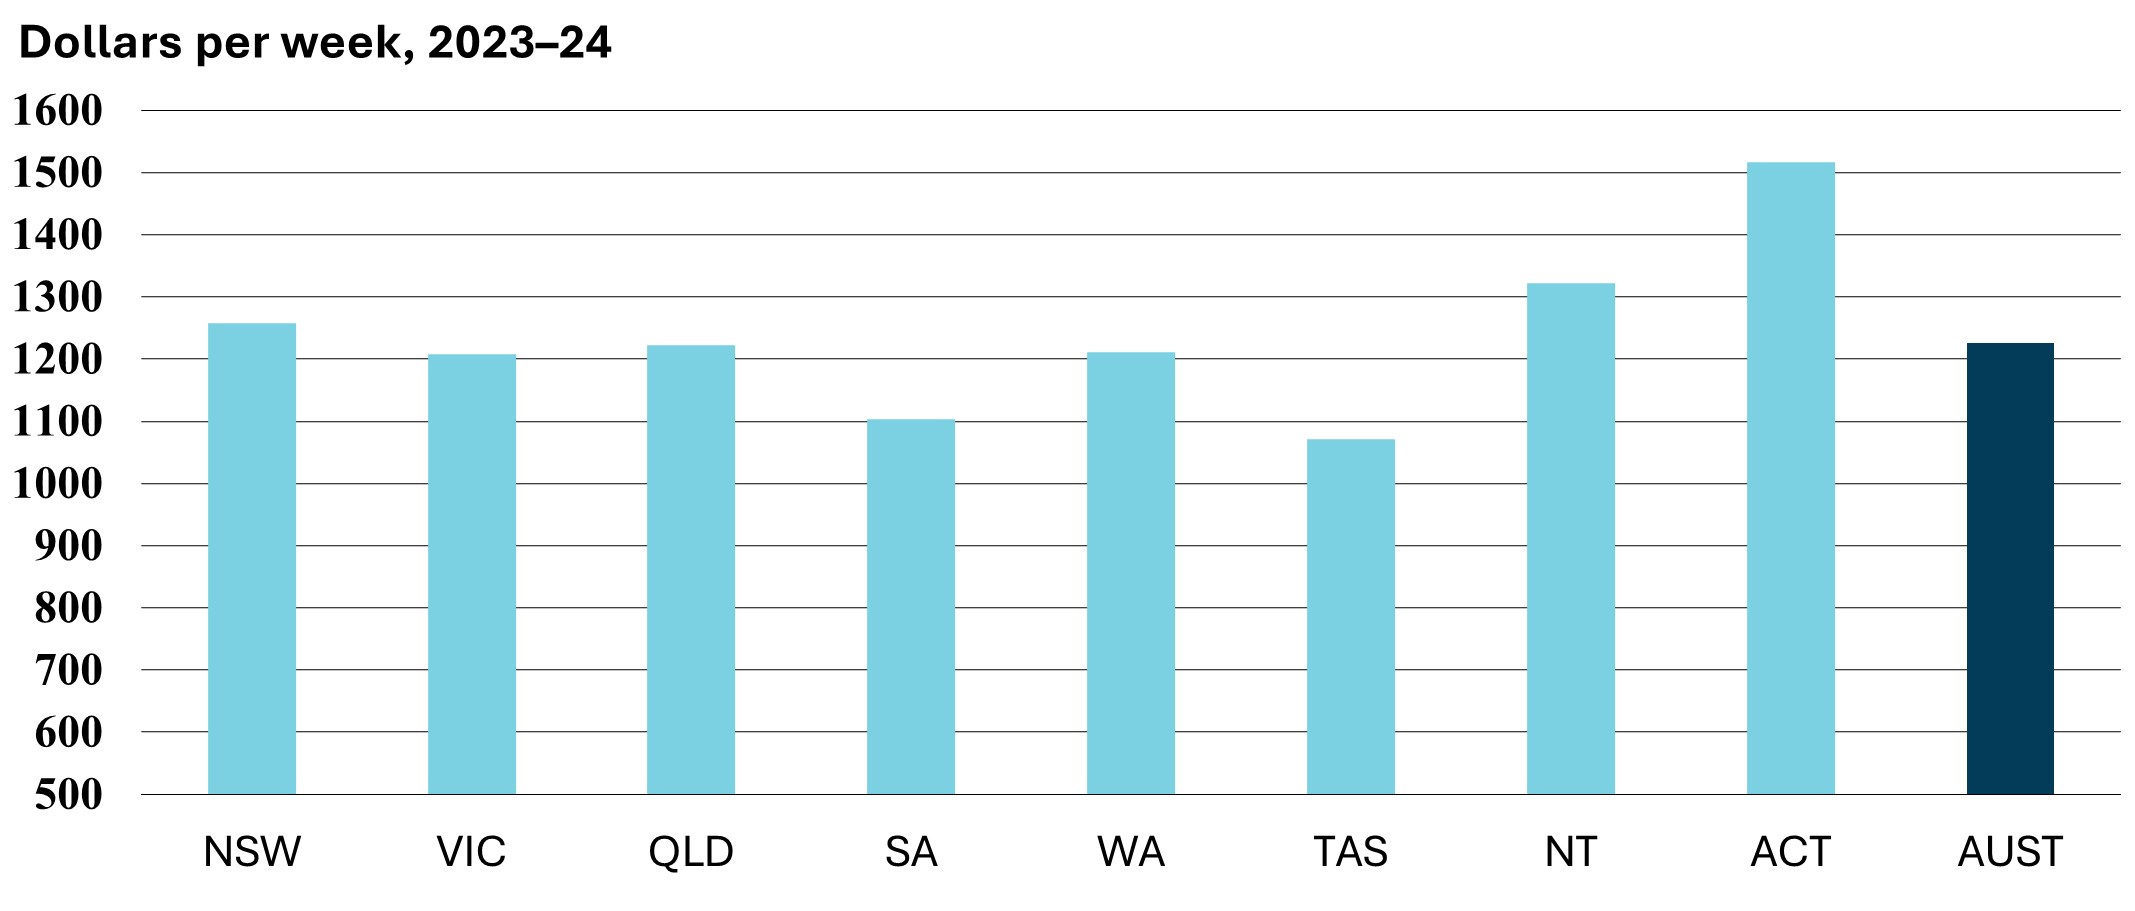
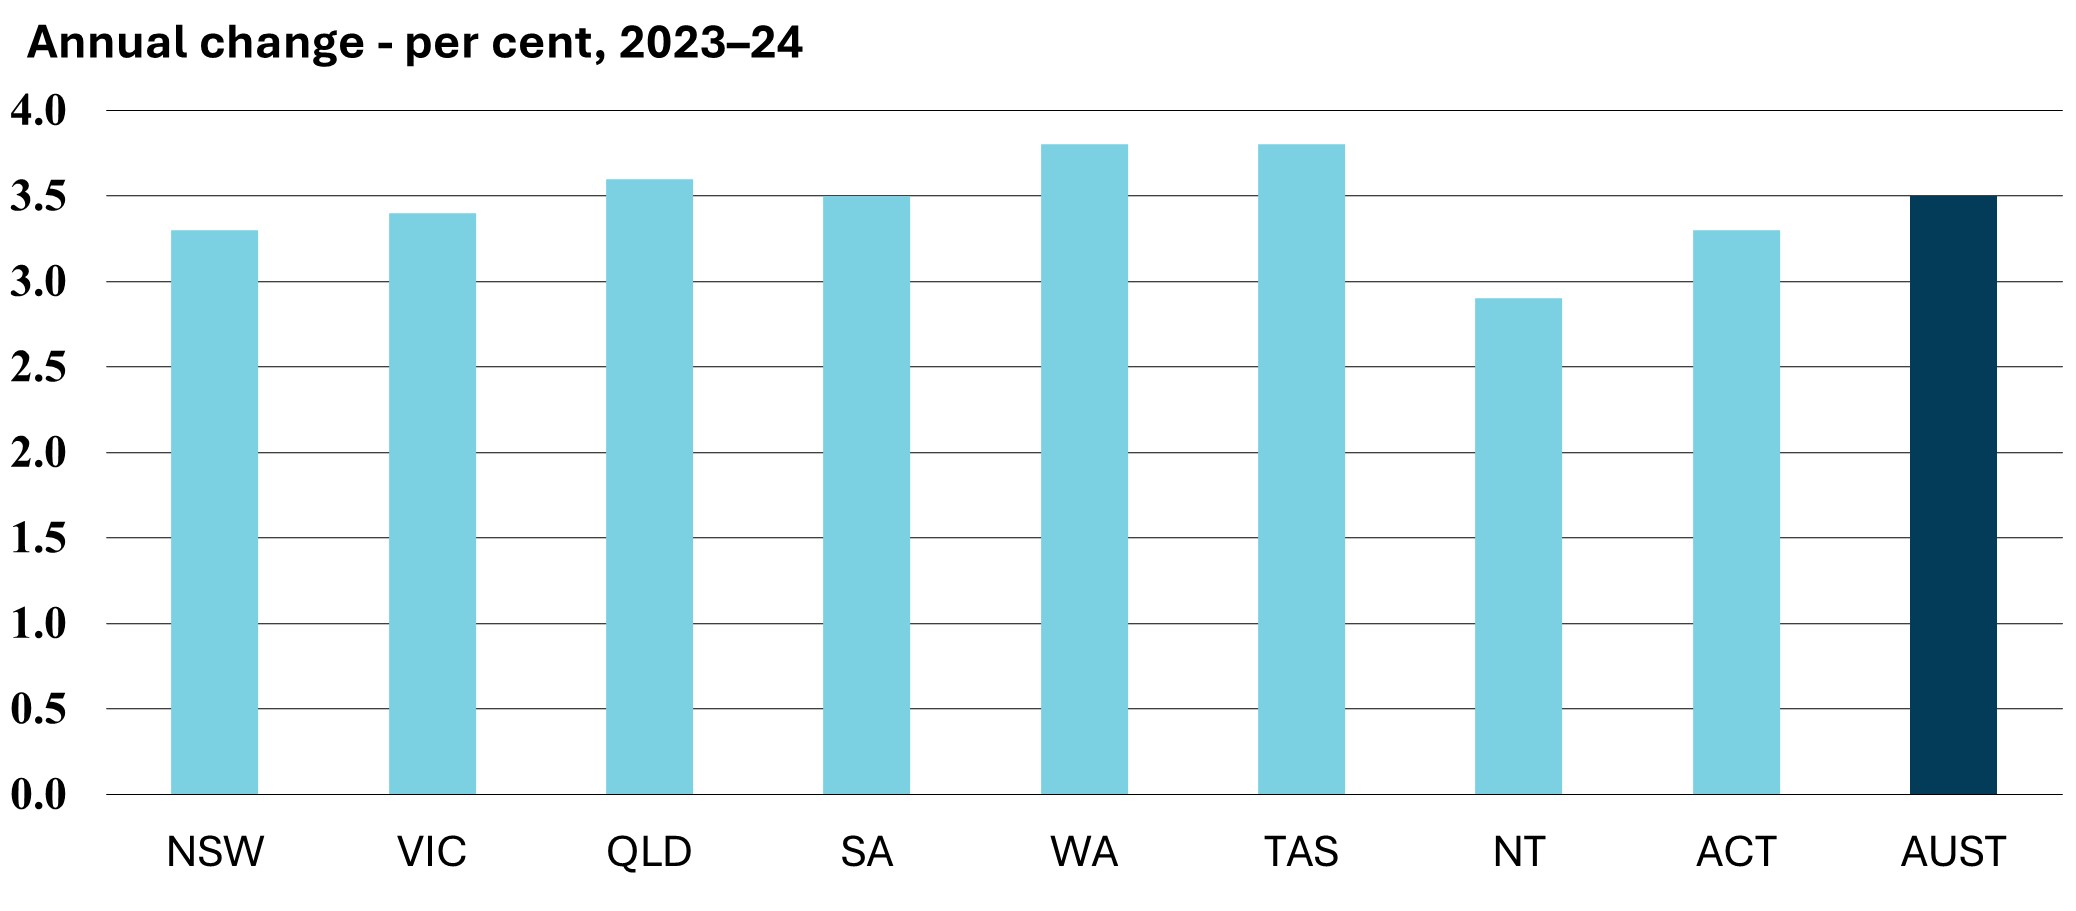
2.4 Female total average weekly earnings
| |
2019-20 |
2020-21 |
2021-22 |
2022-23 |
2023-24 |
| FTAWE (a) (b) – $ per week |
| New South Wales |
1 082.4 |
1 085.7 |
1 152.3 |
1 176.8 |
1 257.2 |
| Victoria |
1 054.3 |
1 059.4 |
1 067.4 |
1 141.0 |
1 207.9 |
| Queensland |
1 032.6 |
1 029.8 |
1 073.5 |
1 143.8 |
1 221.7 |
| South Australia |
955.1 |
987.5 |
1 024.8 |
1 054.5 |
1 103.3 |
| Western Australia |
1 026.4 |
1 028.7 |
1 100.4 |
1 172.9 |
1 211.5 |
| Tasmania |
898.2 |
950.7 |
979.0 |
1 037.4 |
1 071.9 |
| Northern Territory |
1 250.9 |
1 214.0 |
1 256.3 |
1 270.6 |
1 321.8 |
| Australian Capital Territory |
1 375.4 |
1 359.9 |
1 394.6 |
1 442.0 |
1 517.0 |
| Australia |
1 055.4 |
1 059.8 |
1 104.4 |
1 157.5 |
1 225.4 |
| Annual change – per cent |
| New South Wales |
2.9 |
0.3 |
6.1 |
2.1 |
6.8 |
| Victoria |
6.4 |
0.5 |
0.8 |
6.9 |
5.9 |
| Queensland |
6.7 |
-0.3 |
4.2 |
6.5 |
6.8 |
| South Australia |
5.3 |
3.4 |
3.8 |
2.9 |
4.6 |
| Western Australia |
6.5 |
0.2 |
7.0 |
6.6 |
3.3 |
| Tasmania |
5.1 |
5.8 |
3.0 |
6.0 |
3.3 |
| Northern Territory |
5.1 |
-2.9 |
3.5 |
1.1 |
4.0 |
| Australian Capital Territory |
6.5 |
-1.1 |
2.6 |
3.4 |
5.2 |
| Australia |
5.2 |
0.4 |
4.2 |
4.8 |
5.9 |
(a) Annual average of bi-annual data.
(b) Total average weekly earnings for all
female employees. Not adjusted for CPI.
Source:
Australian Bureau of Statistics
(May 2024), Average Weekly Earnings, Australia
2.5 Wage price index
| |
2019-20 |
2020-21 |
2021-22 |
2022-23 |
2023-24 |
| Wage price index (a) (b) |
| New South Wales |
133.6 |
136.0 |
139.6 |
144.4 |
150.4 |
| Victoria |
135.5 |
138.0 |
141.5 |
146.6 |
151.5 |
| Queensland |
133.8 |
136.1 |
140.1 |
145.3 |
152.0 |
| South Australia |
135.1 |
137.2 |
140.3 |
145.5 |
151.2 |
| Western Australia |
133.0 |
135.1 |
138.7 |
144.5 |
150.5 |
| Tasmania |
135.4 |
138.4 |
142.4 |
147.9 |
155.5 |
| Northern Territory |
134.6 |
137.1 |
139.9 |
144.5 |
150.0 |
| Australian Capital Territory |
132.6 |
134.8 |
138.2 |
143.7 |
149.6 |
| Australia |
134.1 |
136.5 |
140.1 |
145.2 |
151.1 |
| Annual change – per cent |
| New South Wales |
2.0 |
1.5 |
2.4 |
3.3 |
3.3 |
| Victoria |
2.4 |
1.5 |
2.3 |
3.4 |
3.4 |
| Queensland |
1.9 |
1.6 |
2.4 |
3.6 |
3.6 |
| South Australia |
2.4 |
1.6 |
2.1 |
3.5 |
3.5 |
| Western Australia |
1.7 |
1.4 |
2.2 |
3.8 |
3.8 |
| Tasmania |
2.4 |
1.9 |
2.8 |
3.8 |
3.8 |
| Northern Territory |
2.3 |
1.8 |
2.1 |
2.9 |
2.9 |
| Australian Capital Territory |
2.3 |
1.4 |
2.5 |
3.3 |
3.3 |
| Australia |
2.1 |
1.5 |
2.4 |
3.5 |
3.5 |
(a) Index value at June of the financial
year.
(b) Total hourly rate of pay index
excluding bonuses, all sectors. Base: 2008–09 = 100.0.
Source: Australian Bureau of Statistics
(June 2024), Wage Price Index, Australia
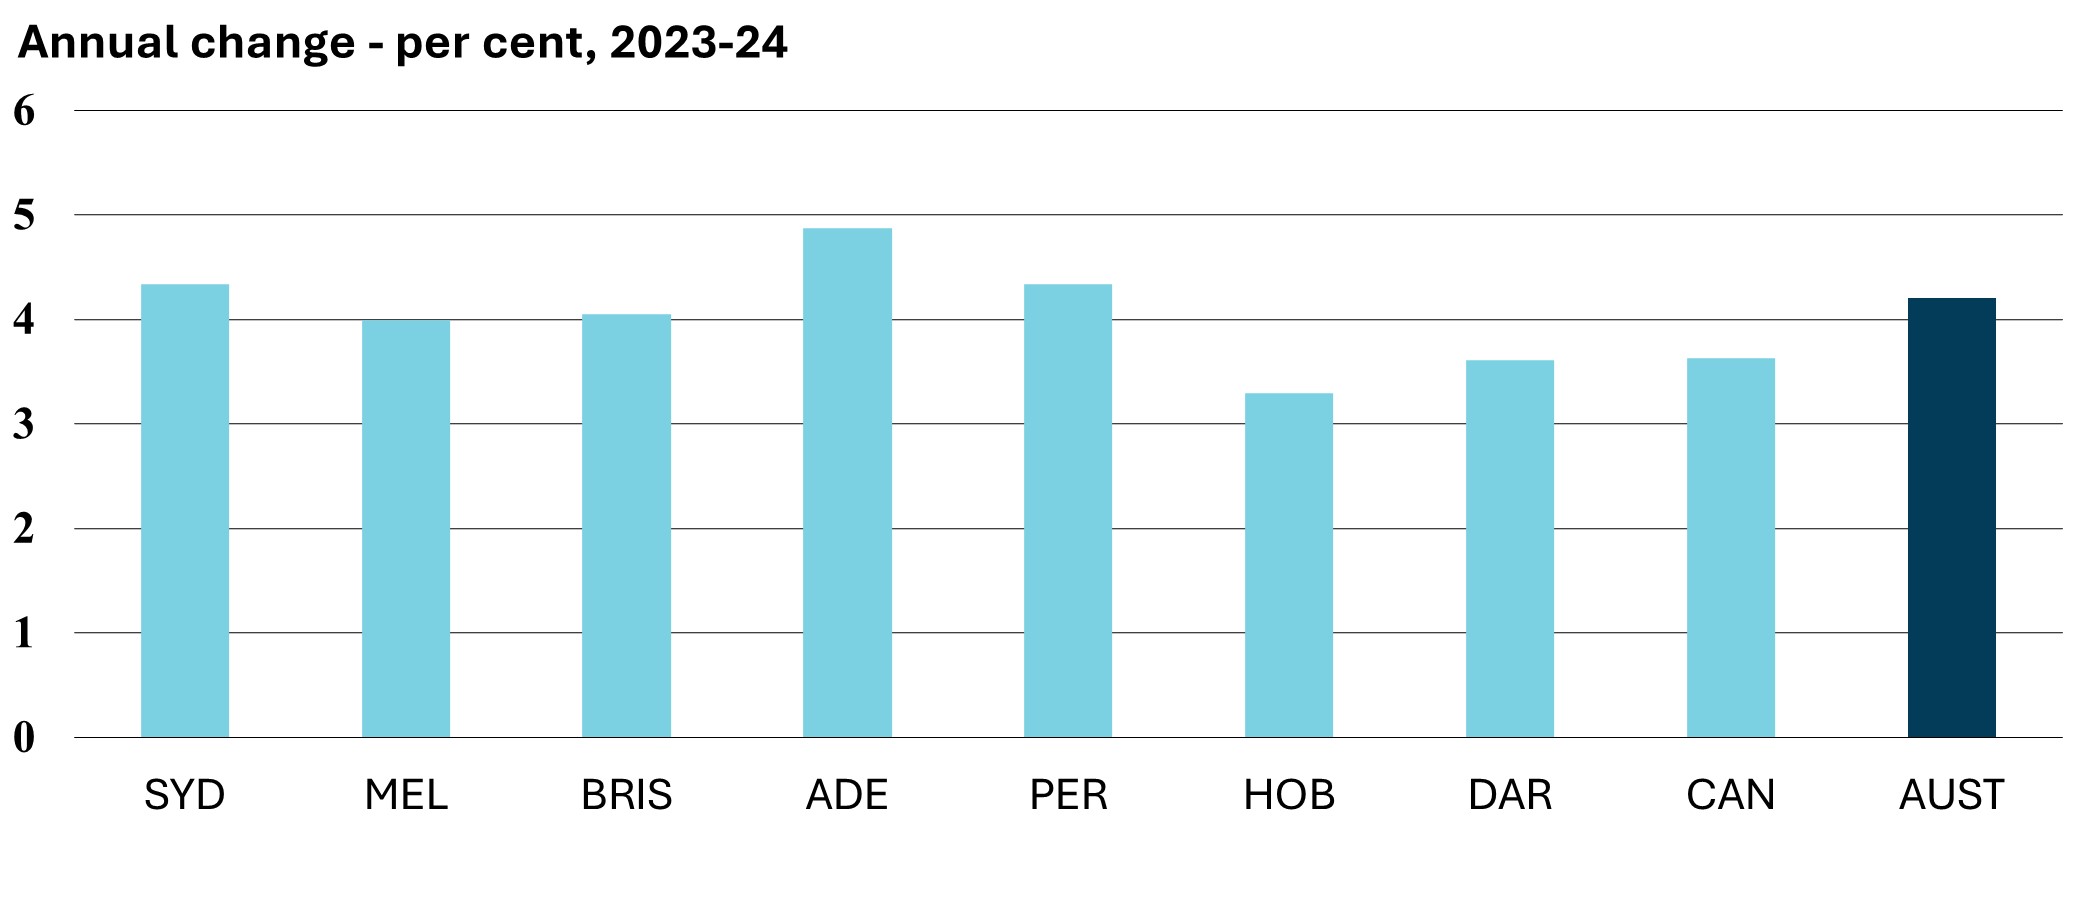
2.6 Consumer price index
| |
2019-20 |
2020-21 |
2021-22 |
2022-23 |
2023-24 |
| Consumer price index (a) |
| Sydney |
116.4 |
118.2 |
122.8 |
131.6 |
137.3 |
| Melbourne |
116.6 |
118.3 |
123.0 |
131.6 |
136.8 |
| Brisbane |
115.4 |
117.8 |
124.1 |
133.2 |
138.6 |
| Adelaide |
115.1 |
116.8 |
121.8 |
131.4 |
137.8 |
| Perth |
112.8 |
114.6 |
121.5 |
129.0 |
134.6 |
| Hobart |
116.1 |
118.2 |
124.0 |
132.9 |
137.3 |
| Darwin |
110.9 |
113.1 |
119.9 |
127.5 |
132.1 |
| Canberra |
114.4 |
116.8 |
122.5 |
130.4 |
135.1 |
Weighted average eight
capital cities |
115.7 |
117.5 |
122.8 |
131.4 |
136.9 |
| Annual change – per cent (b) |
| Sydney |
1.0 |
1.5 |
3.9 |
7.1 |
4.3 |
| Melbourne |
1.7 |
1.4 |
4.0 |
6.9 |
4.0 |
| Brisbane |
1.2 |
2.1 |
5.4 |
7.3 |
4.1 |
| Adelaide |
1.8 |
1.5 |
4.2 |
7.9 |
4.9 |
| Perth |
1.3 |
1.6 |
6.0 |
6.2 |
4.3 |
| Hobart |
2.4 |
1.8 |
5.0 |
7.1 |
3.3 |
| Darwin |
0.2 |
2.0 |
6.0 |
6.4 |
3.6 |
| Canberra |
1.2 |
2.1 |
4.8 |
6.5 |
3.6 |
Weighted average eight
capital cities |
1.3 |
1.6 |
4.4 |
7.0 |
4.2 |
(a) Annual average of quarterly data;
base year for CPI is 2011-12.
(b) Change in the annual averages of
table above.
Source: Australian Bureau of Statistics
(Jun-quarter-2024), Consumer Price Index, Australia
Chapter 3: State
Accounts
3.1 Gross state product
| |
2018-19 |
2019-20 |
2020-21 |
2021-22 |
2022-23 |
| Gross state product, chain volume
measures – $ million |
| New South Wales |
680 189 |
673 316 |
688 693 |
706 732 |
733 087 |
| Victoria |
493 087 |
491 651 |
490 667 |
521 709 |
535 489 |
| Queensland |
423 285 |
418 498 |
430 157 |
454 026 |
464 580 |
| South Australia |
117 925 |
116 749 |
122 455 |
129 272 |
134 209 |
| Western Australia |
376 299 |
380 717 |
393 223 |
404 762 |
418 775 |
| Tasmania |
34 897 |
34 931 |
36 598 |
38 171 |
38 584 |
| Northern Territory |
29 020 |
30 758 |
30 253 |
31 792 |
30 123 |
| Australian Capital Territory |
42 197 |
43 759 |
45 467 |
46 757 |
48 767 |
| Australia |
2 198 775 |
2 191 416 |
2 237 695 |
2 333 221 |
2 403 614 |
| Annual change – per cent |
| New South Wales |
2.6 |
-1.0 |
2.3 |
2.6 |
3.7 |
| Victoria |
3.0 |
-0.3 |
-0.2 |
6.3 |
2.6 |
| Queensland |
0.9 |
-1.1 |
2.8 |
5.5 |
2.3 |
| South Australia |
1.2 |
-1.0 |
4.9 |
5.6 |
3.8 |
| Western Australia |
1.7 |
1.2 |
3.3 |
2.9 |
3.5 |
| Tasmania |
3.7 |
0.1 |
4.8 |
4.3 |
1.1 |
| Northern Territory |
-1.1 |
6.0 |
-1.6 |
5.1 |
-5.3 |
| Australian Capital Territory |
4.2 |
3.7 |
3.9 |
2.8 |
4.3 |
| Australia |
2.2 |
-0.3 |
2.1 |
4.3 |
3.0 |
Note: Gross state product is only
published on a financial year basis. 2023-24 figures will be released on
20/11/2024.
Source: Australian Bureau of Statistics
(2022-23-financial-year), Australian National Accounts: State Accounts
3.2 Gross state product per capita
| |
2018-19 |
2019-20 |
2020-21 |
2021-22 |
2022-23 |
| Gross state product per capita, chain
volume measures (a) – $ |
| New South Wales |
84 986 |
83 245 |
85 084 |
87 238 |
88 932 |
| Victoria |
76 097 |
74 605 |
74 715 |
79 455 |
79 768 |
| Queensland |
83 878 |
81 583 |
82 973 |
86 300 |
86 321 |
| South Australia |
67 166 |
65 629 |
68 239 |
71 590 |
73 145 |
| Western Australia |
142 732 |
141 594 |
144 133 |
146 493 |
147 998 |
| Tasmania |
64 275 |
63 128 |
65 135 |
67 129 |
67 444 |
| Northern Territory |
118 007 |
124 923 |
122 075 |
128 129 |
120 231 |
| Australian Capital Territory |
97 959 |
99 392 |
101 569 |
103 291 |
105 776 |
| Australia |
87 456 |
85 885 |
87 322 |
90 553 |
91 439 |
| Annual change – per cent |
| New South Wales |
1.3 |
-2.0 |
2.2 |
2.5 |
1.9 |
| Victoria |
1.1 |
-2.0 |
0.1 |
6.3 |
0.4 |
| Queensland |
-0.8 |
-2.7 |
1.7 |
4.0 |
0.0 |
| South Australia |
0.0 |
-2.3 |
4.0 |
4.9 |
2.2 |
| Western Australia |
0.3 |
-0.8 |
1.8 |
1.6 |
1.0 |
| Tasmania |
1.5 |
-1.8 |
3.2 |
3.1 |
0.5 |
| Northern Territory |
-0.8 |
5.9 |
-2.3 |
5.0 |
-6.2 |
| Australian Capital Territory |
1.6 |
1.5 |
2.2 |
1.7 |
2.4 |
| Australia |
0.6 |
-1.8 |
1.7 |
3.7 |
1.0 |
Note: Gross state product is only
published on a financial year basis. 2023-24 figures will be released on
20/11/2024.
Source: Australian Bureau of Statistics
(2022-23-financial-year), Australian National Accounts: State Accounts
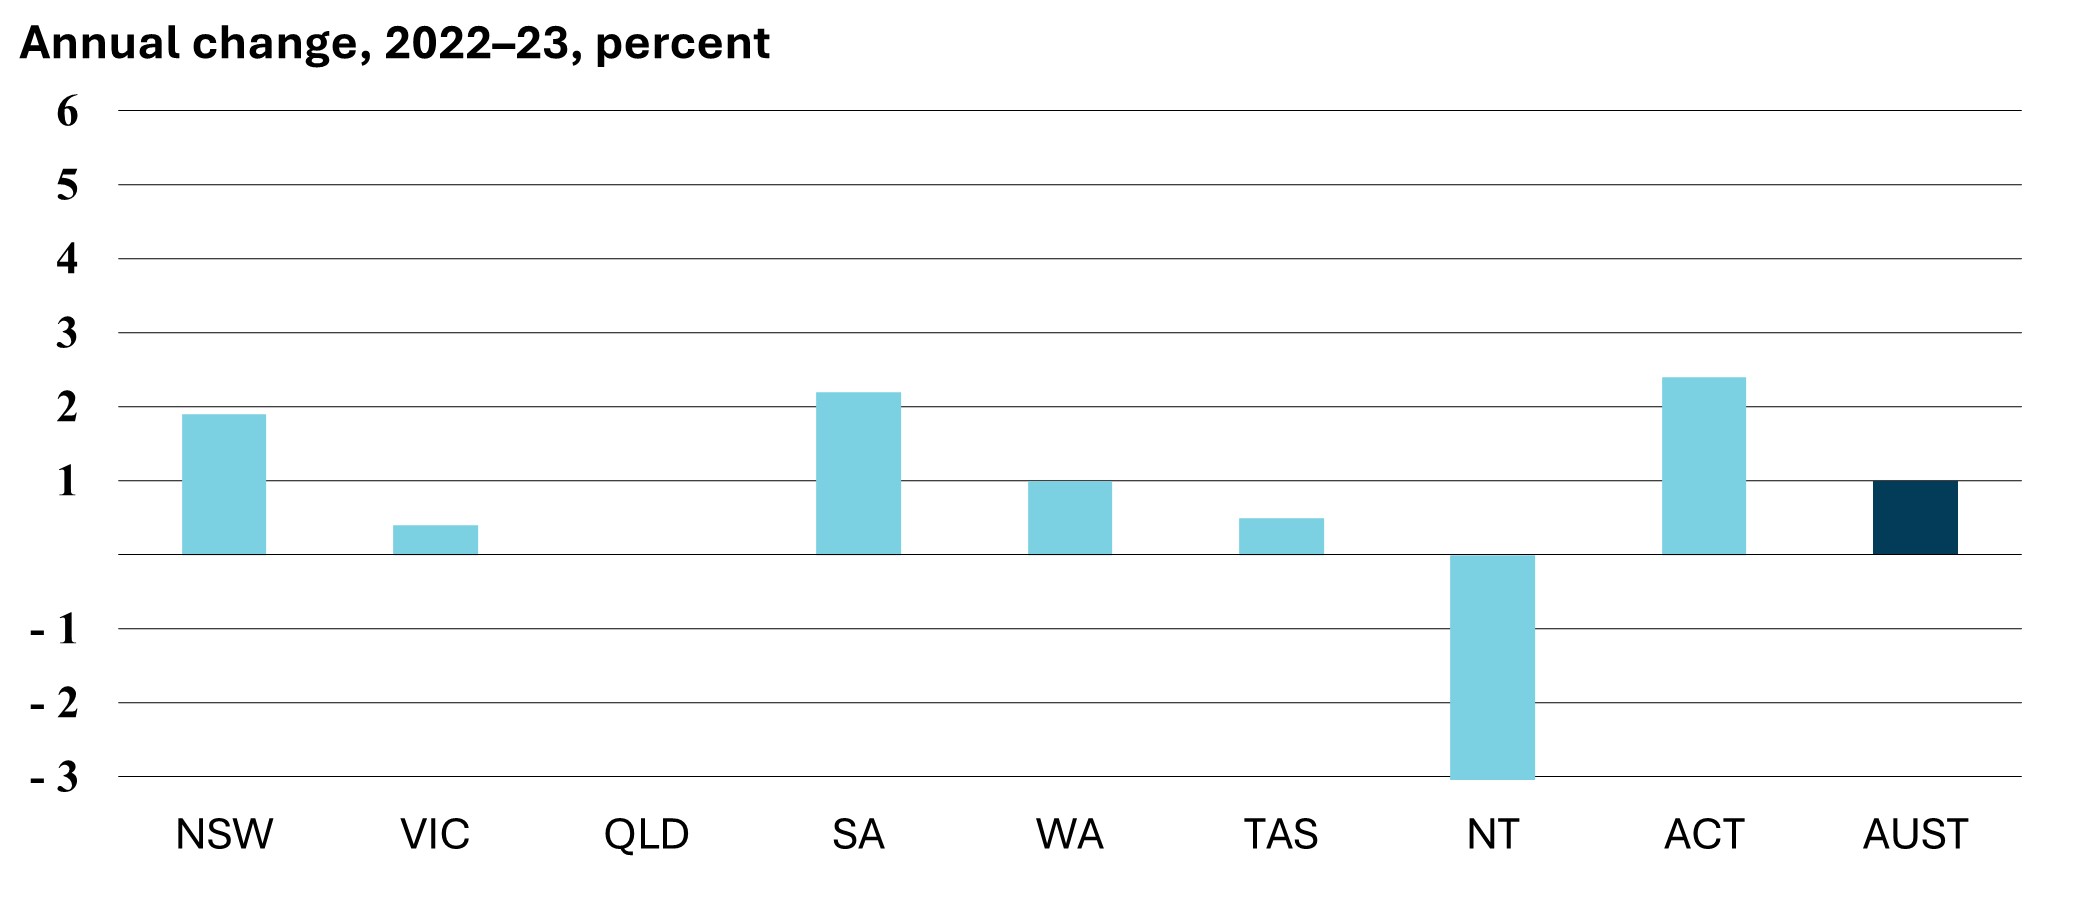
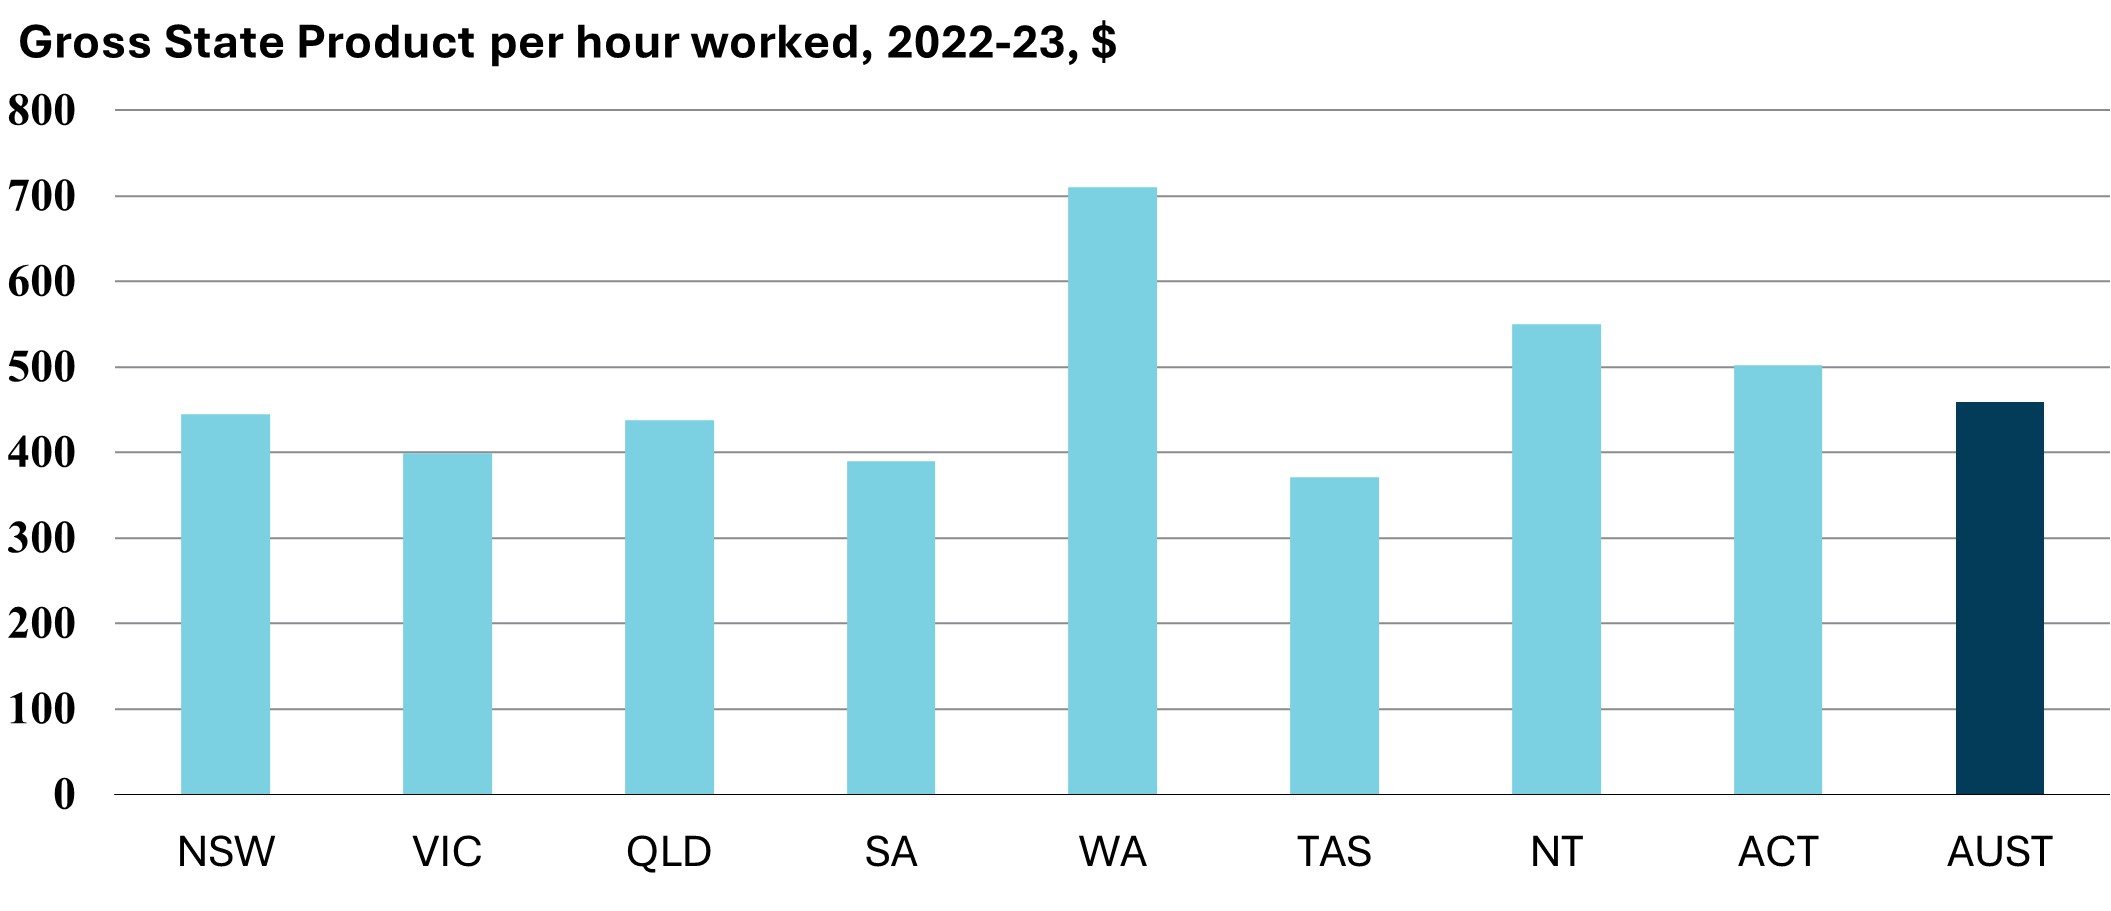
3.3 Labour productivity
| |
2018-19 |
2019-20 |
2020-21 |
2021-22 |
2022-23 |
| Gross State Product per hour worked, $ |
| New South Wales |
429.5 |
432.1 |
445.4 |
461.8 |
444.2 |
| Victoria |
386.1 |
393.4 |
403.7 |
411.3 |
399.4 |
| Queensland |
429.9 |
432.4 |
436.2 |
443.4 |
437.7 |
| South Australia |
361.6 |
370.8 |
380.4 |
387.8 |
389.2 |
| Western Australia |
700.0 |
717.7 |
727.1 |
708.9 |
710.2 |
| Tasmania |
368.6 |
374.2 |
373.6 |
378.1 |
370.8 |
| Northern Territory |
523.6 |
578.2 |
577.8 |
598.2 |
550.1 |
| Australian Capital Territory |
478.0 |
486.4 |
484.8 |
506.8 |
502.2 |
| Australia |
444.4 |
451.1 |
460.9 |
469.2 |
458.4 |
| Annual change – per cent |
| New South Wales |
-1.9 |
0.6 |
3.1 |
3.7 |
-3.8 |
| Victoria |
-2.4 |
1.9 |
2.6 |
1.9 |
-2.9 |
| Queensland |
-1.8 |
0.6 |
0.9 |
1.7 |
-1.3 |
| South Australia |
-3.2 |
2.5 |
2.6 |
1.9 |
0.4 |
| Western Australia |
-2.4 |
2.5 |
1.3 |
-2.5 |
0.2 |
| Tasmania |
0.6 |
1.5 |
-0.2 |
1.2 |
-1.9 |
| Northern Territory |
0.9 |
10.4 |
-0.1 |
3.5 |
-8.0 |
| Australian Capital Territory |
1.6 |
1.8 |
-0.3 |
4.5 |
-0.9 |
| Australia |
-2.0 |
1.5 |
2.2 |
1.8 |
-2.3 |
(a) Gross state product (chain volume
measures) per hour worked, all sectors (i.e. market and non-market sectors).
Note: Gross state product is only
published on a financial year basis. 2023-24 figures will be released on
20/11/2024.
Source: Australian Bureau of Statistics
(2022-23-financial-year), Australian National Accounts: State Accounts;
Australian Bureau of Statistics (December 2023), Labour Force, Australia,
Detailed
Chapter 4:
Business Conditions
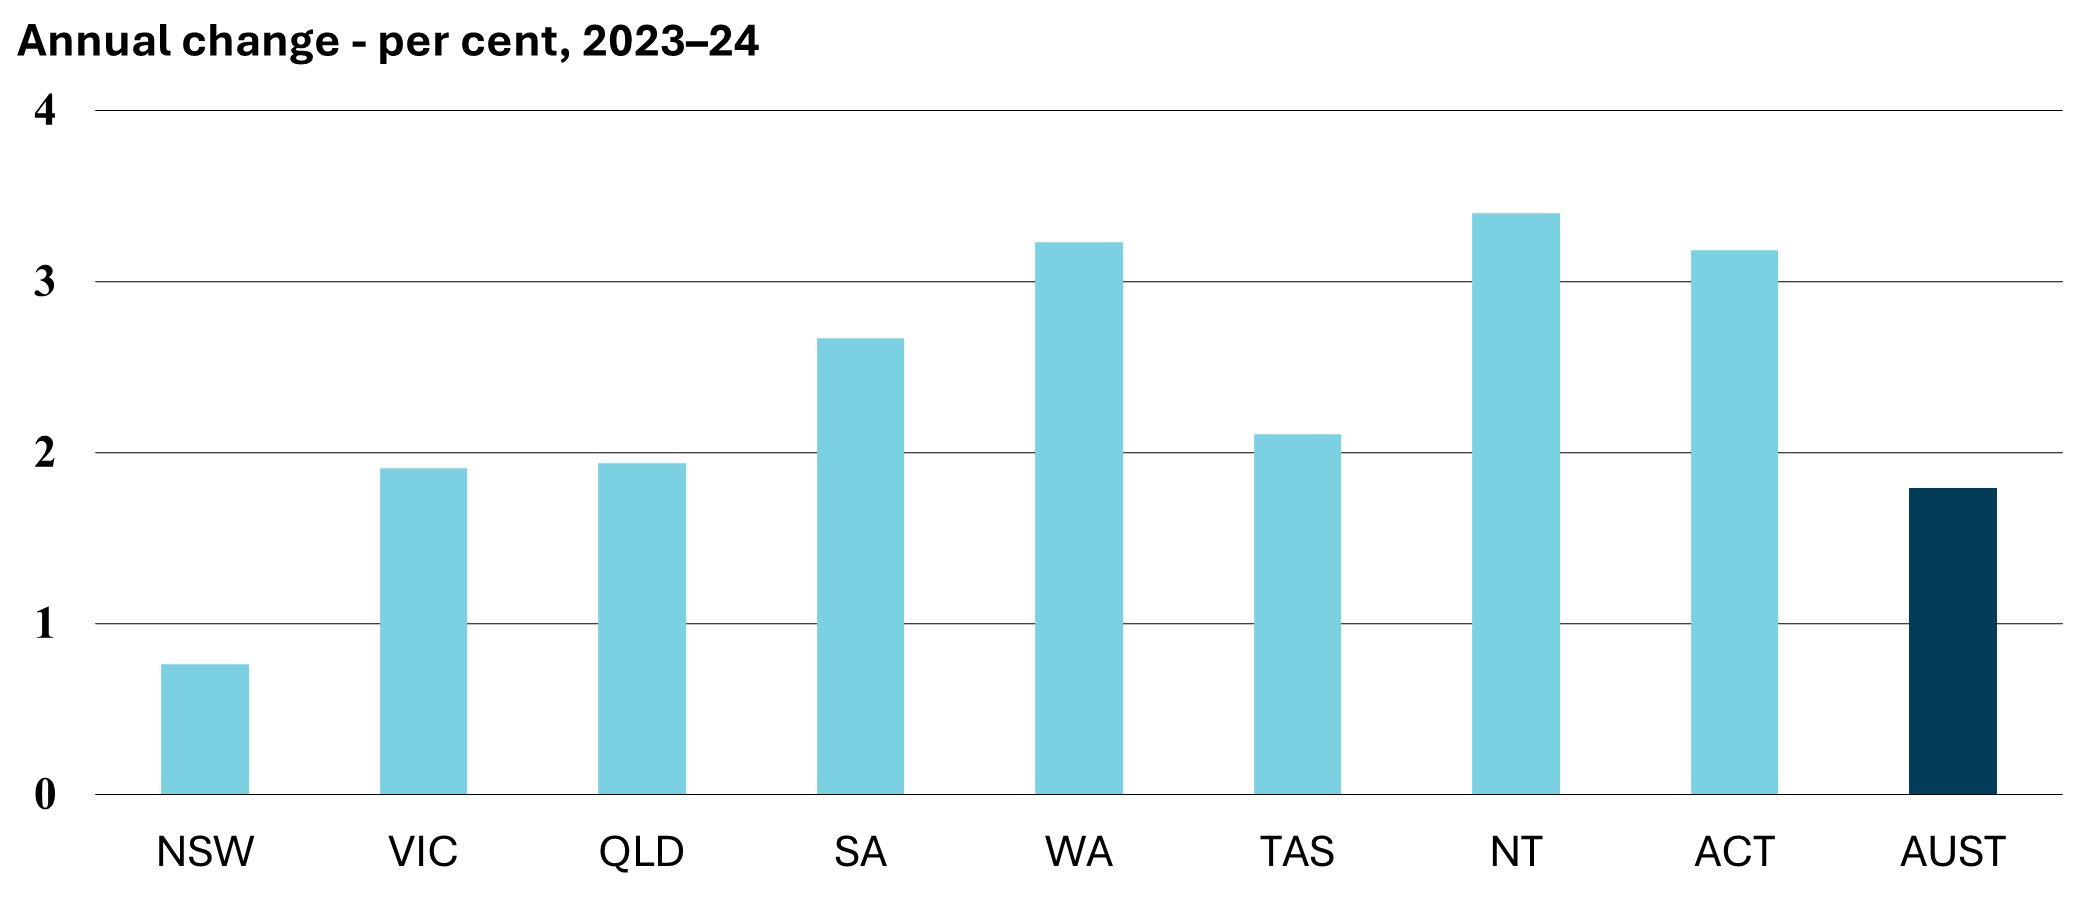
4.1 Value of retail sales
| |
2019-20 |
2020-21 |
2021-22 |
2022-23 |
2023-24 |
| Value (a) – $ million |
| New South Wales |
105 605 |
116 269 |
119 812 |
132 969 |
133 979 |
| Victoria |
86 958 |
89 893 |
99 122 |
108 464 |
110 536 |
| Queensland |
68 690 |
76 579 |
81 031 |
86 497 |
88 173 |
| South Australia |
21 938 |
23 613 |
24 765 |
27 039 |
27 760 |
| Western Australia |
35 880 |
40 753 |
43 643 |
46 822 |
48 334 |
| Tasmania |
6 945 |
7 708 |
7 985 |
8 408 |
8 585 |
| Northern Territory |
3 218 |
3 598 |
3 647 |
3 805 |
3 934 |
| Australian Capital Territory |
6 272 |
7 038 |
6 942 |
7 849 |
8 098 |
| Australia |
335 507 |
365 452 |
386 946 |
421 851 |
429 399 |
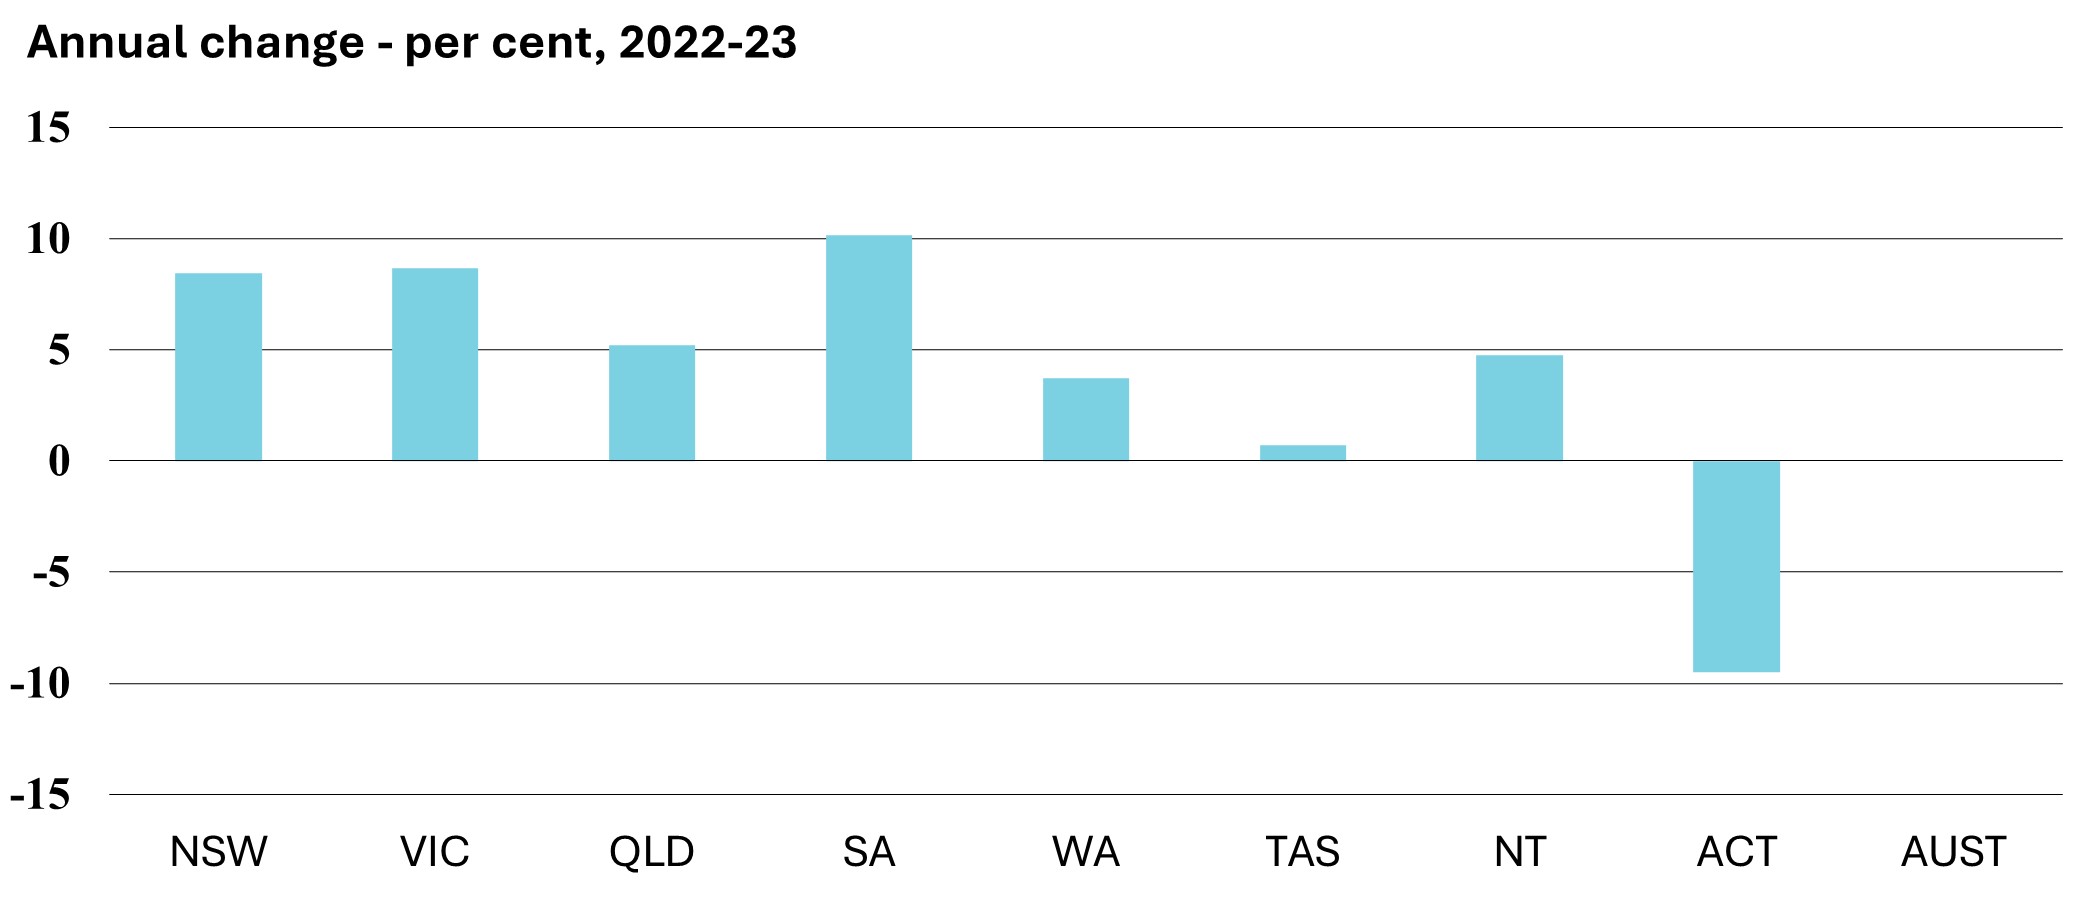
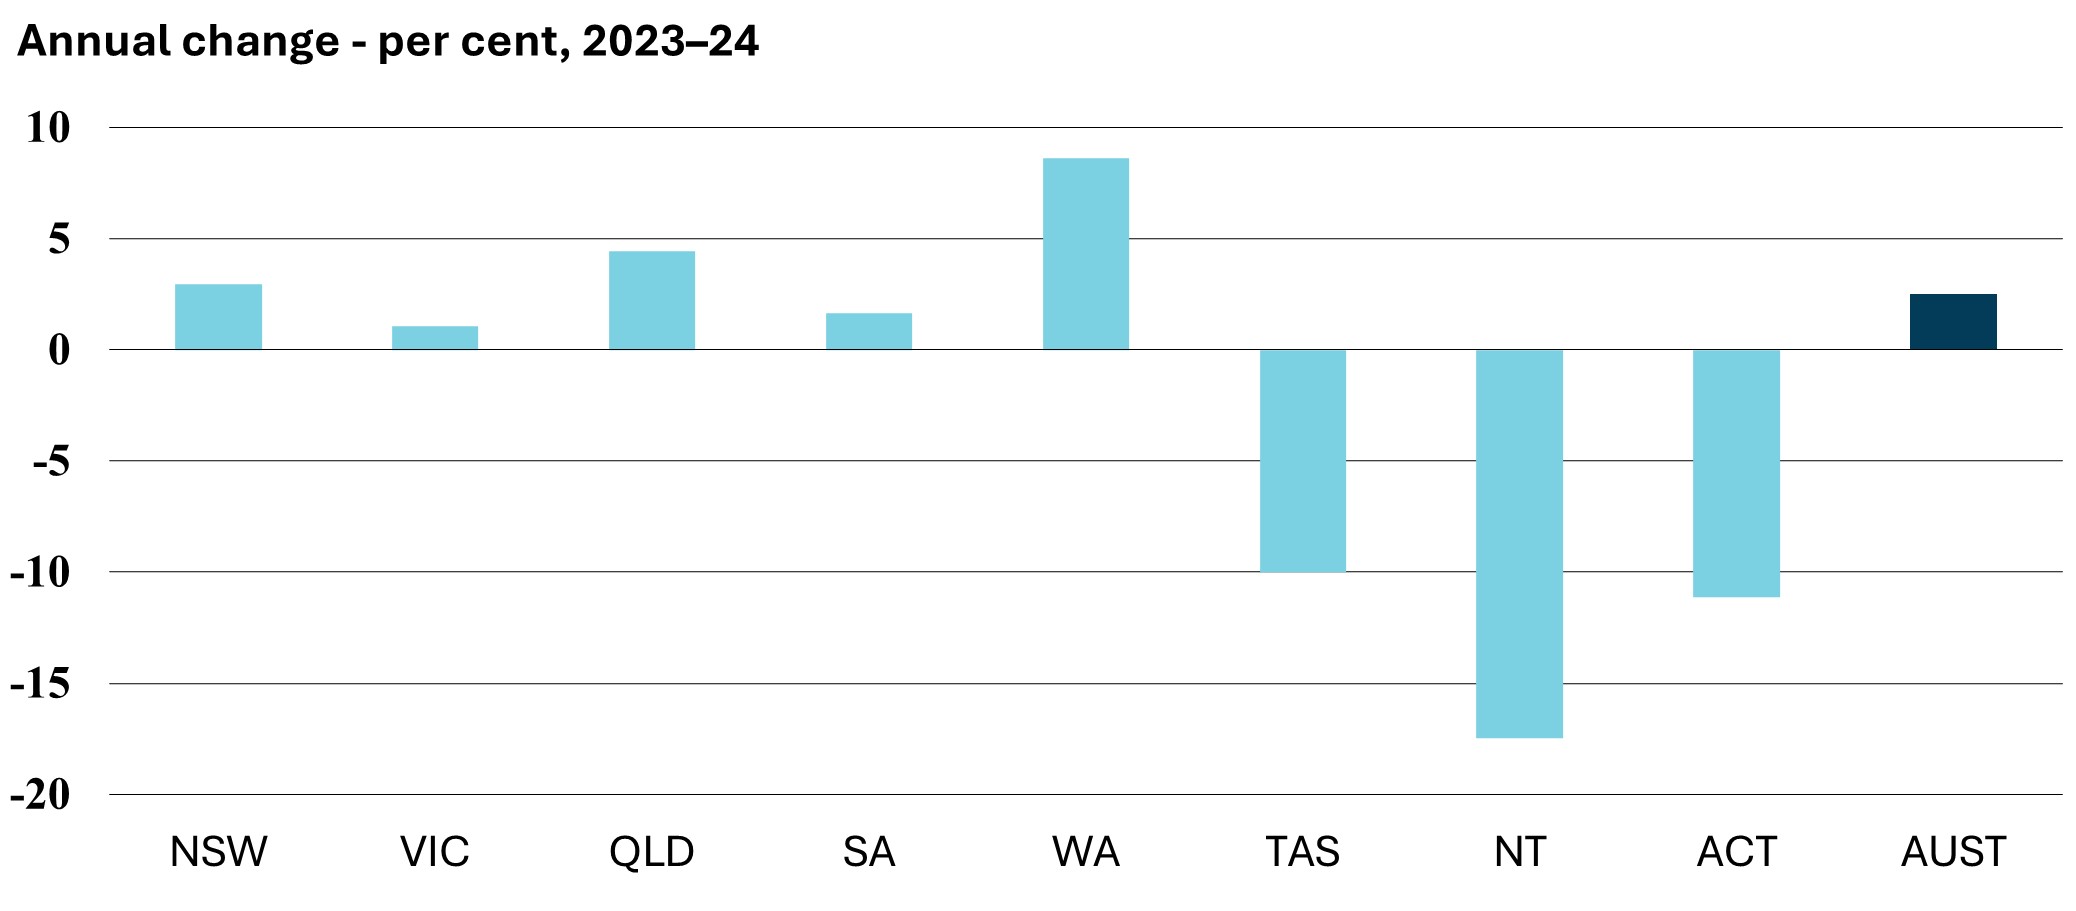
| Annual change – per cent |
| New South Wales |
1.3 |
10.1 |
3.0 |
11.0 |
0.8 |
| Victoria |
2.3 |
3.4 |
10.3 |
9.4 |
1.9 |
| Queensland |
5.9 |
11.5 |
5.8 |
6.7 |
1.9 |
| South Australia |
3.1 |
7.6 |
4.9 |
9.2 |
2.7 |
| Western Australia |
5.2 |
13.6 |
7.1 |
7.3 |
3.2 |
| Tasmania |
6.2 |
11.0 |
3.6 |
5.3 |
2.1 |
| Northern Territory |
3.8 |
11.8 |
1.3 |
4.3 |
3.4 |
| Australian Capital Territory |
4.1 |
12.2 |
-1.4 |
13.1 |
3.2 |
| Australia |
3.2 |
8.9 |
5.9 |
9.0 |
1.8 |
Source: Australian Bureau of Statistics
(August 2024), Retail Trade, Australia
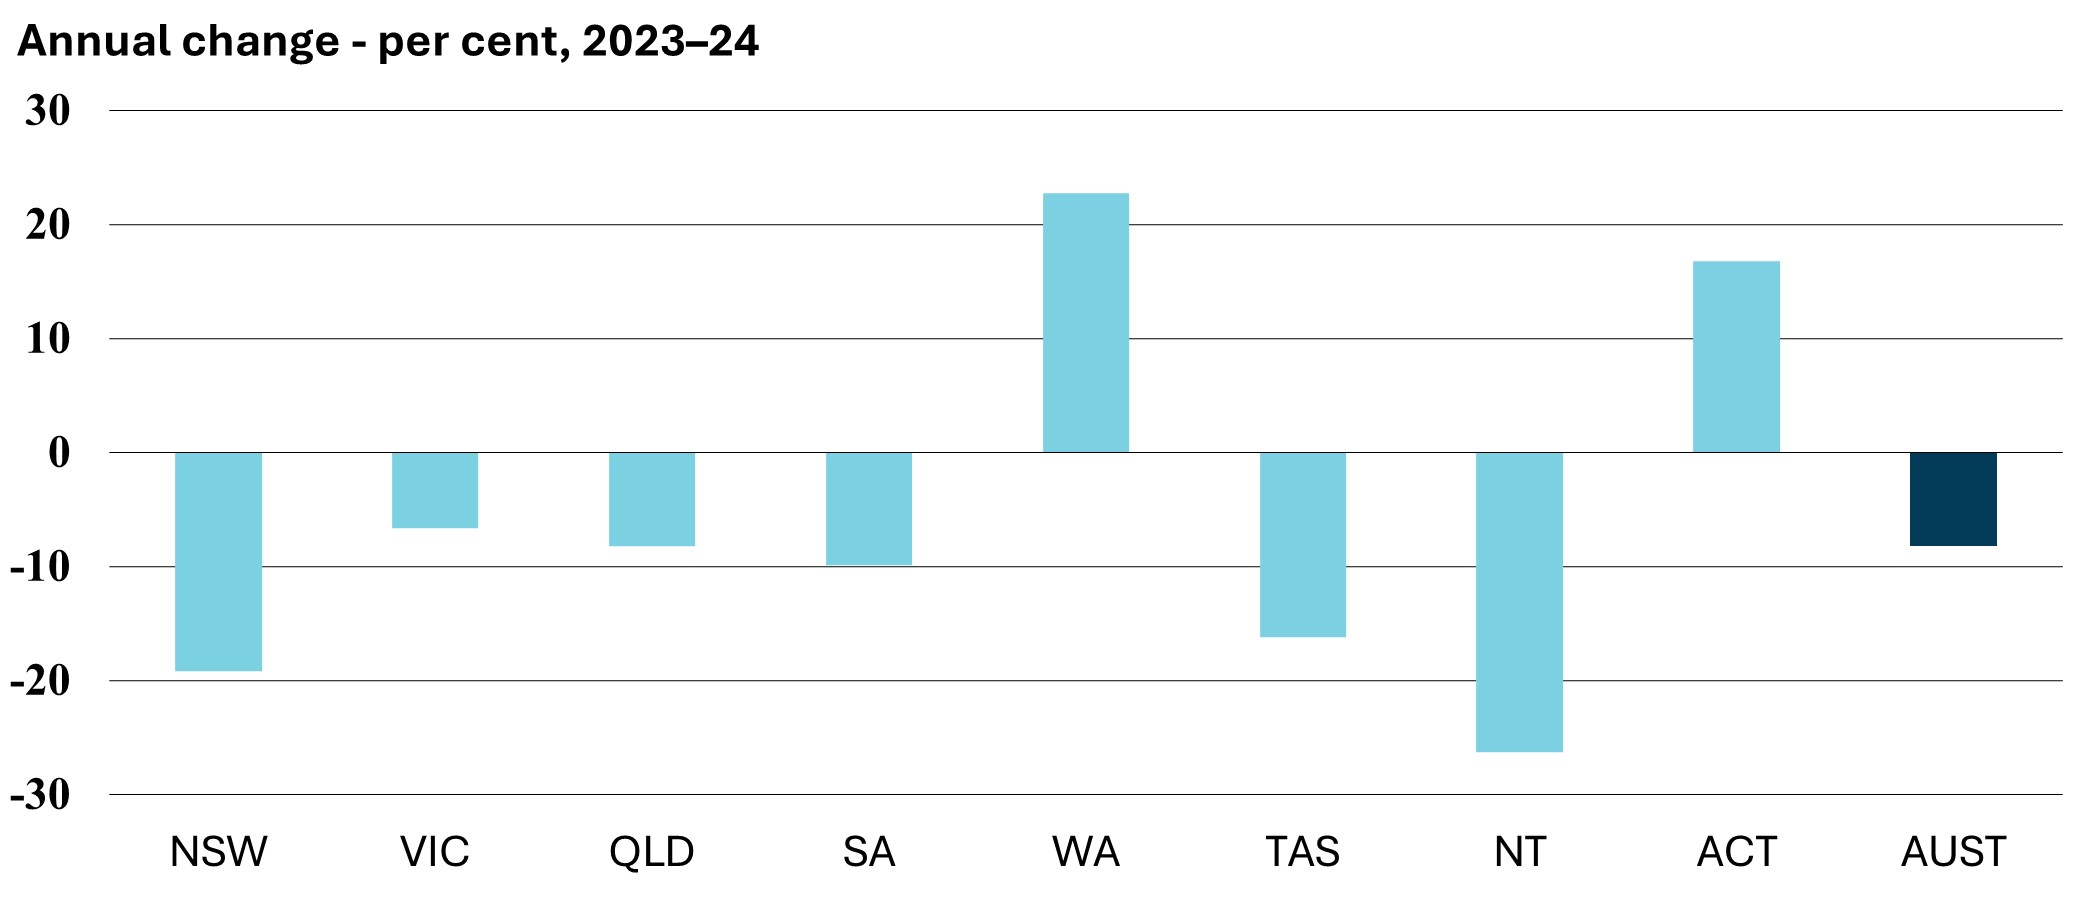
4.2 Dwelling approvals
| |
2019-20 |
2020-21 |
2021-22 |
2022-23 |
2023-24 |
| Number (a) |
| New South Wales |
48 748 |
60 213 |
54 831 |
52 481 |
42 425 |
| Victoria |
60 502 |
68 718 |
65 958 |
55 390 |
51 726 |
| Queensland |
30 492 |
41 914 |
38 493 |
35 873 |
32 929 |
| South Australia |
11 734 |
14 078 |
12 770 |
12 507 |
11 264 |
| Western Australia |
14 344 |
26 947 |
18 902 |
14 161 |
17 378 |
| Tasmania |
3 198 |
4 292 |
3 309 |
3 079 |
2 580 |
| Northern Territory |
582 |
795 |
529 |
589 |
434 |
| Australian Capital Territory |
4 928 |
5 017 |
6 195 |
3 856 |
4 502 |
| Australia |
174 528 |
221 974 |
200 987 |
177 936 |
163 238 |
| Annual change – per cent |
| New South Wales |
-15.9 |
23.5 |
-8.9 |
-4.3 |
-19.2 |
| Victoria |
0.3 |
13.6 |
-4.0 |
-16.0 |
-6.6 |
| Queensland |
-8.1 |
37.5 |
-8.2 |
-6.8 |
-8.2 |
| South Australia |
9.0 |
20.0 |
-9.3 |
-2.1 |
-9.9 |
| Western Australia |
-7.1 |
87.9 |
-29.9 |
-25.1 |
22.7 |
| Tasmania |
-0.7 |
34.2 |
-22.9 |
-7.0 |
-16.2 |
| Northern Territory |
-14.4 |
36.6 |
-33.5 |
11.3 |
-26.3 |
| Australian Capital Territory |
-20.3 |
1.8 |
23.5 |
-37.8 |
16.8 |
| Australia |
-7.0 |
27.2 |
-9.5 |
-11.5 |
-8.3 |
(a) Houses and other dwellings (e.g.
flats) intended for long-term residential use; includes both private and
public sector dwellings.
Source: Australian Bureau of Statistics
(August 2024), Building Approvals, Australia
4.3 Business investment
| |
2018-19 |
2019-20 |
2020-21 |
2021-22 |
2022-23 |
| Chain volume measures (a) – $ million |
| New South Wales |
68 884 |
66 655 |
69 167 |
72 002 |
78 088 |
| Victoria |
54 312 |
53 021 |
51 103 |
56 553 |
61 461 |
| Queensland |
46 060 |
44 185 |
42 941 |
46 948 |
49 403 |
| South Australia |
13 701 |
13 129 |
13 471 |
16 068 |
17 702 |
| Western Australia |
38 184 |
42 062 |
45 018 |
47 168 |
48 916 |
| Tasmania |
3 313 |
3 208 |
3 416 |
3 842 |
3 870 |
| Northern Territory |
3 504 |
2 742 |
3 087 |
4 151 |
4 348 |
| Australian Capital Territory |
2 882 |
3 339 |
2 964 |
3 596 |
3 255 |
| Australia |
220 736 |
217 883 |
220 154 |
234 731 |
234 731 |
| Annual change – per cent |
| New South Wales |
5.8 |
-3.2 |
3.8 |
4.1 |
8.5 |
| Victoria |
7.4 |
-2.4 |
-3.6 |
10.7 |
8.7 |
| Queensland |
-8.0 |
-4.1 |
-2.8 |
9.3 |
5.2 |
| South Australia |
-1.4 |
-4.2 |
2.6 |
19.3 |
10.2 |
| Western Australia |
-8.3 |
10.2 |
7.0 |
4.8 |
3.7 |
| Tasmania |
2.0 |
-3.2 |
6.5 |
12.5 |
0.7 |
| Northern Territory |
-59.6 |
-21.7 |
12.6 |
34.5 |
4.7 |
| Australian Capital Territory |
3.6 |
15.9 |
-11.2 |
21.3 |
-9.5 |
| Australia |
-2.0 |
-1.3 |
1.0 |
6.6 |
0.0 |
(a) Private business gross fixed capital
formation for other buildings and structures, machinery and equipment,
livestock and intangible fixed assets.
Note: National account data is only
available for financial years. 2023-24 figures will be released on
20/11/2024.
Source: Australian Bureau of Statistics
(2022-23-financial-year), Australian National Accounts: State Accounts
Chapter 5: Housing
5.1 Lending for owner occupied housing
| |
2019-20 |
2020-21 |
2021-22 |
2022-23 |
2023-24 |
| Value (a) – $ million |
| New South Wales |
53 797 |
77 032 |
84 667 |
61 744 |
63 560 |
| Victoria |
49 341 |
66 653 |
75 869 |
57 197 |
57 802 |
| Queensland |
28 112 |
45 005 |
47 184 |
38 557 |
40 272 |
| South Australia |
9 017 |
13 139 |
13 534 |
11 494 |
11 682 |
| Western Australia |
13 061 |
24 155 |
24 274 |
20 329 |
22 084 |
| Tasmania |
2 589 |
3 621 |
3 355 |
3 087 |
2 777 |
| Northern Territory |
713 |
1 242 |
1 303 |
1 124 |
928 |
| Australian Capital Territory |
4 125 |
5 762 |
6 150 |
5 078 |
4 513 |
| Australia |
160 755 |
236 609 |
256 335 |
198 610 |
203 618 |
| Annual change – per cent |
| New South Wales |
13.5 |
43.2 |
9.9 |
-27.1 |
2.9 |
| Victoria |
9.7 |
35.1 |
13.8 |
-24.6 |
1.1 |
| Queensland |
5.6 |
60.1 |
4.8 |
-18.3 |
4.4 |
| South Australia |
0.2 |
45.7 |
3.0 |
-15.1 |
1.6 |
| Western Australia |
2.4 |
84.9 |
0.5 |
-16.3 |
8.6 |
| Tasmania |
-1.4 |
39.9 |
-7.3 |
-8.0 |
-10.0 |
| Northern Territory |
-11.8 |
74.2 |
4.8 |
-13.7 |
-17.5 |
| Australian Capital Territory |
9.8 |
39.7 |
6.7 |
-17.4 |
-11.1 |
| Australia |
8.6 |
47.2 |
8.3 |
-22.5 |
2.5 |
(a) Lending commitments by all types of
lenders for the construction and purchase of new or established owner
occupied dwellings excluding refinancing.
Source: Australian Bureau of Statistics
(August 2024), Lending indicators
Chapter 6: Public Sector
Finances
6.1 General government sector fiscal balance
| |
2018-19 |
2019-20 |
2020-21 |
2021-22 |
2022-23 |
| General government sector fiscal
balance (a) – $ million |
| New South Wales |
-8 456 |
-18 781 |
-16 806 |
-25 800 |
-24 807 |
| Victoria |
-6 049 |
-17 576 |
-27 778 |
-30 149 |
-21 977 |
| Queensland |
-2 883 |
-10 171 |
-6 856 |
136 |
5 884 |
| South Australia |
196 |
-2 908 |
-2 702 |
-3 048 |
-1 632 |
| Western Australia |
279 |
- 169 |
4 077 |
2 837 |
2 503 |
| Tasmania |
- 231 |
- 770 |
- 542 |
- 687 |
- 828 |
| Northern Territory |
- 867 |
-1 230 |
- 878 |
- 657 |
- 482 |
| Australian Capital Territory |
-1 419 |
-1 076 |
- 760 |
- 913 |
-1 310 |
| Total (b) |
-19 459 |
-52 669 |
-52 233 |
-58 278 |
-42 687 |
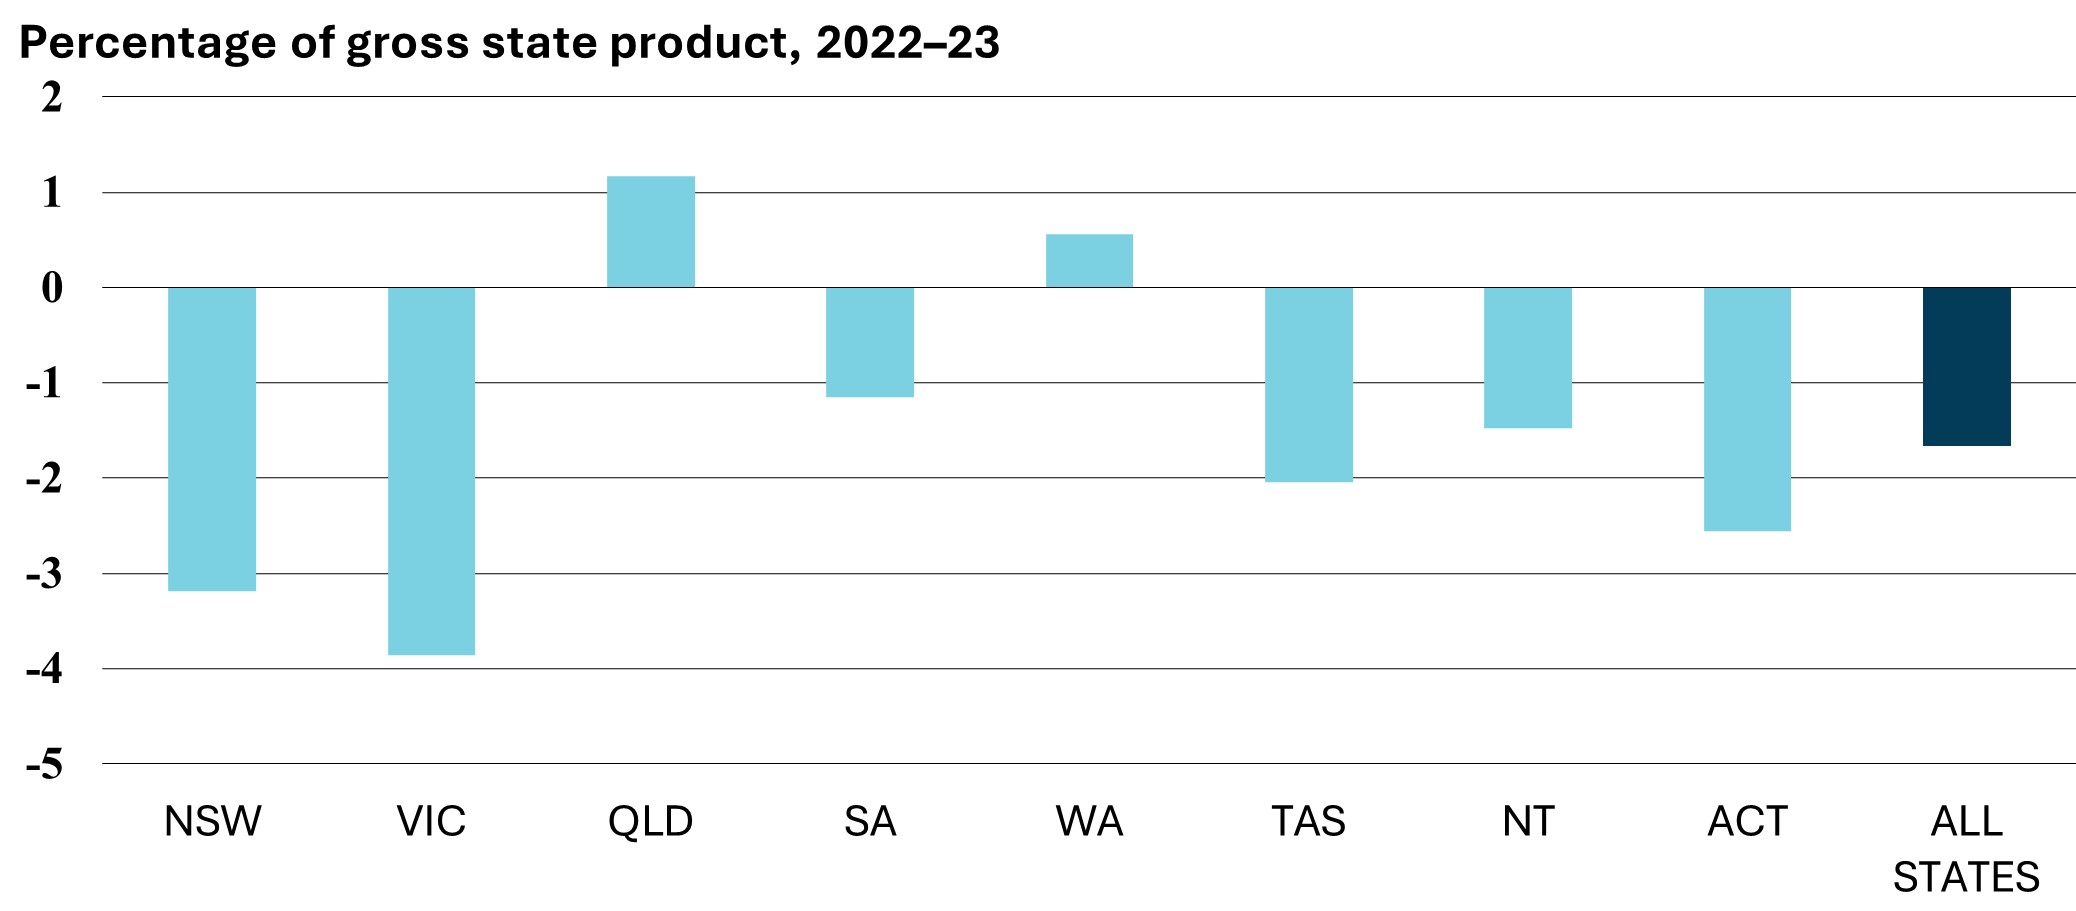
| General government sector fiscal
balance – percentage of gross state product |
| New South Wales |
-1.3 |
-3.0 |
-2.6 |
-3.7 |
-3.2 |
| Victoria |
-1.3 |
-3.7 |
-5.8 |
-5.8 |
-3.9 |
| Queensland |
-0.8 |
-2.8 |
-1.9 |
0.0 |
1.2 |
| South Australia |
0.2 |
-2.6 |
-2.3 |
-2.4 |
-1.1 |
| Western Australia |
0.1 |
-0.1 |
1.1 |
0.7 |
0.6 |
| Tasmania |
-0.7 |
-2.3 |
-1.5 |
-1.8 |
-2.0 |
| Northern Territory |
-3.4 |
-4.6 |
-3.5 |
-2.1 |
-1.5 |
| Australian Capital Territory |
-3.5 |
-2.5 |
-1.7 |
-2.0 |
-2.6 |
| Total (c) |
-1.0 |
-2.7 |
-2.5 |
-2.5 |
-1.7 |
(a) The financing requirement of
government. A positive sign, or fiscal surplus, indicates a net lending
position; a negative sign, or fiscal deficit, indicates a net borrowing
position.
(b) The sum of all state and territory
jurisdictions may not agree with the total, due to transfers between
jurisdictions.
Note: The 2023-24 Government Finance
Statistics publication will be released in April 2025.
Sources: Australian Bureau of Statistics
(2022-23), Government Finance Statistics, Annual
6.2 State and local government taxation revenue
| |
2019-20 |
2019-20 |
2020-21 |
2021-22 |
2022-23 |
| General government sector taxation
revenue – $ million |
| New South Wales |
36 064 |
35 660 |
39 150 |
44 826 |
45 604 |
| Victoria |
29 195 |
28 934 |
29 665 |
36 996 |
38 935 |
| Queensland |
18 293 |
18 361 |
20 514 |
24 562 |
25 518 |
| South Australia |
6 207 |
6 244 |
6 661 |
7 445 |
7 859 |
| Western Australia |
10 978 |
11 489 |
12 472 |
14 173 |
15 059 |
| Tasmania |
1 604 |
1 691 |
1 811 |
1 999 |
2 093 |
| Northern Territory |
801 |
633 |
676 |
892 |
872 |
| Australian Capital Territory |
1 934 |
1 949 |
2 059 |
2 424 |
2 587 |
| Total (a) |
105 076 |
104 960 |
113 007 |
133 316 |
138 529 |
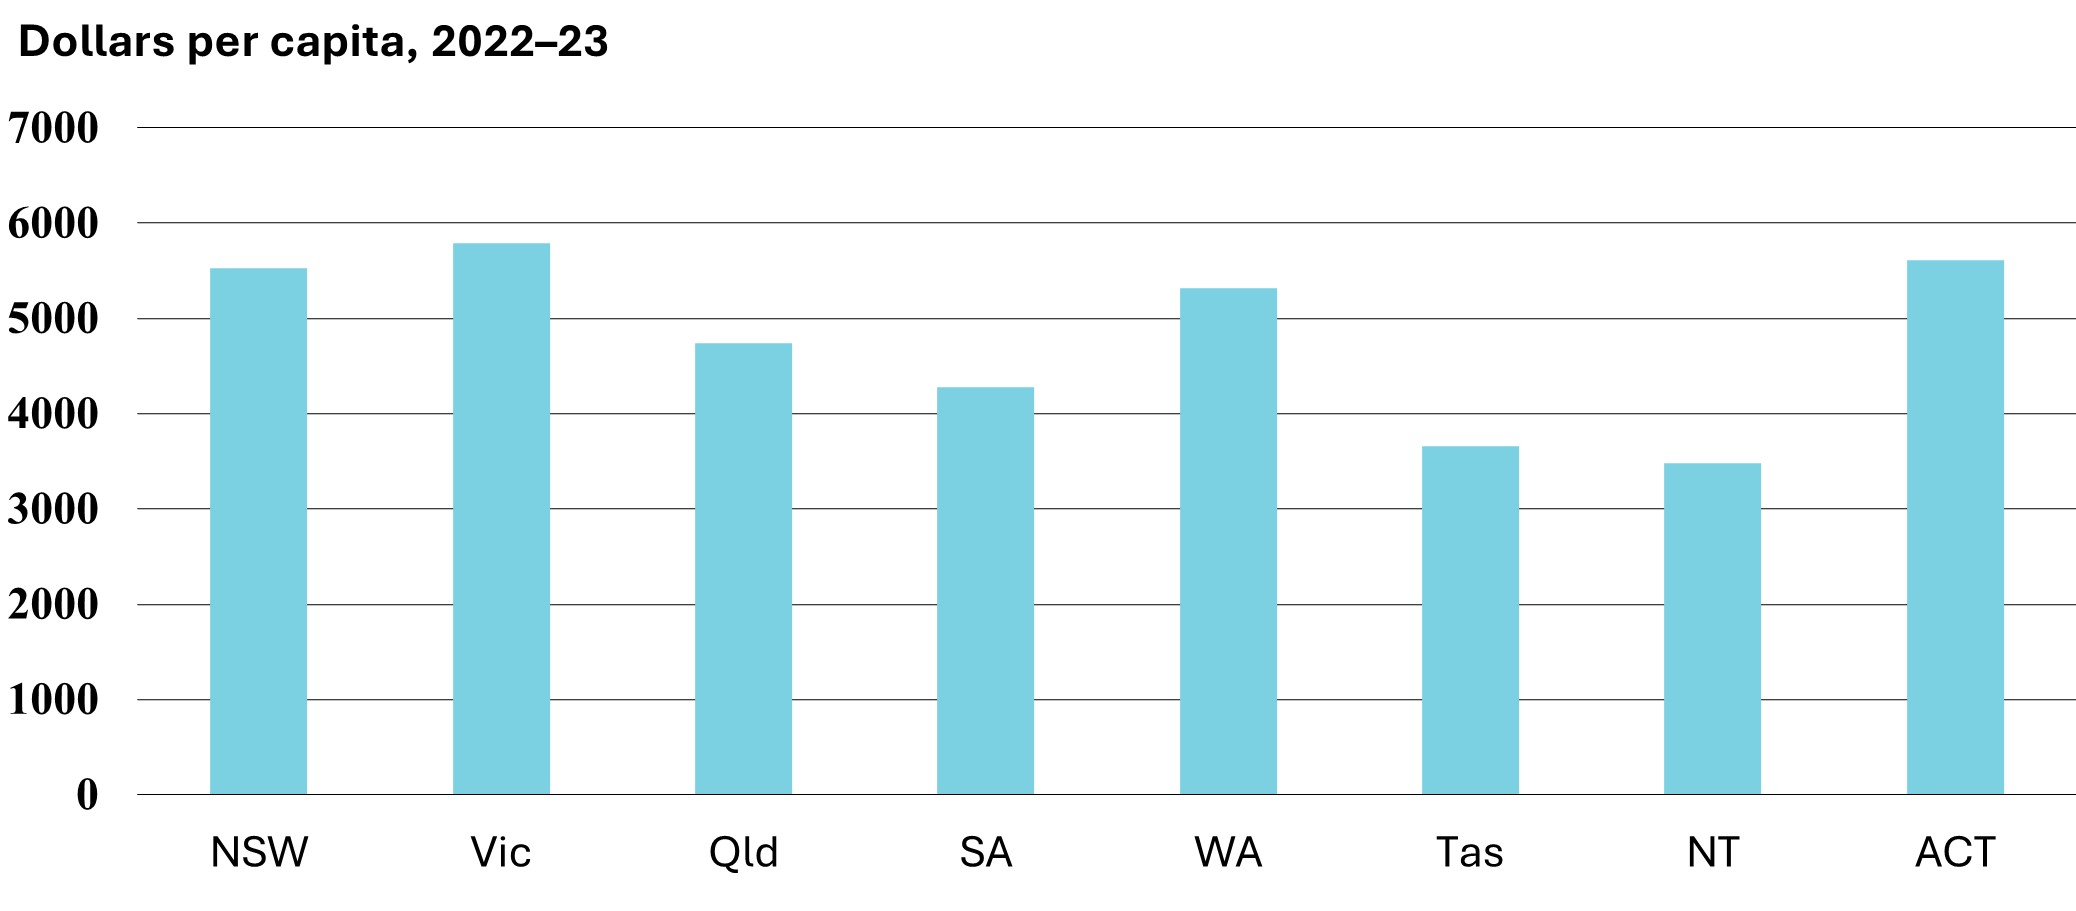
| General government sector taxation
revenue per capita - $ |
| New South Wales |
4 506 |
4 409 |
4 837 |
5 533 |
5 529 |
| Victoria |
4 506 |
4 391 |
4 517 |
5 634 |
5 795 |
| Queensland |
3 625 |
3 579 |
3 957 |
4 669 |
4 738 |
| South Australia |
3 535 |
3 510 |
3 712 |
4 123 |
4 281 |
| Western Australia |
4 164 |
4 273 |
4 572 |
5 130 |
5 315 |
| Tasmania |
2 954 |
3 056 |
3 223 |
3 515 |
3 658 |
| Northern Territory |
3 257 |
2 571 |
2 728 |
3 595 |
3 477 |
| Australian Capital Territory |
4 490 |
4 427 |
4 600 |
5 355 |
5 610 |
| Commonwealth |
18 128 |
17 542 |
18 768 |
21 366 |
23 496 |
(a) Total is the sum of taxation revenue
from all state and local government sources, not taxation revenue for
Australia as it excludes Commonwealth taxation.
Source: Australian Bureau of Statistics
(2022-23), Taxation Revenue, Australia
Chapter 7: Exports
7.1 Merchandise exports
| |
2018-19 |
2019-20 |
2020-21 |
2021-22 |
2022-23 |
| Merchandise exports (a) – $ million |
| New South Wales |
53 820 |
48 747 |
44 883 |
80 708 |
97 781 |
| Victoria |
28 148 |
28 340 |
25 171 |
31 728 |
33 706 |
| Queensland |
87 249 |
76 248 |
57 890 |
119 976 |
128 759 |
| South Australia |
11 716 |
11 129 |
12 734 |
14 600 |
17 421 |
| Western Australia |
162 318 |
184 337 |
223 001 |
240 382 |
268 983 |
| Tasmania |
3 658 |
3 645 |
3 821 |
4 740 |
4 402 |
| Northern Territory |
9 412 |
12 387 |
9 405 |
17 108 |
16 061 |
| Australian Capital Territory |
17 |
81 |
55 |
125 |
33 |
| Australia (b) |
372 621 |
381 989 |
395 024 |
531 126 |
590 440 |
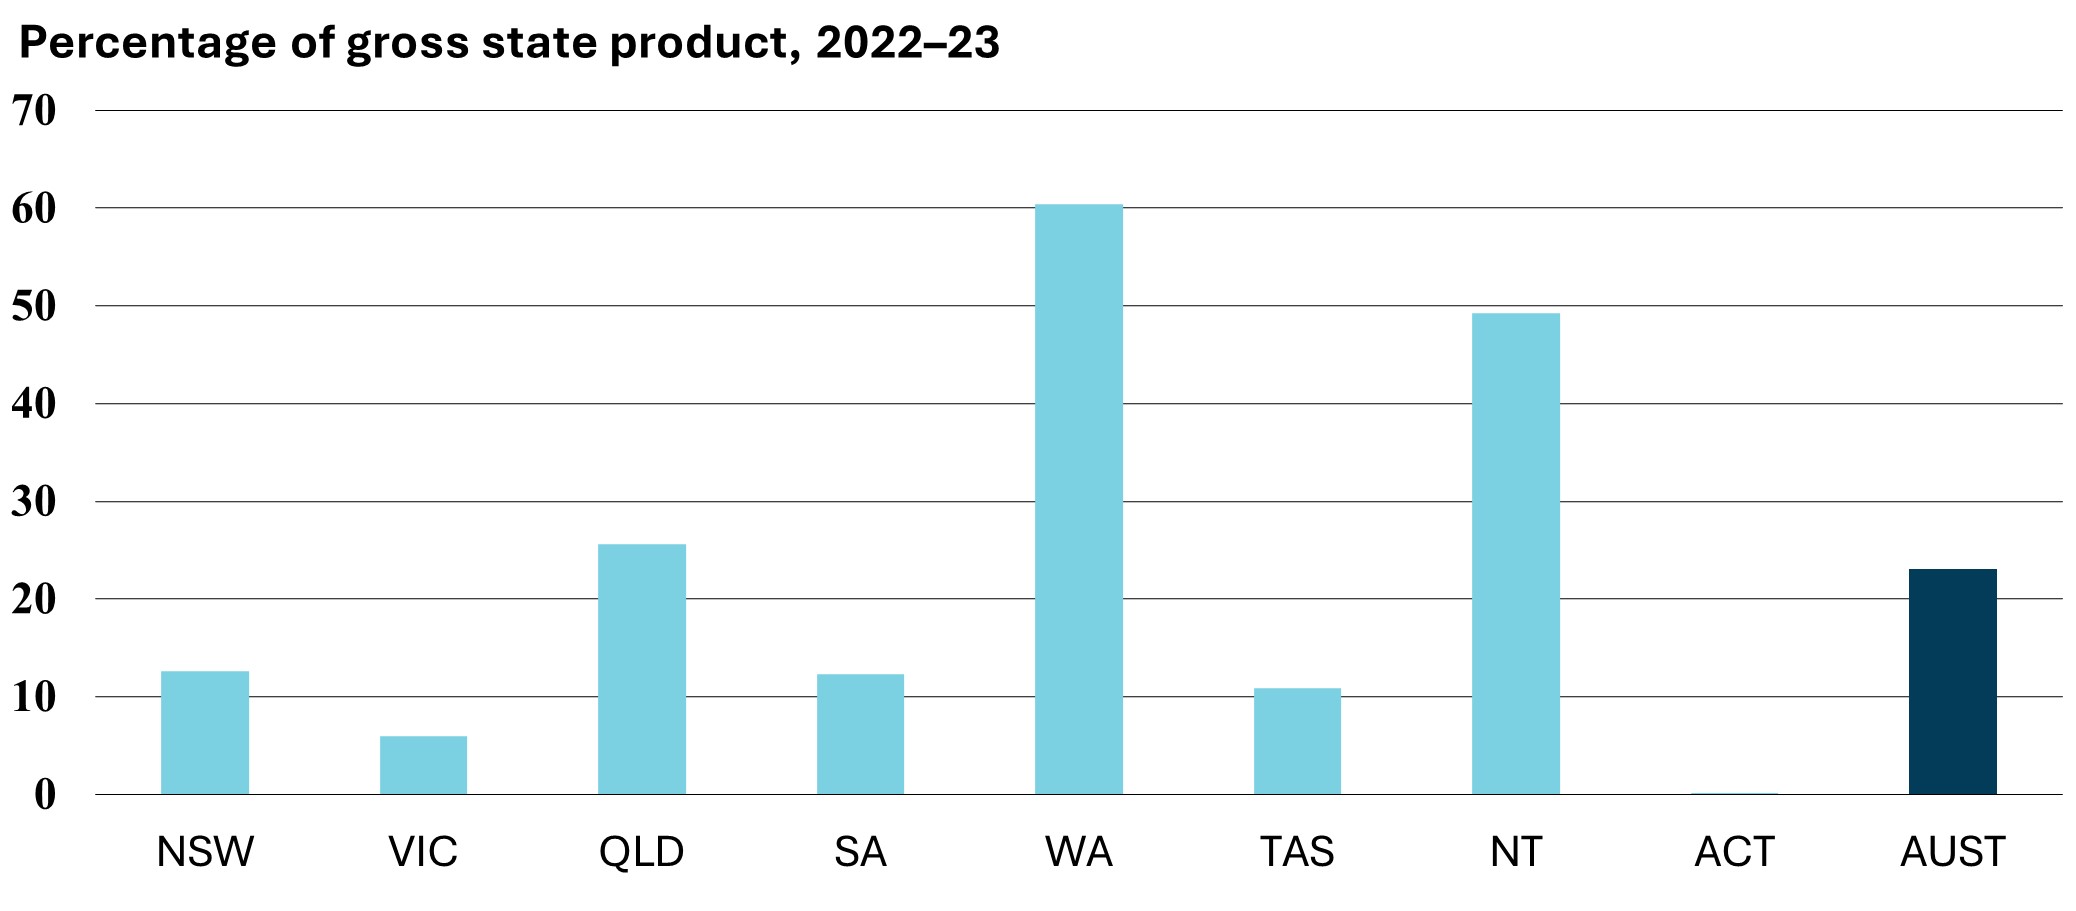
| Merchandise exports – percentage of
gross state product |
| New South Wales |
8.6 |
7.8 |
6.9 |
11.4 |
12.6 |
| Victoria |
6.1 |
6.0 |
5.3 |
6.1 |
5.9 |
| Queensland |
23.8 |
21.1 |
15.7 |
26.4 |
25.6 |
| South Australia |
10.7 |
10.1 |
10.7 |
11.3 |
12.3 |
| Western Australia |
56.6 |
58.9 |
60.8 |
59.4 |
60.4 |
| Tasmania |
11.4 |
11.1 |
10.9 |
12.4 |
10.9 |
| Northern Territory |
37.4 |
46.6 |
37.4 |
53.8 |
49.3 |
| Australian Capital Territory |
0.0 |
0.2 |
0.1 |
0.3 |
0.1 |
| Australia (b) |
19.1 |
19.2 |
18.9 |
22.8 |
23.1 |
(a) State in which the final stage of
manufacture or production occurs. FOB value.
(b) Includes re-exports and state figures
not available for publication. Australian total, therefore, may not equal sum
of states and territories.
Sources: Australian Bureau of Statistics
(September 2023), International Trade in Goods and Services, Australia;
Australian Bureau of Statistics (2022-23-financial-year), Australian National
Accounts: State Accounts
Chapter 8: Social
Statistics
8.1 Population
| |
2017-18 |
2018-19 |
2019-20 |
2021-22 |
2022-23 |
| Population (a) – '000 |
| New South Wales |
8 046.7 |
8 110.6 |
8 097.1 |
8 166.7 |
8 339.3 |
| Victoria |
6 537.3 |
6 615.0 |
6 547.8 |
6 630.6 |
6 812.5 |
| Queensland |
5 088.8 |
5 165.6 |
5 215.8 |
5 320.9 |
5 459.4 |
| South Australia |
1 767.4 |
1 790.4 |
1 802.6 |
1 821.2 |
1 851.7 |
| Western Australia |
2 659.6 |
2 712.9 |
2 749.4 |
2 791.8 |
2 878.6 |
| Tasmania |
547.8 |
557.6 |
567.2 |
571.1 |
572.8 |
| Northern Territory |
246.6 |
247.4 |
248.2 |
250.2 |
252.5 |
| Australian Capital Territory |
435.7 |
444.9 |
452.5 |
456.9 |
466.8 |
| Australia |
25 334.8 |
25 649.2 |
25 685.4 |
26 014.4 |
26 638.5 |
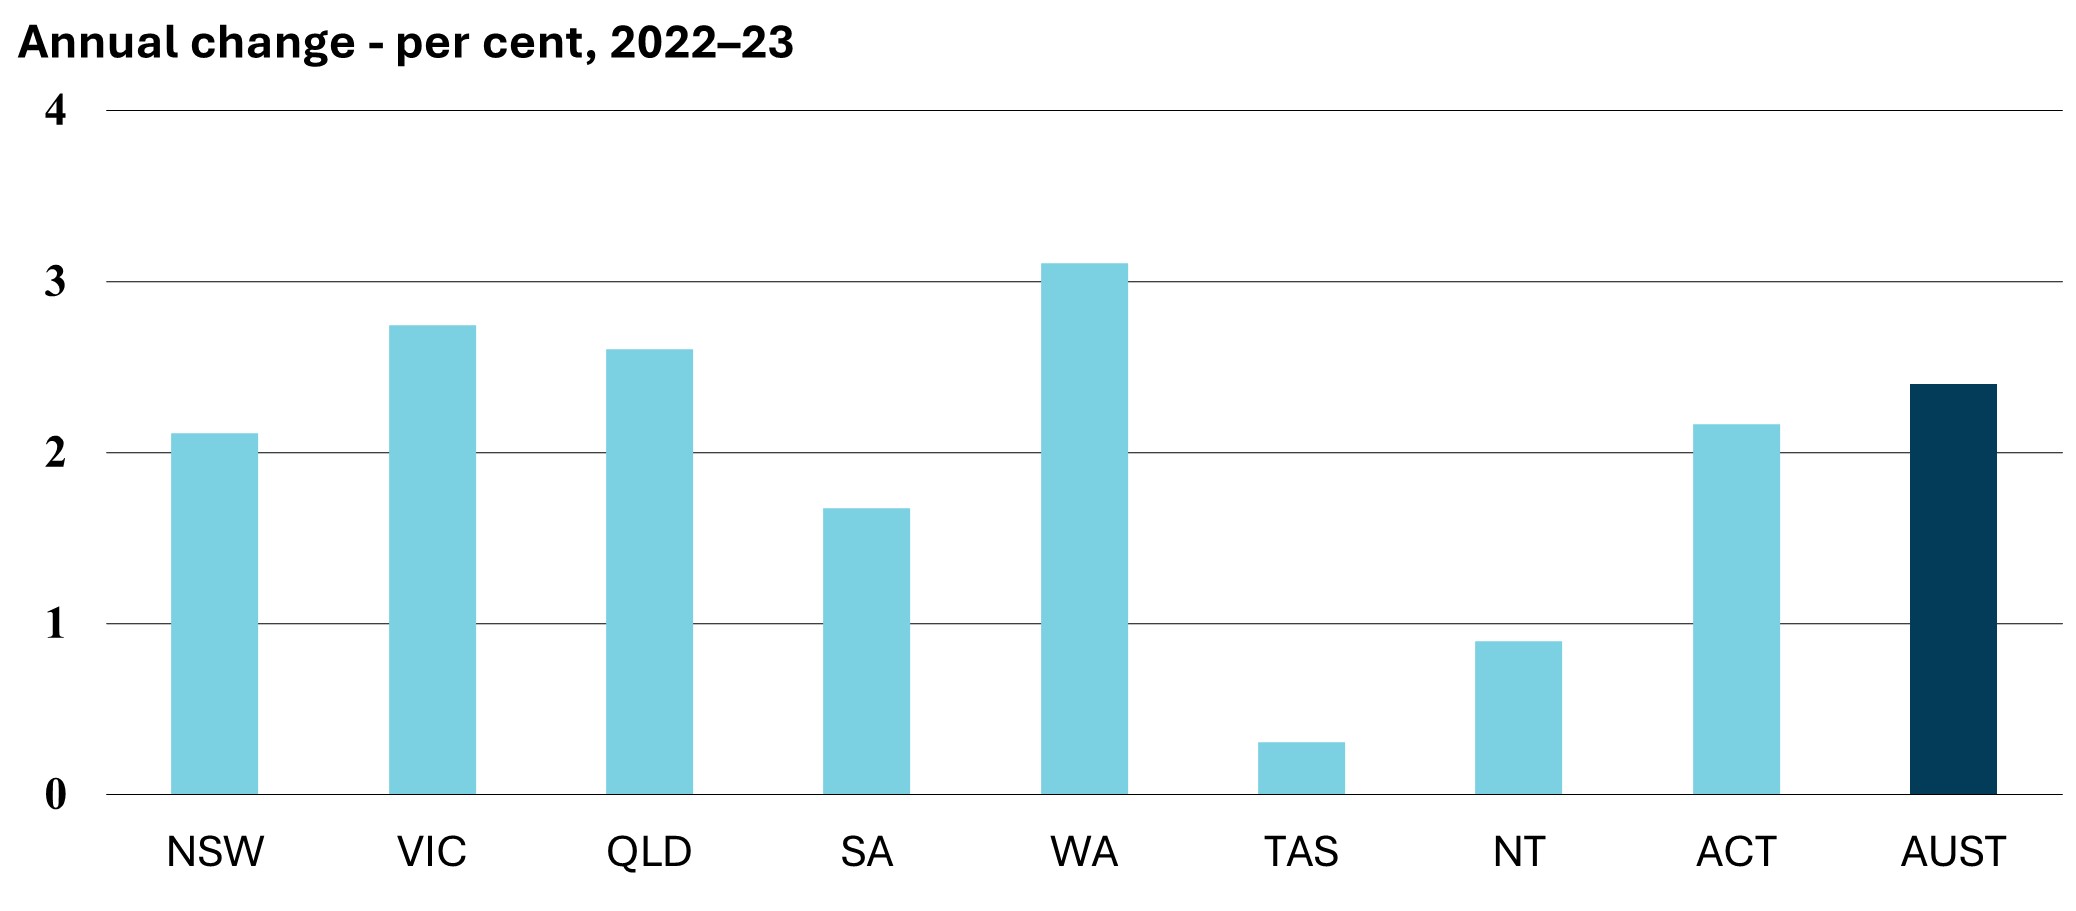
| Annual change – per cent |
| New South Wales |
1.2 |
0.8 |
-0.2 |
0.9 |
2.1 |
| Victoria |
1.8 |
1.2 |
-1.0 |
1.3 |
2.7 |
| Queensland |
1.6 |
1.5 |
1.0 |
2.0 |
2.6 |
| South Australia |
1.2 |
1.3 |
0.7 |
1.0 |
1.7 |
| Western Australia |
1.6 |
2.0 |
1.3 |
1.5 |
3.1 |
| Tasmania |
2.0 |
1.8 |
1.7 |
0.7 |
0.3 |
| Northern Territory |
-0.2 |
0.4 |
0.3 |
0.8 |
0.9 |
| Australian Capital Territory |
2.3 |
2.1 |
1.7 |
1.0 |
2.2 |
| Australia |
1.5 |
1.2 |
0.1 |
1.3 |
2.4 |
(a) Estimated resident population numbers
are as at June of each year.
Note: June 2024 population figures will
be released in December 2024.
Source: Australian Bureau of Statistics
(June 2023), National, state and territory population
8.2 Capped apparent school retention rates
| |
2019 |
2020 |
2021 |
2022 |
2023 |
| Apparent retention rates from Year 10
to Year 12 (a) |
| New South Wales |
75.8 |
77.5 |
76.3 |
73.2 |
73.0 |
| Victoria |
83.3 |
83.9 |
83.9 |
82.1 |
81.9 |
| Queensland |
88.1 |
83.7 |
83.2 |
81.0 |
80.7 |
| South Australia |
89.1 |
88.6 |
87.1 |
86.0 |
85.0 |
| Western Australia |
85.5 |
85.8 |
85.6 |
82.0 |
82.0 |
| Tasmania |
74.3 |
73.9 |
74.5 |
71.7 |
69.0 |
| Northern Territory |
64.1 |
70.4 |
67.5 |
62.6 |
61.8 |
| Australian Capital Territory |
89.8 |
90.1 |
89.7 |
87.8 |
87.7 |
| Australia |
82.0 |
82.1 |
81.6 |
79.0 |
78.7 |
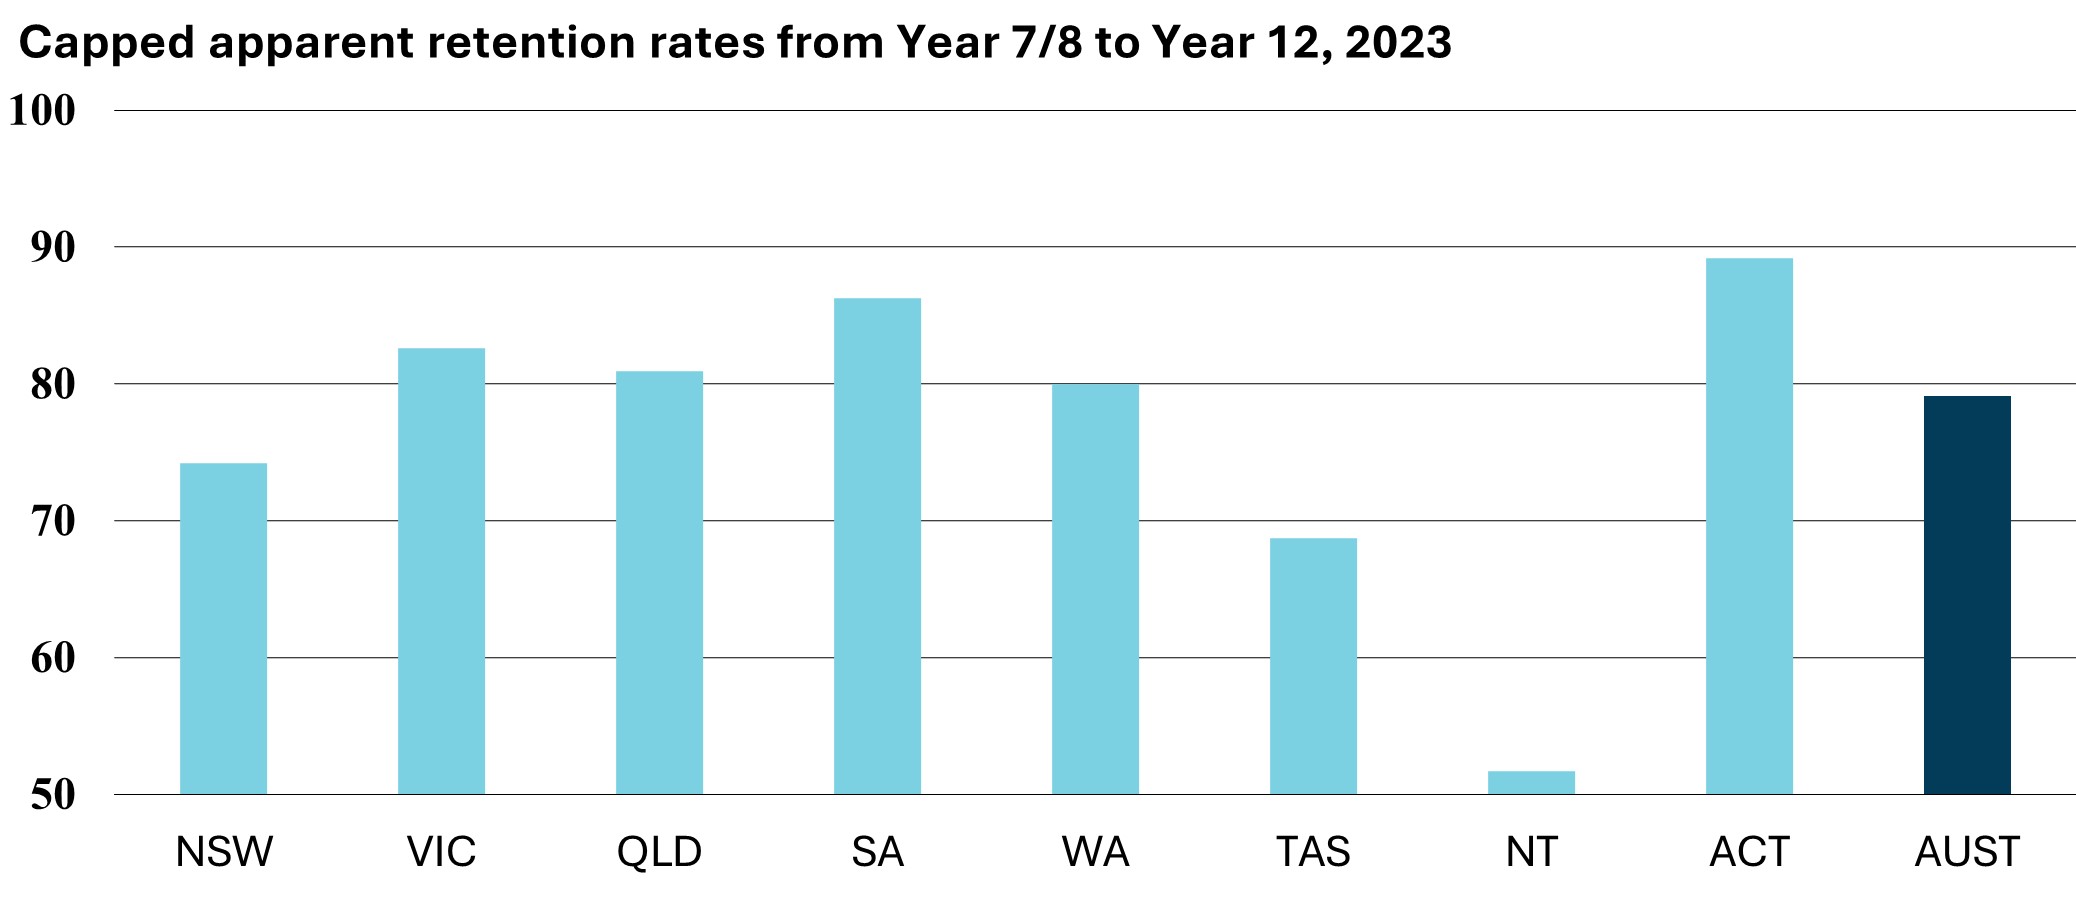
| Apparent retention rates from Year 7/8
to Year 12 (b) |
| New South Wales |
77.1 |
78.4 |
77.1 |
75.5 |
74.2 |
| Victoria |
87.4 |
87.6 |
87.5 |
84.5 |
82.6 |
| Queensland |
91.3 |
85.3 |
85.3 |
82.2 |
80.9 |
| South Australia |
93.4 |
92.7 |
91.1 |
88.3 |
86.3 |
| Western Australia |
83.5 |
83.9 |
83.6 |
80.5 |
80.0 |
| Tasmania |
75.5 |
74.9 |
75.7 |
72.3 |
68.7 |
| Northern Territory |
54.3 |
57.8 |
56.8 |
54.2 |
51.7 |
| Australian Capital Territory |
94.0 |
91.9 |
90.9 |
87.9 |
89.2 |
| Australia |
84.0 |
83.6 |
83.1 |
80.5 |
79.1 |
(a) The number of full-time school
students in Year 12 expressed as a percentage of the corresponding group at
the commencement of their Year 10 schooling.
(b) The number of full-time school
students in Year 12 expressed as a percentage of the corresponding group at
the commencement of their secondary schooling.
Source: Australian Bureau of Statistics
(2023), Schools
8.3 General practice bulk billing
| |
2020-21
|
2021-22
|
2021-22
|
2022-23
|
2023-24
|
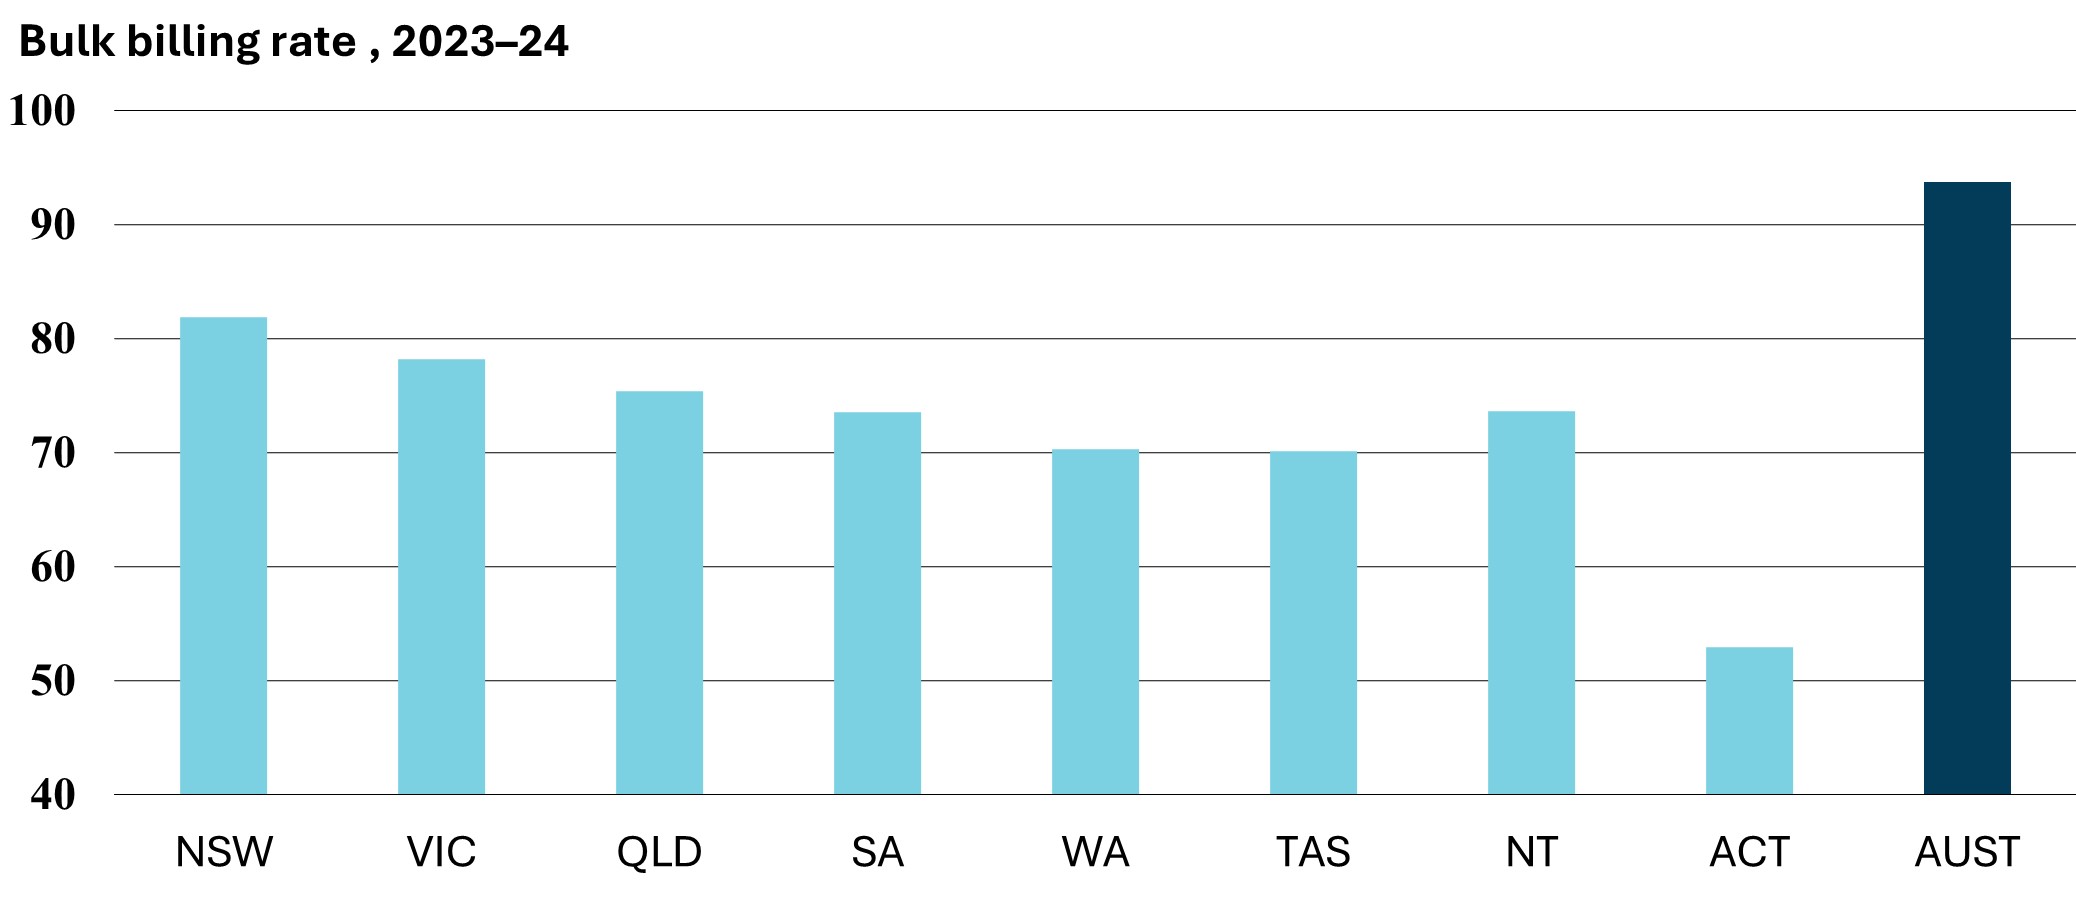
| General practice bulk billing rate (a)
– per cent |
| New South Wales |
89.8
|
90.7
|
91.0
|
84.2
|
81.9
|
| Victoria |
87.2
|
89.4
|
88.6
|
80.9
|
78.2
|
| Queensland |
87.2
|
88.1
|
87.2
|
78.6
|
75.4
|
| South Australia |
86.6
|
87.8
|
87.0
|
76.7
|
73.6
|
| Western Australia |
86.7
|
86.8
|
85.9
|
76.0
|
70.3
|
| Tasmania |
78.3
|
79.6
|
78.3
|
70.2
|
70.1
|
| Northern Territory |
89.5
|
90.3
|
87.9
|
74.3
|
73.6
|
| Australian Capital Territory |
67.9
|
69.1
|
70.4
|
56.6
|
52.9
|
| Australia |
87.5
|
88.8
|
88.3
|
80.2
|
93.7
|
(a) Proportion of general practitioner
attendances (excluding practice nurse), enhanced primary care and other
non-referred attendances that are bulk billed.
Note: This data is only published on a financial
year basis.
Source: Department of Health and Aged
Care, Annual Medicare Statistics, 2023-24