Simon Jackman
It is really a great honour to be asked to come and speak in this building. I was here before the election and our friends from the Parliamentary Library will remember that I tipped Hillary Clinton to win the election—she won the popular vote! What I will do today is try to keep my remarks rather short. My experience with talks like this, both before the election and afterwards, is that you will have a lot of questions and I will do my best to try to answer them.
The tempo of politics in the United States and its implications for Australia were front of mind for me as I was on my way up this morning and thinking about the talk. I will say a few words about whether we are living through a populist moment. I will talk a little bit about the US election and challenge some of the conventional interpretations of it. I will do some Australian comparisons. There will not be a lot there, but I hope you find them provocative. I am going to conclude with a comparison between American and Australian political institutions that both enable and inhibit populism. At that point I would like to stop and maybe we can get into some back and forth about any of the above. As I said, when I have given talks lately, audiences are very engaged with the state of American politics and what that implies for our relationship with the United States and perhaps for the planet.
What is populism? I think if you are going to come out and put that in the title of your talk it might be on you to define the term. I am going to use a relatively standard definition. Like many things in political science, there is no one definition that the profession hews to. Populism is a political appeal based on a world view of a contest between masses and elites that transcends ordinary political competition. Often the populist party or the populist candidate claims to be the authentic expression of national spirit, of the true preferences of the people—feel free to insert ‘the Volk’ there. I think this is part of the trouble in the political science profession, as that little aside of mine just revealed: people very quickly want to start sliding words like ‘authoritarianism’ and ‘fascism’ in. I think it is important to be as precise as one can about these things. So I am not going to engage in that as best I can and keep this fairly firmly focused on populism as an electoral phenomenon.
Populism is also distinguished by the claim that politics as usual is unable to solve pressing national problems. The decision-making apparatus of the state, be it electoral institutions, legislative institutions or the bureaucracy, has been captured by some inauthentic interest—insert what you will: big business; a world view; a neoliberal economic orthodoxy; a communist economic orthodoxy; international financiers, whoever they may be; technocrats; or bureaucrats. There is something gumming up the works and getting in the way of the true authentic expression of national will and policy and it requires things to be shaken up. It finds real expression in the idea that it doesn’t matter who you elect because you get the same sorts of policy outcomes. A charismatic leader is often involved. I wouldn’t make that a necessary condition for a party to be populist, although the two do seem to go together. The ability to make this claim successfully often turns on the ability of a person to head the movement and to be the bearer of a breakthrough that will unjam the works.
Why is it fair to call Trump a populist? Because, in particular, of his repudiation of the liberal internationalist orthodoxy. Presidential candidates from both sides of American politics for decades have talked about the virtues of free trade and about the virtue of American leadership in the world. Trump’s nomination speech was the first time, certainly in my living memory, that I have heard a nominee of a major party say: ‘That is not what I am about. Indeed, that is a sellout of the working class. And, by the way, those of you thinking of voting for Hillary Clinton, she is going to keep going down that road that has led to bad outcomes for you and your family. I intend to do something different.’ That was a real break. Mitt Romney was not saying things like that. John McCain was not saying things like that. It was a McCain-Biden coalition essentially across the aisle that passed NAFTA, that saw the expansion of NATO, that admitted the Czech Republic to NATO, for instance. When the American Congress has acted in an internationalist direction it has often been on the back of a bipartisan coalition that has seen the extremes of both parties voting no and the yes coalition being brokered by statespeople. Biden and McCain in the 1990s were really leading a bipartisan coalition to get those things done. Trump is not about that, nor is the contemporary US Congress for that matter.
In the Australian context I think there are plenty of examples. I will refer to the Democrats appeal based on ‘keeping the bastards honest’. There is a lot wrapped up in that statement. ‘They’ are bastards—not a good thing; that’s a pejorative. It is not about a policy per se. It is about process and about being defined in opposition to ‘them’. I won’t do it today, but I invite you to think about how some of the appeals of contemporary Australian minor parties are of a similar ilk. We will turn to that later perhaps.
Trump is populist and I would say some of the people currently in the Australian Senate in particular pick up on similar themes—that the major parties are not giving authentic voice to what the people want, whatever that might be; that policy outputs have been captured by other interests that neither party is able to transcend. That is a theme to be sure in contemporary Australian politics as well.
Having set the stage, I am going to change gears a little bit with a retrospective on the American election. The US election is often hailed as a populist triumph—the rust belt working class rose up and embraced Trump’s message. Yes, but no. I think it is very easy to overread the result given how vivid and how huge a presence Trump is in national media. It is very much in Trump’s interests that people continue to think that. His outsize media presence is part of the magic, if you will, but let us turn to the data.
The thing I do take some comfort from, wearing my pollster hat, is that Clinton did win the popular vote by 2.87 million votes. That is a 2.1 per cent margin. Indeed, from that perspective the national polls, although wrong, certainly got the outcome correct in terms of the magnitude. In two-party terms, Clinton beat Trump 51.1 to 48.9. Australian politics occasionally throws up mismatches between the national two-party preferred vote and the seat outcome. The two most vivid recent examples being 1998, when Labor outpolled the Coalition in two-party preferred terms but John Howard won it in the right places, and 1990, when Labor did it to the Coalition. There are earlier examples, although the two-party preferred figures are a little rubbery once you go back to the 1950s in Australia. When it has happened in Australia they have been real nail biters—50.1 or 51 at most—but 51.1 is really quite stupendous to then go on and not win the electoral college. Clinton’s margin is bigger than the margin of Al Gore, who suffered a similar fate—won the vote but lost the electoral college— Richard Nixon and John Kennedy, who squeaked over the line in 1960. It is important to keep that in perspective.
The electoral college went 304 to 227, with seven so-called faithless electors who voted for others. Clinton won 20 states of 50 plus the District of Columbia and one electoral vote in Maine. Maine of course does not use the winner-takes-all formulation; it is winner takes all in each of its congressional seats. With the exception of Maine and Nebraska, the rest of the United States has a winner-takes-all system. It is very brutal in that way. It is a harshly majoritarian electoral mechanism and it is capable, as we have seen, of producing results like the one we got in 2016 and 2000.
How did that outcome come about? It came about because of the fact that the Democrats ran up the score in some big states (see Table 1). Hillary Clinton beat Trump by 30 points in California; it was a 65-35 election in California. In fact, Clinton’s margin there exceeded both of Obama’s wins there. California went the other way, a really remarkable result. Clinton won that state by 4.27 million votes, which were effectively wasted. If she had won California by one vote, she would have got 55 of its electoral college votes. It would have been great if some of those 4.3 million Californians had taken up residence in other states, from her perspective. A similar story holds for New York, where there was a huge margin, Illinois and Massachusetts. These are big Democratic states. Texas is Trump’s only big-state lopsided win, where the ‘wasted votes’, if you will, amount to only 800,000 votes. Interestingly, thinking about the future of American politics, the margin there was less than 10 points, which a lot of people took notice of as perhaps a harbinger that demographic shifts may be slowly dragging Texas in a less Republican and more Democratic direction. But that is another story. The tale of the tape here is the way that Democratic vote is literally overpowering in some states. When you overlay that on top of this harshly majoritarian electoral mechanism, this is a key building block as to how we got the mismatch between the popular vote and the electoral college vote.
Table 1: Democratic 'vote packing'
| State |
Electoral
Votes |
Clinton |
Trump |
Clinton
margin |
Margin
(%) |
| California |
55 |
8,753,788 |
4,483,810 |
4,269,978 |
30.0 |
| New York |
29 |
4,556,124 |
2,819,534 |
1,736,590 |
22.5 |
| Illinois |
20 |
3,090,729 |
2,146,015 |
944,714 |
16.9 |
| Massachusetts |
11 |
1,995,196 |
1,090,893 |
904,303 |
27.2 |
| Texas |
36 |
3,877,868 |
4,685,047 |
-807,179 |
9.0 |
Trump won the election very efficiently. That is perhaps the other way to think about this. Trump won three states in particular—Pennsylvania, Wisconsin and Michigan— by razor-thin margins (see Table 2). Had 77,000 voters stayed home, or half of that number changed their minds and gone the other way, we would be talking about President Hillary Clinton and about how the genius of her analytical team threaded the needle and so on. I am basing this on 2000 as well. When an election is this close, everything becomes relevant—the FBI did it; Hillary Clinton made bad campaign decisions; she should never have used the word ‘deplorables’. We can keep going. When we are talking about changing half of 77,000 votes, or 77,000 people staying home, I think we are at the limits of anything we might reasonably call political science at that point. Our resolution with our theories of voting, data, the whole apparatus, is going to really struggle to explain 0.06 per cent of the vote. When you are in that world, everything mattered and hence perhaps nothing mattered, or at the very least it is just very hard to say.
Table 2: Trump's 'efficient' victory
| State |
Electoral
Votes |
Clinton |
Trump |
Clinton
margin |
Margin
(%) |
| Pennsylvania |
20 |
2,926,441 |
2,970,733 |
-44,292 |
0.7 |
| Wisconsin |
10 |
1,382,536 |
1,405,284 |
-22,748 |
0.8 |
| Michigan |
16 |
2,268,839 |
2,279,543 |
-10,704 |
0.2 |
That said, you should not take too much away from Trump (see Table 3). It is important to recognise the win in Ohio, which is typically the bellwether state in American elections. It has gone with the winner in every election now since 1964. John Kennedy was the last person to win the White House without winning Ohio. That is a solid win by any stretch of the imagination for Trump in Ohio. That Iowa, a state that Obama carried twice, is now on a 9.4 per cent margin for Trump is an electoral catastrophe for Clinton and her campaign. Florida was lineball. It was the last state over the line for Obama in 2012 and again that was only 1.2 per cent the other way. You should not take anything away from Donald Trump on those wins in Ohio and Iowa. Indeed, Minnesota came perilously close to flipping. Minnesota is often thought to be a Democratic stronghold and is the state that gave us Hubert Humphrey and Walter Mondale. The idea that Trump got as close as he did in Minnesota, and New Hampshire for that matter, is pretty impressive. I look at these data and say, ‘Yes, big swings in many of these states, but don’t overread it.’ Indeed, I think this speaks to Trump’s challenge in 2020: rebuilding this coalition and hoping that the people who stayed home stay home again, as well as the people that came out for him come out again. Pulling this trick off twice would be quite a feat.
Table 3: Other significant state results
| State |
Electoral
Votes |
Clinton |
Trump |
Clinton
margin |
Margin
(%) |
| Ohio |
18 |
2,394,164 |
2,841,005 |
-446,841 |
8.1 |
| Iowa |
6 |
653,669 |
800,983 |
-147,314 |
9.4 |
| Florida |
29 |
4,504,975 |
4,617,886 |
112,911 |
1.2 |
| New Hampshire |
4 |
348,526 |
345,790 |
2.736 |
0.4 |
| Minnesota |
10 |
1,367,825 |
1,323,232 |
44,593 |
1.5 |
The story in those states is largely about what happened in the countryside. There is a lot of information here (see Figure 1). I have got eight states and what I have done on the horizontal axis is plot Obama’s share of the vote from 2012 by county against Clinton’s share of the vote from 2016. If the 2016 election were a rerun of 2012, any engineers in the room should know those data should lie on a 45 degree line, which is represented by the black line. You see all the dots have come down below the line.
That reflects the extent to which Clinton underperformed Obama. The other piece of information is the size of the circle. That reflects the population of each of these counties. The little ones are the small rural counties and the bigger ones are cities like Chicago, Detroit, Philadelphia, Milwaukee, Madison, Minneapolis and Cleveland. You can see in a lot of these places, like Michigan, all the dots slid down a bit. But boy oh boy that turnout not coming back in Detroit really hurt. Detroit is a city with a huge African American population. The real story here is the way the countryside swung hard. Generally speaking, the smaller dots, the rural counties, swung harder than the cities and the vote for Clinton did not hold up enough. Again, those three states, Michigan, Pennsylvania and Wisconsin, would have been enough to tilt the election.
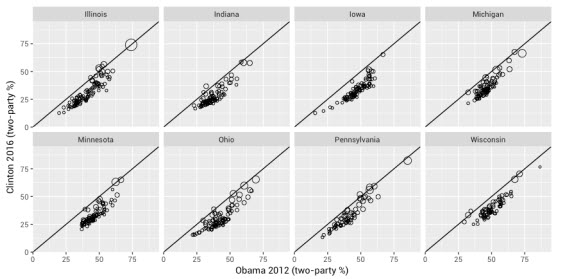
Figure 1: Obama 2012 and Clinton 2016 vote share comparison
The real story of this election though is what happened out in the rural counties. Figure 2 gives you a sense of what the current configuration of American politics looks like. Indeed, not just the current configuration. If I had made this graph with the 2012 or 2008 data, it would not look substantially different. Figure 2 plots Clinton’s vote share in every county in the US against the population density of each county. It is trying to measure how urban or how rural it is. Counties with big populations and high density are located in the upper right of the graph—Queens County in New York, San Francisco County, the Bronx, Kings County, Yonkers, which is part of greater New York, and New York County. These counties have big populations and high density, over 25,000 people per square kilometre in the case of New York. Those data slant up, meaning the cities voted overwhelmingly for Clinton. For example, Clinton won the Bronx County 90-10. This emphasises that pattern we saw before. Clinton did very badly in small rural counties, which are grouped toward the lower left of the graph. There are a few odd ones. For example, Clinton lost in outer suburban New York, where it is richer people but there is still a reasonably dense population. This is the big story of American politics at the moment. It is cities versus the hinterland and that maps onto the populist description I provided earlier—out in the countryside resides the authentic nature of America and the cities are cosmopolitan, multiracial, integrated into the world economy and full of people who were not born in the United States. The one thing that is different about the chart in Figure 2 from earlier years is that the pattern has become more pronounced. Over the last couple of cycles, this correlation between population density and how Democratic a place is has become tighter and tighter and tighter. That is a big part of the story.
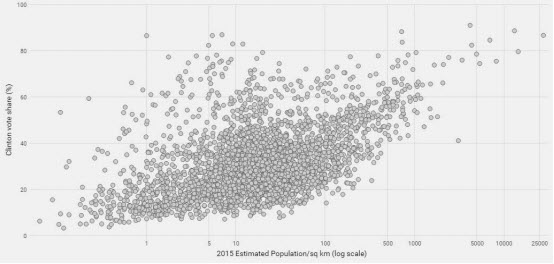
Figure 2: Clinton vote share and county population density
Figure 3, which plots for key swing states the change in turnout between 2012 and 2016 against the change in the Democratic vote between 2012 and 2016, repeats the story too. The changing size of the plotting symbol again indicates whether we are talking about a rural or an urban place. Most of these lines slope down. The point there is that as turnout went up support for Clinton went down. The essential story here is that Trump brought out voters. I would tell you that probably two-thirds to three-quarters of the story is a mobilisation story. Trump spoke to a set of voters who for the most part sat out the last couple of presidential elections. He got people who typically are not the most reliable of voters and who probably sat out the last two elections, in particular in rural counties. There are a few exceptions to the pattern, but generally that is the story: increasing turnout typically associated with declining vote share, or the swing towards Trump being larger and more pronounced in those rural counties.
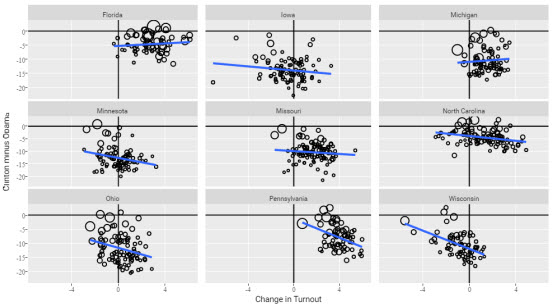
Figure 3: Change in turnout and change in Democratic vote
What happened in Congress? Clinton won a majority of the popular vote and so did House Democrats, or put it this way: Republicans did not win a majority. That is a more accurate statement. Republicans did not win a majority of the House vote, but nonetheless have a thumping majority in the House, which again is one of these things. We are going to end this talk with the primacy of political institutions here, institutions that govern the mapping of preferences into who sits in Congress or the White House and makes policy. How can it be that with 49 per cent of the vote they end up with 67 per cent of the seats? The answer is the Democratic vote is packed. It is a small-scale version of that story I told you about the states. California is a blue state. It has a surplus, in a political sense, of Democratic voters, but so too do many House districts. It is very tempting to draw a district, particularly if you are a Republican, that sits neatly over the Bronx. You have created a 90-10 Democratic district. By the way, the Democratic member of Congress there does not mind that. It is not a bad outcome for them. But for the Democratic Party more generally, that is not a good outcome. It is a little bit cheeky frankly—‘But we are sending African Americans and Hispanics to Congress, which is a good thing, right?’ You Republicans are such warm-hearted people! Your commitment to racial equality is just fantastic! There is a little bit of that going on.
It is an interesting political tension inside the Democratic Party because two things are being put in opposition—a commitment to getting faces of colour into the US Congress, a laudable goal and an important one, but it is coming at the cost of packing votes, meaning that the Democratic vote is spread very inefficiently, which creates outcomes like this where Republicans can win a huge chunk of the seats even though they get significantly below a corresponding proportion of the vote. Now, there is nothing that says we ought to have proportional representation. The theoretical merits of PR is a topic for another day perhaps. If you have a district system, small changes in vote will produce big changes in seat share, but mismatches like this are perhaps not what you would want to see, at least not too often.
Right now this is hardwired into American politics and the mechanism of redistricting—we call it redistribution here—is largely a partisan affair. There are some exceptions. California switched to a citizens commission for redistricting. But the default, until a state legislature hands that power away or the citizens take it away through a referendum and an amendment to the state constitution, is that power vests in the state legislature. Imagine for a moment the New South Wales parliament has responsibility for drawing the lines for New South Wales House of Representatives seats in this place, or that the Queensland parliament gets to draw the lines for Queensland’s House of Representatives seats here. The temptation to get partisan with that is overwhelming and has been irresistible in contemporary American politics. The fact of the matter is you do it in two steps. First, you gerrymander the state legislature to protect yourself. Once you have got control of that, you then gerrymander the House of Representatives seats and hardwire in results like this for at least a decade. In the United States the census comes in years ending in zero, and the districts are redrawn in time for the next two elections in a decade-long cycle. We are midway through that right now. This is a big part of the story. Why am I bringing this up in this talk about populism? Because it gives Republicans in Congress, indeed certain more populist elements of the Republican Party, more power to make policy than would correspond to their electoral strength in raw national numerical terms. That is another thing I think it is important for Australian audiences, indeed American audiences for that matter, to keep in mind.
North Carolina is a state I am doing some research on at the moment. In 2016 Democrats won three out of 13 seats. They won 48 per cent of the vote state-wide. In each of the three seats they won, they won by more than 67-33. Again, the incumbents there say, ‘Nice!’, but there are only three of them. The euphemism for this is ‘packing and cracking’. You pack your opponents votes and then you crack them as well, disperse the remainders. This creates moderately safe seats for yourself and a small number of whoppingly safe seats for your opponents and locks up their vote. So that is part of the story with Congress.
I have a few quick observations on the American Senate. It is a very interesting place at the moment, if you have been following news accounts coming out of the United States. There is a 52-48 split there. The filibuster is a rule in the American Senate that you need 60 votes to call debate to a close. So 41 senators can dig their heels in and say, procedurally, ‘We are not ready to vote.’ Right now, Republicans are eight short.
There are eight to nine Democratic senators who are incredibly powerful. There is a short-circuit for the majority and that is to lump a lot of legislation into the budget reconciliation process, which is one thing that has been carved out as filibuster proof. But that is really slow and I think it is going to create some real tension inside the American political system.
I will finish with a few observations about Australia. A couple of things about Australia: compulsory voting pushes turnout above 90 per cent here. We used to think it was well above 90 per cent until the Electoral Commission started computing the denominator the right way and we figured out there are a lot of people out there who ought to be enrolled and are now enrolled but do not vote. I used to go around the world saying Australia has voter turnout above 95 per cent. Somewhere between 90 and 95 per cent is perhaps a more credible number. What that means is that the alienated must vote in Australia, or not. I am thinking of my dad up in Queensland— very unscientific of me. What is the old saying? The plural of anecdote is data! My dad is now 81 years old and is fed up. The only reason he votes is because they are going to fine him and, to hell with it, he is going to vote ‘non-conventionally’ shall we say—a bit of him getting back at the system. I haven’t talked to him for a while about this, but that was certainly his state of mind a couple of election cycles ago. What that does in Australia is produce a steady supply for none of the above. In the American system, if you are alienated and upset, you do not have to vote. Indeed, it is a Tuesday and you might have other things to do that day than vote for these people you do not really like. It is a very different sort of system for that reason. The other thing to note is that the voting system we have for the Senate, the transferrable vote, and perhaps especially at double dissolution elections, provides a pathway—what, if I were an economist, I would call low entry costs—for political entrepreneurs seeking to exploit the fact that compulsory voting is generating this supply of voters, or if you turn it around, a demand for them.
It is interesting thinking about preferential voting, what we sometimes call the alternative vote, in House of Representatives elections in Australia. The preferences of alienated voters going to a minor party, or to a none-of-the-above, mad-as-hell type of candidate, can come back. The deal making that sometimes has to go on to try to secure a flow of those preferences coming back is a little unseemly, as we are currently seeing with respect to Western Australia. But that is probably better, if you are a politician, than having to bring those people back altogether if it were first preference or nothing—‘Let them give second preferences and we will do this deal and maybe they will forget about it by election day or they will not look at how-tovote cards too seriously.’ It is a little more palatable and allows the easier management of candidates chasing these votes, in the House at least. But the Senate is a different story.
Figure 4 is inspired by some analysis I saw the very clever and hardworking people at the Grattan Institute in Melbourne doing. I thought I would do this for myself. You have got to love the AEC. You can go onto their website and you can download all this data. Not only that, they geo-code polling places for you. Thank you AEC for making research into Australian elections so easy! Doing this for the United States requires half a million dollars of National Science Foundation money to round up the data from all the counties and states in the first place. Whereas you just click a mouse here and you can do it.
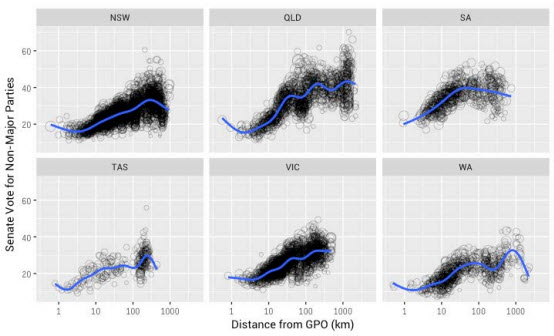
Figure 4: 2016 Senate vote for non-major parties and distance from GPO
Figure 4 shows the non-major-party vote in the July 2016 Senate election by polling place plotted against distance from the GPO in each state. So there is a lot of data there; each circle is a polling place. I have coded how much of the vote cast for the Senate at a given polling place went to someone other than the Coalition, Labor or the Greens. I am calling the Greens a major party here. We might quibble with that, but just go with it for the time being. You know who we are measuring: it is all the others. What I have plotted on the horizontal axis is how far that polling place is from the GPO in that state. The first time I saw this analysis I was sitting in Melbourne at the Grattan Institute and it is pretty interesting.
The Greens are largely concentrated in urban areas. In fact the Green vote almost goes to zero once you get more than 10 kilometres away from a GPO in most places— Nimbin being an exception, but never mind! I showed you a bunch of data from the United States of the countryside, the hinterland, being on fire. This is the closest quick thing I could come up with to a demonstration of this dissatisfaction with what is being offered up by the major parties and a willingness to entertain voting for someone else. I want to draw attention to how high these numbers are getting—over 40 per cent in some places, a lot of this data is above a third in New South Wales once we get out 100 to 500 kilometres away from Sydney. Queensland is not perhaps the best way to do this because it is the most decentralised state in Australia. Nonetheless there are quite a few polling places in Queensland where ‘others’ are getting 50 per cent of the vote. This is in 2016. We will see what this looks like the next time around. There is a similar pattern elsewhere but perhaps a little less pronounced than in Queensland, where we are picking up on the return of Pauline Hanson to Australian politics.
There has been a bit of polling data talked about in the last couple of weeks, but I thought I would go back and present data from the last election on this. Moreover, the version of this I saw done at Grattan repeats this analysis for the 2016, 2013, 2010, 2007, 2004 sequence of Australian elections and it is just going up and up. The pattern is there, but it just keeps ratcheting up in each cycle. I do not know how far away you people live from the ACT GPO! It may not be people in this room necessarily who live these distances away from a major urban area. Out in the countryside the willingness to entertain unconventional candidates has always been stronger than in the city, at least for the last couple of decades, but it is increasing and moreover we have a set of electoral mechanisms in Australia that allow the people capturing this vote to find their way into the national parliament.
The Australian Election Study, a survey run out of the Australian National University by Ian McAllister, asks people if they favour compulsory voting or not. These numbers are starting to trickle down (see Table 4). I looked at these numbers from about 20 years ago and they were much stronger. Support for compulsory voting is starting to fade a little bit. Only 49 per cent strongly favour compulsory voting. I guess if you put the two weakest categories together you are up to 28 per cent. If you ask people, ‘Would you have voted if it had not been compulsory?’ only 64 per cent, less than two-thirds, are saying they definitely would have voted (see Table 5). I would tell you that is an upper bound because these are people who are taking a long survey in the mail about politics. They are sort of into politics. They are so into politics they are willing to take this long survey and only 64 per cent of them say they definitely would have voted. They did not get any incentive to take this survey. This big booklet arrives in the mail with a nice letter from Ian McAllister saying, ‘Would you take my survey? It’s for science’, and a lot of people do it. The other thing is that to say you would not have voted is a little subversive in Australia, even privately on a survey. We have a norm of civic participation that has found voice in the Commonwealth Electoral Act and to go against that is a little unusual. So I would tell you that out there in the wild this number is even smaller than 64 per cent.
Table 4: Do you think that voting at Federal elections should be compulsory, or do you think that people should only have to vote if they want to?
| Response |
Per cent |
| Strongly favour compulsory voting |
49 |
| Favour compulsory voting |
23 |
| Favour people voting only if they want to |
17 |
| Strongly favour people voting only if they want to |
11 |
Table 5: Would you have voted in the election if voting had not been compulsory?
| Response |
Per cent |
| Definitely would have voted |
64 |
| Probably would have voted |
17 |
| Might/might not have voted |
8 |
| Probably not have voted |
6 |
| Definitely not have voted |
5 |
In tables 6 and 7 I have done two things. I have tabulated who they said they voted for in the election by how they answered that question about voting. Then I did a breakdown of the vote in the same way I did in Figure 4, combining major parties and Greens in one category and combing the remainder under ‘others’. These tables buttress my claim about where that vote is coming from. For the House of Representatives, the ‘definitely would have voted’ category splits 92-8 for major parties plus Greens versus others. By the time you get down to ‘definitely not have voted’, that vote for other candidates is up now to 30 per cent. The story from the Senate is even more stark. Among that subset of people who say ‘I definitely would not have voted’, it is basically 50-50 voting for these other, non-conventional candidates and parties.
| Response |
Per cent |
Others |
| Definitely would have voted |
64 |
8 |
| Probably would have voted |
17 |
12 |
| Might/might not have voted |
8 |
23 |
| Probably not have voted |
6 |
24 |
| Probably not have voted |
6 |
30 |
Table 7: Voluntary turnout by Senate vote
| Response |
Per cent |
Others |
| Definitely would have voted |
85 |
15 |
| Probably would have voted |
81 |
19 |
| Might/might not have voted |
64 |
36 |
| Probably not have voted |
66 |
34 |
| Probably not have voted |
54 |
46 |
So, on balance, I am a fan of compulsory voting. I think it keeps a lot of money out of Australian politics for one thing, which having lived in a America for a long time I tend to think on balance is a good thing. But, as we think about the current configuration of Australian politics and maybe frustration at the inability of governments to get policy through, maybe this gives us some reason to contemplate the flip side of compulsory voting—that demand it generates, that supply it generates, of voters willing to vote for non-conventional candidates. It is something to think about and something that we often do not think about. I think we rightly hold up compulsory voting as one of the stronger facets of Australian electoral democracy, but there may be some sting in the tail.
What is the takeaway? Institutions matter. I presume you believed that before you came in today, but they matter in different ways. In the US there are different institutions. The winner-takes-all system in the Republican primary process, something we did not talk much about, helped Trump get the nomination, and then the winner-takes-all system in the electoral college helped generate that mismatch between the popular vote and the election outcome. In Australia we have got some institutions too. We have got a whole bunch of them—compulsory voting, different electoral systems for House and Senate—and I think we need to think through what role they are playing in the translation of alienation and people being upset with the system and how that finds political voice in the national parliament.