20
January 2023
PDF version [1.2MB]
Geoff Gilfillan
Statistics and Mapping
Executive
summary
In the context of Australia’s debate over
energy policy, comparisons are sometimes made between the number of jobs
provided in the coal mining industry compared to the renewable energy sector.
Comparisons of employment between the two industries are problematic given the
significant differences in activities undertaken and their respective use of
labour and capital.
Different data sources provide a range of
estimates for coal mining employment in Australia. Some sources show falls in
employment in the sector in the past 5 to 10 years while others show an
increase.
The Australian Bureau of Statistics (ABS)
has also provided estimates for employment in renewable energy activities from
2009–10 to 2018–19. ABS Census of Population and Housing (Census)
data also sheds light on employment associated with electricity generation from
renewable and non-renewable sources (including coal) in 2016 and 2021.
Coal mining
employment
- The ABS Labour Account data series shows 34,300 people
were employed in the coal mining industry across Australia in 2021–22. This is
12,200 or 26.2% less than the peak of 46,400 achieved in the sector (using this
series) in 2013–14. There were 36,000 jobs in the coal industry in 2021–22
which accounted for 0.2% of the 14.9 million jobs recorded in all industries.
- The ABS Australian Industry data series shows 37,335
people employed in the coal mining industry at the end of June 2021, which
compares with a peak of 45,016 at the end of June 2012. This constitutes a fall
of 7,681 or 17.1%.
- ABS Labour Force survey (LFS) data shows 44,600 people
were employed in coal mining across Australia in November 2022 (based on 4
quarter moving averages of original data).[1]
This is 11,200 or 20.1% less than the peak of 55,800 achieved in May 2014.
- LFS data shows 26,800 people were employed in the coal industry
in Queensland (using the same methodology) in November 2022 and 14,300 were
employed in New South Wales (NSW). Coal mining employment has fallen in both
states between May 2014 and November 2022, with the fall being much more
pronounced in NSW. Coal mining employment fell by 12,400 or 46.4% in NSW and by
900 or 3.3% in Queensland.
- ABS Census showed 49,616 people employed in coal mining in
Australia in 2021. This is an increase of 3,121 or 6.7% from 2016 when 46,495
people were recorded in the industry. Census data shows 26,029 people were
working in the coal industry in Queensland in 2021 and 20,770 were working in
NSW.
- The biggest regional concentrations of coal mining employment in
2021 (using Census data) were in Mackay–Isaac–Whitsunday at 13,335 (up 3,380 or
34.0% from 2016), Hunter Valley at 10,056 (up 1,232 or 14.0%) and Central
Queensland at 7,349 (up 679 or 10.2%).
Summary of coal mining employment and jobs estimates
| Data source |
Time period |
New
South Wales |
Queensland |
Australia |
| Employment |
| ABS, Labour
Account |
2021–22 |
na |
na |
34,300 |
| ABS, Labour
Force, detailed |
November
2022 (4 quarter moving average) |
14,300 |
26,800 |
44,600 |
| ABS, Australian
Industry |
June 2021 |
na |
na |
37,335 |
| ABS, Census
of Population and Housing |
2021 2016 |
20,770 18,889 |
26,029 25,221 |
49,616 46,495 |
| Queensland
Government, Resources Safety and Health Queensland |
June 2022 |
na |
37,970 |
na |
| Coal
Services Australia |
June
2021, (production employment) |
21,979
FTE workers |
na |
na |
| Jobs |
| ABS, Labour
Account |
2021–22 |
na |
na |
36,000 |
| ABS, Jobs
in Australia |
2019–20 |
15,500 |
20,200 |
50,800 |
na = not available; FTE = full-time equivalent.
Note: Employment is the number of people working in coal
mining at a point-in-time. Jobs are those job placements in which the occupant
receives remuneration in wages, salary, payment in kind, or piece rates over a
financial year. This excludes self-employment jobs held by owner managers of unincorporated
enterprises.
- ABS Jobs in Australia data shows 50,800 jobs recorded in
coal mining during the 12 months of 2019-20. This is an increase of 7,400 or
17.0% compared with 2018–19. A substantial increase in coal mining jobs was
recorded in WA (up from 6,600 to 11,600). Jobs in Queensland increased by 1,900
or 10.5% while jobs in NSW fell by 1,000 or 6.1%.
- Mine
and quarry safety data released by the Queensland Government Department of
Resources, Safety and Health, shows 37,970 people were working in operational
coal mines in Queensland in June 2022. This data source shows in the 5 years to
June 2022 employment in the coal industry in Queensland grew by 7,018 or 22.7%.
- The Coal Services[2]
Annual Report of 2021 showed 21,979 full-time equivalent (FTE) workers in
coal mining production activities in NSW in June 2021. This source showed FTE employment
in coal mining production activities increased by 2,591 or 13.4% in NSW in the 5
years to June 2021.
Employment
in renewable energy activities and electricity generation using fossil fuels
After a period of decline between 2011–12
and 2015–16 employment in the renewable energy sector has risen rapidly since.
- Data collected by the ABS shows there were 26,850 FTE jobs in the
renewable energy sector in Australia in 2018–19, up by 15,370 or 133.9% since
2015–16. In the period between 2015–16 and 2018–19 growth in employment in
renewable energy activities was strongest in large scale solar (up more than
tenfold), followed by wind (which more than quadrupled), and installation of roof
top solar photo-voltaic (PV) (which more than doubled).
- ABS unpublished data shows 5,750 FTE jobs in ongoing operational
renewable energy generation activities in 2018–19 (as opposed to installation),
with hydro accounting for the most jobs (at 3,060).
ABS Census data shows Australia recorded a
substantial fall in employment in fossil fuel electricity generation across
Australia between 2016 and 2021 (down 1,435 or 17.8% to 6,630), and large
increases in employment in both hydroelectricity generation (up 606 or 54.5% to
1,718) and other (renewable) forms of electricity generation (up 1,002 or
115.7% to 1,868).
- Across Australia employment in renewable electricity generation
(hydro plus other) accounted for 34.3% of total employment in electricity
generation in 2021, which compares with a 19.2% share in 2016.
- Around 52.3% of employment in electricity generation using fossil
fuels is based in non-metropolitan areas. By comparison, 60.5% of employment in
electricity generation using renewables was based in capital cities.
Contents
Executive
summary
Coal mining employment
Summary of coal mining employment and
jobs estimates
Employment in renewable energy
activities and electricity generation using fossil fuels
Introduction
Coal mining industry
Coal mining contribution to the
national economy
National coal mining employment
estimates
ABS Labour Account
Figure 1 Number of people employed
in the coal mining industry, annualised data, 1994–95 to 2021–22
ABS Labour Force Survey
Figure 2 Employment in coal mining
in Australia—original estimates and average of preceding 4 quarters, 1984 to
2022
ABS Australian Industry
ABS Jobs in Australia
ABS Census of Population and Housing
Occupations in the coal industry
State and territory coal mining
employment estimates
ABS Labour Force Survey
Table 1 Employment in the coal
industry by major state/territory, 1985 to 2022
ABS Census
Table 2 Employment in the coal
industry by state and territory, 2016 and 2021
Jobs in Australia
Table 3 Coal mining jobs by state/territory,
2019–20
Other estimates for coal mining
employment in NSW and Queensland
Regional coal mining jobs and
employment estimates
ABS Jobs in Australia
Table 4 Ranking of coal mining
jobs by SA4 region, 2018–19 and 2019-20
ABS Census employment
Table 5 Major regions for coal
mining employment, 2016 and 2021
Renewable energy sector and fossil
fuel electricity generation
Renewable energy contribution to
total electricity generation
Figure 3 Renewable share of total
electricity generation in Australia, 1960–61 to 2020–21
Table 6 Australian electricity
generation, by fuel type; 2000–01, 2015–16 and 2020–21
Employment estimates for the
renewable energy sector
Figure 4 FTE employment in renewable
energy activities, 2009–10 to 2018–19
Table 7 FTE employment by
renewable energy type, selected years from 2009–10 to 2018–19
Table 8 FTE employment in
renewable energy activities by state and territory, selected years from 2009–10
to 2018–19
Ongoing operational employment in
renewable energy activities
Table 9 FTE ongoing operational
employment by energy type, selected years from 2009–10 to 2018–19
Employment in fossil fuel and
renewable electricity generation
Table 10 Number of people
employed in electricity generation by energy type by state and territory, 2021
Table 11 Percentage of share of
total people employed in electricity generation by type and state and
territory, 2016 and 2021
Other estimates for employment in
renewables and projections for future employment
Conclusion
Appendix
ABS Methodology for calculating
renewable energy employment
Introduction
In the context of Australia’s debate over
energy policy, comparisons are sometimes made between the number of jobs
provided in the coal mining industry compared to the renewable energy sector. However,
comparisons of employment between the two industries are problematic given the
significant differences in activities undertaken and their respective use of
labour and capital.
This statistical snapshot provides estimates for employment
in the coal industry and the renewable energy generation sector. The purpose of
the paper is to highlight the different employment estimates that are available
for each industry sector and to establish whether any trends exist over time.
Coal mining is highly capital intensive with fewer people
required to operate the large machinery used to extract coal deposits. The coal
industry is composed of thermal coal extraction which is used in electricity
generation and metallurgical coal extraction which is used in steel making.
Some thermal coal is used for local electricity generation, but a significant
proportion is exported, and much of the metallurgical coal that is extracted is
exported overseas. The employment estimates that are available do not
distinguish between thermal and metallurgical coal mining activities.
Employment in coal mining is restricted to regions in which
there are viable deposits of thermal and metallurgical coal whereas employment
in renewable energy has the potential to be far more widespread. For example,
coal mining employment is highly concentrated in regional parts of Queensland
and NSW, with smaller deposits found in Collie in Western Australia (WA).
Renewable energy production activities are quite varied, ranging
from larger scale solar, wind turbine and hydro electricity generation, to
smaller scale installation of photovoltaic panels and solar hot water systems
in private dwellings and businesses. Large scale renewable energy projects
require relatively few people to maintain and operate whereas smaller scale
rooftop solar installation is much more labour intensive.
As a result of these differences, caution is advised in making
direct comparisons between the two sectors. Nevertheless, it is interesting to
observe trends in employment in both these sectors as they have responded to
changing domestic and international demand for different sources of energy.
This first section of the paper examines the contribution of
the coal mining industry to the national economy and compares the various
estimates available for employment and jobs in the sector.
The second section of the paper examines the emergence of
the renewable energy sector and its growing contribution to total electricity
generation. This section includes employment estimates for both renewable and
non-renewable sources of electricity generation over time.
Coal mining industry
Coal mining
contribution to the national economy
Coal mining is a relatively small employer
in industry share terms but contributes significantly to the Australian economy
in terms of export revenue.
Australia produced 172 Mt (Million tonnes)
of metallurgical coal in 2021–22 of which 163 Mt was exported. Australia also
produced 246 Mt of thermal coal of which 196 Mt was exported. Exports of
metallurgical coal were worth $67.6 billion in 2021–22 while exports of thermal
coal were worth $46.3 billion.[3]
Total exports of coal were valued at $114
billion in 2021–22 which accounted for 19.1% of the value of total exports of
goods and services from Australia. This compares with an 8.5% share of total
exports of goods and services in 2020–21 when coal exports were valued at $39.2
billion.[4]
While production of coal increased slightly
in 2021–22 compared with the previous financial year, prices of coal increased
significantly in the months following the Russian invasion of Ukraine in
February 2022. [5]
The average export price for high quality metallurgical coal increased from
$145 per tonne in 2020–21 to $455 per tonne in 2021–22, while average export
price for thermal coal increased from $83 per tonne to $236 per tonne during
the same period.[6]
The coal mining industry accounted for 0.8%
of Gross Domestic Product (GDP) in Australia in 2021–22 (measured in chain
volume terms). By comparison iron ore mining accounted for 6.2% of GDP and the
whole mining sector (including exploration and support services) accounted for 10.3%.[7]
The ABS Australian Industry publication
showed coal mining received $51.8 billion in sales and service income in
2020–21 while industry valued added (IVA)[8]
in the sector amounted to just over $16 billion. The coal mining industry
accounted for 1.2% of total industry value added generated in selected
industries in the private sector in 2020–21.[9]
National coal mining
employment estimates
The ABS provides several estimates for employment in the
coal mining industry. Some ABS estimates are derived from survey data or the
Census, while others draw on businesses data. Additional employment estimates
are available from state government departments and an industry association
committed to ensuring worker safety in the industry. The differences in these
estimates are highlighted in the following section.
ABS Labour
Account
The ABS Labour
Account data series shows there were 34,300 people employed in the coal
mining industry across Australia in 2021–22 (see Figure 1).[10]
There were 36,000 jobs in the coal industry in 2021–22 which was equivalent to
0.2% of the 14.9 million jobs recorded in the economy. The level of employment
in the coal industry recorded in 2021–22 was 12,200 or 26.2% down on the peak
of 46,400 achieved in 2013–14, but much higher than the level recorded in 2000–01
(at 21,400).
The coal mining industry share of total jobs
in the economy has ranged from 0.2% to 0.4% between 1994–95 and 2021–22, with
the share being as high as 0.4% between 2011–12 and 2013–14. By comparison, the
whole mining industry accounted for 1.4% of total jobs in all industries in
2021–22, while industries such as Retail trade contributed 9.9%, Construction
contributed 8.5% and Health care and social assistance contributed 13.5%.[11]
The advantage of the Labour Account data
series is its use of a combination of household, business and administrative
data rather than just household survey data used for the Labour Force Survey
(LFS).[12]
Enterprises are allocated an industry classification [13]
according to the type of activities in which they are directly engaged.
The employment estimates by industry provided
in the Labour Account also include people whose main job may be in another
industry (i.e. they include multiple job holders). Consequently, it is a more
accurate representation of how many people work in the industry. In contrast,
the Labour Force survey only provides industry employment estimates for people
in their main job. However, Labour Account data does not provide any regional or
state and territory estimates, or estimates of full-time and part-time
employment, or employee access to leave entitlements.
Figure 1 Number of people
employed in the coal mining industry, annualised data, 1994–95
to 2021–22
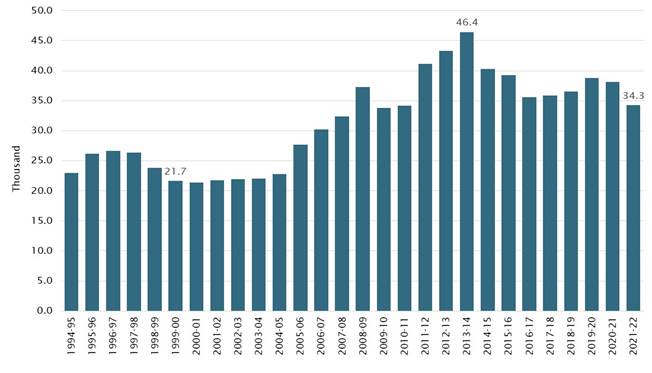
Source: ABS, Labour Account Australia, (Canberra: ABS, March 2022),
(balanced annual estimates).[14]
ABS Labour Force Survey
Another source of data for industry
employment is the ABS Labour
Force Survey (LFS). Figure 2 plots an overlaid 4-quarter moving average
of LFS original estimates with the more volatile original quarterly estimates.[15]
The 4-quarter moving average series shows a steady
fall in employment between the mid-1980s and early 2000s before a steady
increase in employment through to a peak of 55,800 achieved in May 2014.
Movements in employment have fluctuated considerably since, with the most
recent estimate being 44,600 in November 2022.
The sample size of the LFS is approximately 50,000
residents living in approximately 26,000 dwellings. Industry employment
estimates from the LFS may be influenced by subjective perceptions and
judgements of survey respondents as to the industry in which household members
work.[16]
For example, the estimates may not capture all labour hire workers or service
contractors that are used in the coal mining industry, in addition to direct
employees, due to confusion as to whether the labour hire company or their host
mining company is the employer.[17]
Figure 2 Employment in coal
mining in Australia—original estimates and average of preceding 4 quarters,
1984 to 2022
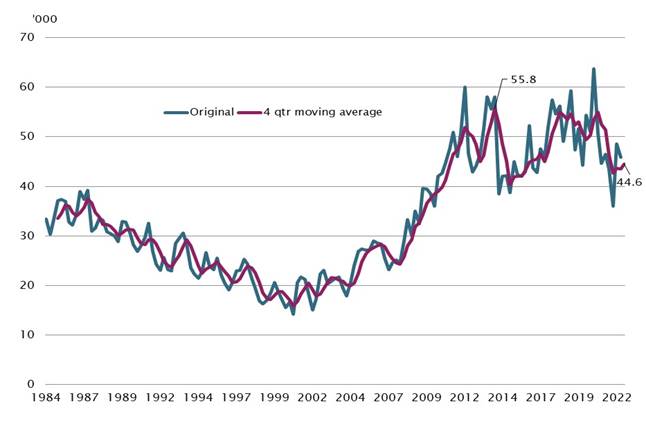
Source: ABS, Labour Force, Australia, Detailed, (Canberra: ABS, June 2022), Datacube
EQ06, 4 quarter moving averages of original data.
LFS data shows the coal industry workforce
is predominantly male with 83.3% of people working in the industry in November
2022 being males working full-time hours. However, the female share of total
employment in the sector has been increasing slowly from 3.9% in November 1985
to 15.7% in November 2022.[18]
ABS Australian Industry
Another source of coal mining employment
data is the ABS Australian
Industry data series. These estimates are produced annually using a
combination of data collected directly from the annual Economic Activity Survey
(EAS) conducted by the ABS, and Business Activity Statement (BAS) data provided
by businesses to the Australian Taxation Office (ATO). This data source shows
employment in coal mining has fallen from a peak of 45,016 in June 2012 to 37,335
in June 2021 — a fall of 7,681 or 17.1%. In the 12 months to June 2021
employment in the sector fell by 2,124 or 5.4%.[19]
ABS Jobs in Australia
An additional data source is ABS Jobs
in Australia collected from Australian Taxation Office (ATO)
administrative data that is linked to the ABS Business Longitudinal Analytical
Data Environment (BLADE). This data is sourced directly from employer records
rather than household survey data which increases its accuracy. Some employed
people may be working in multiple jobs in the same industry or in different
industries.
These are not point-in-time estimates. They relate
to the number of jobs recorded over a financial year. There were 50,800 coal
mining jobs recorded over the 12-months from July 2019 to June 2020 (latest
available data at time of writing). This compares with 43,400 recorded in 2018–19,
which is equivalent to an increase of 7,400 or 17.0%. Coal mining jobs
accounted for 0.3% of the approximately 17.9 million jobs recorded across
Australia in 2019–20.
ABS Census of Population and Housing
ABS Census data shows 49,616 people were
employed in coal mining across Australia in 2021. This compares with 46,495
working in the industry in 2016, equivalent to an increase of 3,121 or 6.7%
over 5 years.
Occupations
in the coal industry
Of those employed in the coal industry in
2021, 21,101 were working as Machinery operators and drivers (equivalent to 42.5%
of total employment in the sector); 14,495 (or 29.2%) were Technicians and
trade workers; 5,289 workers (or 10.7%) were Professionals, 3,853 (or 7.8%)
were Managers and 2,351 (or 4.7%) were Clerical and Administrative Workers.
In the five years to 2021 the number of
Technicians and trades workers in the industry grew by 1,013 (or 7.5%), Managers
increased by 781 (or 25.4%) and Professionals grew by 750 (or 16.5%).[20]
The leading occupations in the coal industry
in 2021 were Miners (14,808 or 29.8% of all workers in the industry), Fitters
(General) (5,983 or 12.1%), Electricians (General) (2,639 or 5.3%), Truck
Drivers (General) (2,369 or 4.8%), Mine Deputies (2,051 or 4.1%), Production Managers
(Mining) (1,479 or 3.0%), Metal Fabricators (939 or 1.9%) and Mining Engineers
(excluding Petroleum) (929 or 1.9%).[21]
Approximately 85% of coal mining employment
was concentrated in non–metropolitan areas. Around a third of people working in
managerial and professional occupations in the coal industry were working in
greater metropolitan areas, along with a quarter of clerical and administrative
staff. Well over 90% of Technicians and trades workers, Machinery operators and
Labourers in the industry worked in non–metropolitan areas.
State and territory coal
mining employment estimates
ABS Labour Force Survey
ABS LFS data shows employment in the coal
mining industry is concentrated primarily in the states of Queensland and NSW,
which accounted for 60.0% and 32.2% respectively of total employment in the
industry in November 2022. This source shows 26,800 people employed in the coal
mining industry in Queensland and 14,300 in NSW in November 2022 based on 4
quarter moving averages of original data. There were also 1,700 people employed
in the sector in WA at this time (see Table 1).
Table 1 Employment in the
coal industry by major state/territory, 1985 to 2022
| State/territory |
Nov
1985 |
Nov
2000 |
Nov
2010 |
May
2014 |
Nov
2020 |
Nov
2022 |
Share
of total coal emp in Nov 1985 |
Share
of total coal emp in Aug 2022 |
| ‘000 |
% |
| NSW |
22.2 |
8.3 |
17.9 |
26.7 |
20.2 |
14.3 |
64.3 |
32.2 |
| Vic |
0.6 |
0.6 |
0.3 |
0.6 |
0.4 |
1.1 |
1.9 |
2.5 |
| Qld |
6.4 |
7.4 |
20.4 |
27.7 |
30.2 |
26.8 |
18.5 |
60.0 |
| SA |
3.4 |
0.0 |
0.0 |
0.3 |
0.3 |
0.3 |
9.9 |
0.7 |
| WA |
1.8 |
0.7 |
1.2 |
0.3 |
1.9 |
1.7 |
5.1 |
3.8 |
| Australia total |
34.6 |
17.0 |
39.8 |
55.8 |
53.4 |
44.6 |
100.0 |
100.0 |
Note: Shares in right hand columns may not add up to 100%
due to rounding and exclusion of smaller percentage shares of total coal mining
employment occurring in other states and territories.
Source: ABS, Labour Force, Australia, Detailed, (Canberra: ABS, June 2022),
Datacube EQ06, 4 quarter moving averages
At the peak of coal mining employment in
Australia (using this measure) of 55,800 in May 2014, there were 27,700 people
working in the industry in Queensland and 26,700 working in NSW. Employment has
fallen significantly in NSW since this peak (down 12,400 or 46.4%) while
falling less markedly in Queensland (down 900 or 3.3%).
Over the longer term, the coal mining share
of total employment in NSW has more than halved from 1.0% in August 1985 to
0.3% in November 2022 while the coal mining share in Queensland increased from
0.6% to 1.0%.
ABS Census
ABS Census data shows 20,770 people worked
in coal mining in NSW in 2021 (up 1,881 or 10.0% from 18,889 in 2016), 26,029 were
working in the sector in Queensland (up 808 or 3.2% from 25,221 in 2016) and 1,923
in WA (up 426 or 28.5% from 1,497 in 2016) (see Table 2).[22]
Table 2 Employment
in the coal industry by state and territory, 2016 and 2021
| |
2016
|
2021
|
Number change:
2016 to 2021 |
%
change:
2016 to 2021 |
| NSW |
18,889 |
20,770 |
1,881 |
10.0 |
| Vic |
524 |
448 |
-76 |
-14.5 |
| Qld |
25,221 |
26,029 |
808 |
3.2 |
| SA |
278 |
287 |
9 |
3.2 |
| WA |
1,497 |
1,923 |
426 |
28.5 |
| Tas |
48 |
60 |
12 |
25.0 |
| NT |
29 |
101 |
72 |
248.3 |
| ACT |
3 |
6 |
3 |
100.0 |
| Australia |
46,495 |
49,616 |
3,121 |
6.7 |
Source: ABS,
Census of Population and Housing, (Canberra: ABS, 2016 and 2021), by Place of
Work (the geographic area in which a person worked in the week before Census
night), using TableBuilder.
Jobs in Australia
The ABS Jobs
in Australia data series shows Queensland accounted for the largest
number of coal mining jobs in 2019–20 (at 20,200 or 39.8%) followed by NSW (at
15,500 or 30.5%) and WA (11,600 or 22.8%) (see Table 3).[23]
Coal mining accounted for 0.6% of all jobs
in both Queensland and WA. WA recorded the biggest increase in jobs in coal
mining with 5,000 more in 2019–20 compared to the previous financial year.
Table 3 Coal mining jobs
by state/territory, 2019–20
|
State/territory
|
Number of
coal mining
jobs:
2018–19
|
Number of
coal mining
jobs:
2019–20
|
Total jobs in
all industries:
2019–20
|
Coal mining
share of
total jobs:
2019–20
|
Share of
total coal
mining jobs:
2019-20
|
| |
(no.) |
(no.) |
(no.) |
(%) |
(%) |
| NSW |
16,500 |
15,500 |
5,580,600 |
0.3 |
30.5 |
| Vic |
900 |
1,300 |
4,631,000 |
0.0 |
2.6 |
| Qld |
18,300 |
20,200 |
3,627,200 |
0.6 |
39.8 |
| SA |
500 |
1,500 |
1,153,600 |
0.1 |
3.0 |
| WA |
6,600 |
11,600 |
1,933,100 |
0.6 |
22.8 |
| Tas |
200 |
200 |
365,800 |
0.1 |
0.4 |
| NT |
400 |
400 |
187,200 |
0.2 |
0.7 |
| ACT |
0 |
0 |
356,100 |
0.0 |
0.0 |
| Australia total |
43,400 |
50,800 |
17,857,800 |
0.3 |
100.0 |
Source: ABS, Jobs in Australia, (Canberra: ABS, November 2022).
Other estimates for coal mining employment in NSW and
Queensland
More data on employment in coal mining in
Queensland is available from the Queensland Government Department of Resources,
Safety and Health, which collects information directly from Queensland mines on
worker numbers on a quarterly basis. This source shows 37,970 people were
working in coal mining in Queensland in June 2022. This compares with 30,952
working in in June 2017. In this 5-year period employment in the industry grew
by 7,018 or 22.7%.[24]
Additional estimates for coal mining
employment in NSW are available from the Coal Services Annual Report[25]
which showed 21,979 full-time equivalent (FTE) workers engaged in coal mining production
employment[26]
in June 2021. This estimate is 682 or 3% less than the previous financial year,
but 2,591 (or 13.4%) more than the estimate of 19,388 FTE workers recorded in
June 2016.
Around 38% of the coal industry workforce in
NSW were reported to be contractors.
Regional coal mining jobs and
employment estimates
ABS Jobs in Australia
The ABS Jobs in Australia series is also a
source of regional data for coal mining. The regions with 1,000 coal mining
jobs or above in 2019–20 are shown in Table 4, along with the coal mining share
of total jobs in each Statistical Area Level 4 (SA4) region.
Table 4 Ranking of coal
mining jobs by SA4 region, 2018–19 and 2019-20
| SA4 Name |
State |
Coal
mining
jobs:
2018–19 |
Coal
mining
jobs:
2019–20 |
Total
jobs:
2019–20 |
Coal mining
share of
total jobs
in SA4:
2019–20 |
| |
|
(‘000) |
(‘000) |
(‘000) |
(%) |
| Hunter Valley excl
Newcastle |
NSW |
7.0 |
6.0 |
189.3 |
3.1 |
| Central Queensland |
QLD |
4.4 |
5.2 |
161.2 |
3.2 |
| Mackay–Isaac–Whitsunday |
QLD |
4.1 |
4.5 |
142.8 |
3.2 |
| Newcastle and Lake
Macquarie |
NSW |
2.5 |
2.4 |
265.2 |
0.9 |
| Central West |
NSW |
2.4 |
2.3 |
137.0 |
1.7 |
| Perth–South West |
WA |
1.2 |
2.0 |
323.3 |
0.6 |
| Perth–North West |
WA |
1.0 |
2.0 |
423.8 |
0.5 |
| Perth–South East |
WA |
1.1 |
1.9 |
384.3 |
0.5 |
| Bunbury |
WA |
1.6 |
1.7 |
135.0 |
1.3 |
| Queensland–Outback |
QLD |
2.1 |
1.7 |
56.4 |
3.0 |
| New England and North West |
NSW |
1.4 |
1.5 |
116.3 |
1.3 |
| Wide Bay |
QLD |
1.0 |
1.1 |
173.5 |
0.6 |
| Townsville |
QLD |
1.1 |
1.1 |
178.2 |
0.6 |
| Western Australia–Outback (North) |
WA |
0.1 |
1.1 |
72.4 |
1.5 |
| Perth–North East |
WA |
0.5 |
1.0 |
200.3 |
0.5 |
Source: ABS, Jobs in Australia, (Canberra: ABS, November 2022)
The Hunter Valley region (excluding
Newcastle) in NSW had the most coal mining jobs at 6,000 in 2019–20, which
accounted for 3.1% of all jobs in the region. Other regions with large numbers
of coal mining jobs include Central Queensland (5,200 or 3.2% of all jobs in
the region) and Mackay–Isaac–Whitsunday (4,500 or 3.2% of all jobs in the
region). SA4s in the Perth region recorded the biggest 12 monthly increases in
coal mining jobs.
Some of the regional jobs estimates provided
by this data source for 2019–20 are much lower than regional employment
estimates for 2021 that are available from the Census and discussed in the
following section.
ABS Census employment
ABS Census data shows the biggest regional
concentrations of coal mining employment in 2021 were in the SA4s of
Mackay–Isaac–Whitsunday (Queensland) at 13,335 (or 14.4% of total employment in
the region) and the Hunter Valley (NSW) at 10,056 (or 8.6% of total employment).
Both regions experienced significant increases in coal mining employment
between 2016 and 2021 with an increase of 3,380 (or 34.0%) in Mackay–Isaac–Whitsunday
and an increase of 1,232 (or 14.0%) in the Hunter Valley. In contrast
employment in coal mining fell in Newcastle and Lake Macquarie by 733 or 25.5%
and employment in the industry fell by 662 or 33.1% in Illawarra.
The SA4 of Central Queensland had
significant concentration of coal mining employment in 2021, at 7,349 (or 7.2%
of total employment) and employment in the industry in the SA4 of Brisbane
Inner City increased significantly from 856 in 2016 to 2,443 in 2021 (see Table
5).
Table 5 Major regions for
coal mining employment, 2016 and 2021
| Major SA4s and states |
Coal
mining
(2016) |
Coal
mining
(2021) |
Total
employed
(2021) |
Coal
mining
share of total
employment
(%) 2021 |
| Major SA4s |
| Mackay–Isaac–Whitsunday |
9,955 |
13,335 |
92,309 |
14.4 |
| Hunter Valley |
8,824 |
10,056 |
116,800 |
8.6 |
| Central Queensland |
6,670 |
7,349 |
102,519 |
7.2 |
| Central West |
2,108 |
2,678 |
91,918 |
2.9 |
| Brisbane Inner City |
856 |
2,443 |
364,268 |
0.7 |
| Newcastle and Lake
Macquarie |
2,871 |
2,138 |
179,684 |
1.2 |
| New England and North–West |
1,240 |
1,690 |
77,640 |
2.2 |
| Sydney–Outer South West |
465 |
1,459 |
89,499 |
1.6 |
| Illawarra |
2,000 |
1,338 |
113,940 |
1.2 |
| Bunbury |
702 |
660 |
78,895 |
0.8 |
Source: ABS, Census
of Population and Housing, (Canberra: ABS, 2016 and 2021), by Place
of Work[27]
(Canberra: ABS, 2016), using TableBuilder
Renewable
energy sector and fossil fuel electricity generation
Renewable
energy contribution to total electricity generation
The renewable energy sector in Australia has
a long history dating back to the building of the Waddamana Power Station in
Tasmania in 1916, and the development of the Snowy Mountains Scheme between
1949 and 1974. The Tasmanian hydroelectric scheme currently has 30 power
stations and a capacity of 2,600 megawatts.[28]
The 9 power stations and 33 turbines of the Snowy Hydro scheme have a combined
capacity of 4,100 megawatts.[29]
It is interesting to reflect that the
renewable share of total electricity generation in Australia was as high as
25.7% in 1964–65 when electricity generation from
hydroelectricity schemes operating in the Snowy Mountains and Tasmania was responsible
for a significant share of total electricity generation in Australia. From this
point electricity generation from renewables steadily decreased as a share of
total electricity generation through to 2008–09 when the renewable share reached
a low of 7.5%.[30]
This outcome was largely driven by the steady
increase in electricity generation from fossil fuels such as black and brown
coal, as generation from hydro remained fairly steady during this period, apart
from during drought conditions. The renewable share has since increased sharply
to 26.7% in 2020–21, reflecting the increase in renewable electricity
generation and the decline in generation from fossil fuels.
Figure 3 Renewable
share of total electricity generation in Australia, 1960–61 to 2020–21
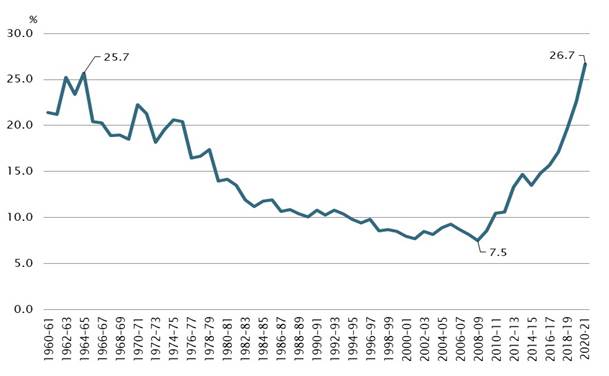
Source: Department of Climate
Change, Energy, the Environment and Water (2022), Australian Energy Statistics,
Table O; International Energy Agency (2022), World Energy Balances.
Over the two decades to 2020–21 the share of
total electricity generation accounted for by black and brown coal fired power
stations has fallen from 83.4% to 52.8%, while the contribution from natural gas
has increased from 7.7% to 18.7% (see Table 6). Generation from renewables
increased by 52,960.2 GWh or 296.9% over the 20 year period, while generation
from fossil fuels fell by 11,045 GWh or 5.4%.[31]
Table 6 Australian
electricity generation, by fuel type; 2000–01, 2015–16 and 2020–21
| |
Electricity
generation |
Share of total
electricity generation |
| 2000–01 |
2015–16 |
2020–21 |
2000–01 |
2020–21 |
| GWh |
GWh |
GWh |
% of total |
% of total |
| Non-renewable fuels |
|
| Black coal |
134,264.0 |
114,263.0 |
106,251.4 |
60.0 |
40.0 |
| Brown coal |
52,223.0 |
48,827.8 |
34,060.0 |
23.4 |
12.8 |
| Natural gas |
17,271.0 |
50,536.1 |
49,782.9 |
7.7 |
18.7 |
| Oil products |
2,044.0 |
5,655.6 |
4,661.9 |
0.9 |
1.8 |
| Total non-renewable |
205,802.0 |
219,282.5 |
194,756.3 |
92.0 |
73.3 |
| Renewable fuels |
|
| Bagasse, wood[32] |
633.0 |
2,493.4 |
1,992.2 |
0.3 |
0.8 |
| Biogas[33] |
12.0 |
1,296.5 |
1,354.0 |
0.0 |
0.5 |
| Wind |
210.0 |
12,199.5 |
24,535.4 |
0.1 |
9.2 |
| Hydro |
16,933.0 |
15,318.2 |
15,199.7 |
7.6 |
5.7 |
| Large-scale solar PV |
.. |
457.2 |
9,637.9 |
0.0 |
3.6 |
| Small-scale solar PV |
50.0 |
6,381.0 |
18,079.1 |
0.0 |
6.8 |
| Geothermal |
.. |
0.2 |
na |
.. |
.. |
| Total renewable |
17,838.0 |
38,146.0 |
70,798.2 |
8.0 |
26.7 |
| Total |
223,640.0 |
257,428.6 |
265,554.5 |
100.0 |
100.0 |
Source: Department of
Industry, Science, Energy and Resources, Australian Energy Statistics, Table O, September 2022.
Note: These are the official
estimates of total electricity generation in Australia. Estimates are derived
from multiple data sources including the Australian Energy Market Operator (AEMO)
and the Clean Energy Regulator (CER). These statistics cover all electricity
generation in Australia. This includes by power plants, and by businesses and
households for their own use, in all states and territories. This also includes
both on and off grid generation.
The Clean Energy Council reported that
renewable energy sources accounted for 32.5% of Australia’s total electricity
generation in the calendar year of 2021, with small-scale solar adding 3.3
gigawatts of new capacity over 12 months. Large scale wind and solar also added
an additional 3 gigawatts of capacity. Large scale wind accounts for the
greatest share of renewable electricity generation (at 35.9% in 2021), followed
by small-scale solar (24.9%), hydro (21.6%), large-scale solar (12.3%), bioenergy
(4.3%) and medium-scale solar (1.1%).[34]
The Clean Energy Council also flagged that 68
large-scale renewable energy projects were either under construction or
financially committed at the end of 2021. These projects were expected to add a
further 9 GW hours of capacity to the electricity grid as well as creating
35,000 construction and operational jobs. Of these projects 42 were related to
solar, 19 involved wind power generation and the remainder included bioenergy
plants, hydropower projects and hybrid projects. Many of the jobs created will
be in regional areas.[35]
Employment
estimates for the renewable energy sector
In contrast to the coal mining industry,
employment data is more limited for the renewable energy sector. This is due to
the lack of unique industry classification for different forms of renewable
generation activities, apart from Hydro-electricity generation (ANZSIC 2612),
in the ABS industry classification system.[36]
All other forms of renewable energy generation are grouped together in Other electricity
generation (ANZSIC 2619).[37]
As a result, it is not possible to extract separate employment estimates for
the emerging renewable energy forms such as wind, solar, geothermal and tidal
electricity generation from ABS data sources such as the Labour Account, the
Labour Force survey and the Census.
To address this data gap, the ABS has
provided experimental employment estimates for renewable energy activities from
2009–10 to 2018–19 using funding provided by the Australian
Renewable Energy Agency (ARENA). The experimental estimates are not taken
from the ABS Labour Force survey or linked employee-employer data sets.
Consequently, they cannot be compared directly with employment in other
industries such as coal mining. They are based upon information that is
available publicly (including company annual reports, audit reports and company
websites), an employment factor approach (based upon energy capacity and output
of renewable energy infrastructure), and employment numbers provided by
renewable energy operators themselves. A more detailed explanation of how the
ABS calculates its employment estimates in renewable energy activities is
provided in the Appendix at the end of this snapshot.
These experimental employment estimates are
no longer being produced and it is unclear if funding to enable the production
of estimates will be made available in future. This is problematic for analysts
and policy makers hoping to observe and track future employment trends in the
renewable energy sector.
The data collected by the ABS shows there
were 26,850 full-time equivalent (FTE) jobs in renewable energy activities in
Australia in 2018–19, up by 15,370 or 133.9% since 2015–16 (see Figure 4).[38]
Figure 4 FTE employment in
renewable energy activities, 2009–10 to 2018–19
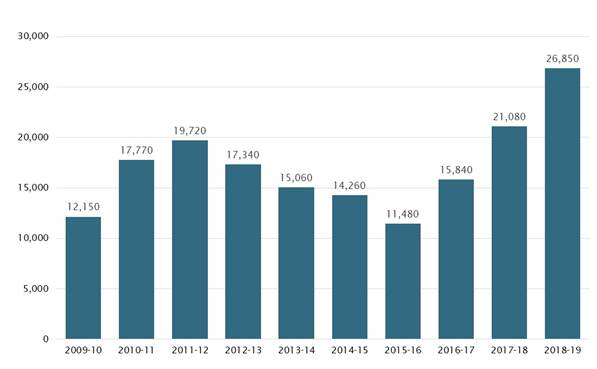
Source: ABS, Employment in Renewable Energy Activities, Australia, (Canberra: ABS, April 2020).
In its methodology the ABS tends to
interchange between the terms FTE jobs and FTE employment when describing the
number of employees working in the sector.[39]
In the period between 2015–16 and 2018–19
growth in FTE employment was strongest in large scale solar (up more than
tenfold), followed by wind power generation (which more than quadrupled), and roof
top solar PV (up 121.5%) (see Table 7). Roof top solar PV accounted for the
largest share of total FTE employment in 2018–19 (at 48.7%), followed by large
solar PV (17.7%), wind (12.1%) and hydro (11.4%).
Data from the Clean
Energy Regulator shows the number of rooftop solar PV system installations
across Australia continued to increase steadily each year from 132,697 in 2016
to 377,285 in 2021, which would have stimulated further employment growth in
the sector.[40]
There had been just over 3.3 million solar PV panel systems installed in
Australia between 2001 and November 2022 for either private dwellings or small
businesses under the Small-scale
Renewable Energy Scheme.
Table 7 FTE employment by
renewable energy type, selected years from 2009–10 to 2018–19
| Energy type |
2009–10 |
2012–13 |
2015–16 |
2018–19 |
Change: 2015–16
to 2018–19 |
Share
of total FTE
in 2018–19 |
| (no.) |
(%) |
(%) |
| Roof top solar PVa |
6,900 |
11,000 |
5,900 |
13,070 |
7,170 |
121.5 |
48.7 |
| Solar PV Large |
10 |
140 |
410 |
4,740 |
4,330 |
1,056.1 |
17.7 |
| Wind power |
1,090 |
1,440 |
770 |
3,240 |
2,470 |
320.8 |
12.1 |
| Hydro |
1,860 |
2,310 |
1,870 |
3,060 |
1,190 |
63.6 |
11.4 |
| Biomass |
1,440 |
1,440 |
1,500 |
1,580 |
80 |
5.3 |
5.9 |
| Geothermal |
110 |
70 |
40 |
40 |
0 |
0.0 |
0.1 |
| Govt/NPIb |
740 |
940 |
990 |
1,120 |
130 |
13.1 |
4.2 |
| Total |
12,150 |
17,340 |
11,480 |
26,850 |
15,370 |
133.9 |
100.0 |
a Includes solar hot water systems.
b NPIs are non-profit institutions, that are institutionally
separate from government and self-governing.
Source:
ABS, Employment in Renewable Energy Activities, Australia, (Canberra: ABS, April 2020).
NSW accounted for the biggest share of FTE
employment in renewable energy activities (28.9%) in 2018–19, followed by
Queensland (23.6%) and Victoria (22.7%). FTE employment in renewable energy
activities increased at the fastest rate in SA in the 3 years between 2015–16
and 2018–19, up 241.3%, followed by Victoria and NSW, up 185.9% and 165.4%
respectively (see Table 8).
Table 8 FTE employment in
renewable energy activities by state and territory, selected years from 2009–10
to 2018–19
| State or territory |
2009–10 |
2012–13 |
2015–16 |
2018–19 |
Change:
2015–16 to
2018–19 |
Share
of total
renewable energy
employment,
2018–19 |
| (no.) |
(%) |
(%) |
| NSW |
3,760 |
3,750 |
2,920 |
7,750 |
4,830 |
165.4 |
28.9 |
| Vic |
1,730 |
2,920 |
2,130 |
6,090 |
3,960 |
185.9 |
22.7 |
| Qld |
2,770 |
5,030 |
2,800 |
6,330 |
3,530 |
126.1 |
23.6 |
| SA |
1,400 |
1,880 |
750 |
2,560 |
1,810 |
241.3 |
9.5 |
| WA |
1,020 |
1,580 |
1,060 |
1,690 |
630 |
59.4 |
6.3 |
| Tas |
960 |
1,540 |
1,160 |
1,560 |
400 |
34.5 |
5.8 |
| NT |
70 |
70 |
100 |
190 |
90 |
90.0 |
0.7 |
| ACT |
440 |
570 |
560 |
680 |
120 |
21.4 |
2.5 |
| Australia |
12,150 |
17,340 |
11,480 |
26,850 |
15,370 |
133.9 |
100.0 |
Source: ABS, Employment in Renewable Energy Activities, Australia, (Canberra: ABS, April 2020).
Note: Estimates include workers involved in construction and
installation as well as ongoing operations and maintenance.
Ongoing operational employment
in renewable energy activities
Table 9 shows the number of ongoing FTE
operational staff engaged in wind and solar, hydro and bio-mass energy
generation and maintenance (as distinct from construction and installation) in
selected years between 2009–10 and 2018–19. The estimates are a subset of the
estimates provided in Table 7. The ABS has provided these unpublished estimates
to the Parliamentary Library based on the data it has collected on renewable
energy activities.
There were 5,750 FTE jobs involved in
ongoing operational renewable energy generation and maintenance activities in
2018–19 with hydro being the biggest employer (at 3,060 FTE jobs). Ongoing
operational employment in wind and solar increased by 690 or 164.3% between
2015–16 and 2018–19 (see Table 9).
The acceleration of employment in wind and
solar in the last 3 years (2015–16 to 2018–19) is due mainly to the increase in
large scale solar PV generation capacity completed over this time.
Table 9 FTE ongoing
operational employment by energy type, selected years from 2009–10 to
2018–19
| Renewable
energy type |
2009–10 |
2011–12 |
2012–13 |
2015–16 |
2018–19 |
Change:
2015–16 to 2018–19 |
| (No) |
(%) |
| Wind and solar |
170 |
250 |
290 |
420 |
1,110 |
690 |
164.3 |
| Hydro |
1,860 |
1,910 |
2,300 |
1,870 |
3,060 |
1,190 |
63.6 |
| Biomass |
1,460 |
1,460 |
1,460 |
1,520 |
1,580 |
60 |
3.9 |
| Total |
3,490 |
3,620 |
4,050 |
3,810 |
5,750 |
1,940 |
50.9 |
Source: ABS data on request, Employment in Renewable Energy Activities, Australia, (Canberra: ABS, April 2020).
Employment
in fossil fuel and renewable electricity generation
Table 10 shows the number of people employed
in different forms of electricity generation in 2016 and 2021 by state and
territory as reported in the ABS Census of Population and Housing.
Table 10 Number of people
employed in electricity generation by energy type by state and territory, 2021
| State/ territory |
Electricity
generation,
nfd |
Fossil fuel
electricity
generation |
Hydro-electricity
generation |
Other
electricity
generation (a) |
TOTAL |
| |
2016 |
2021 |
2016 |
2021 |
2016 |
2021 |
2016 |
2021 |
2016 |
2021 |
| NSW |
51 |
68 |
1,659 |
1,231 |
342 |
465 |
257 |
538 |
2,316 |
2,303 |
| Vic |
33 |
78 |
1,877 |
1,349 |
103 |
172 |
199 |
533 |
2,214 |
2,129 |
| Qld |
35 |
31 |
1,944 |
2,057 |
124 |
363 |
149 |
329 |
2,250 |
2,776 |
| SA |
41 |
25 |
381 |
317 |
4 |
9 |
111 |
260 |
532 |
610 |
| WA |
43 |
29 |
1,282 |
1,379 |
0 |
4 |
108 |
118 |
1,435 |
1,526 |
| Tas |
10 |
11 |
62 |
52 |
529 |
701 |
8 |
25 |
607 |
792 |
| NT |
15 |
0 |
846 |
235 |
0 |
0 |
13 |
10 |
875 |
245 |
| ACT |
0 |
9 |
0 |
12 |
0 |
4 |
21 |
61 |
27 |
90 |
| Australia |
234 |
248 |
8,065 |
6,630 |
1,112 |
1,718 |
866 |
1,868 |
10,268 |
10,468 |
(a) includes biomass, geothermal, solar, tidal and wind.
nfd = not further defined due to lack of information
provided.
Note: The sum of individual energy types may differ slightly
to totals shown in the right-hand column of the table.
Source: ABS, Census of
Housing and Population, (Canberra: ABS, 2016 and 2021), by Place of Work, using
TableBuilder.
A big fall in employment was recorded in
fossil fuel electricity generation across Australia between 2016 and 2021 – down
1,435 or 17.8% to 6,630.
Fall in employment in fossil fuel
electricity generation were more pronounced in Victoria (down 528 or28.1%) and
NSW (down 428 or 25.8%).
However, employment in fossil fuel
electricity generation did increase in Queensland (up 113 or 5.8%) and Western
Australia (up 97 or 7.6%). Overall, the increase in employment in all forms of
electricity generation across Australia in the 5 years to 2021 was modest at
200 or 1.9%.
Employment in hydroelectricity electricity
generation increased by 606 or 54.5% to 1,718, while employment in other forms
of renewable electricity generation increased by 1,002 or 115.7% to 1,868.
Employment in all forms of renewable
electricity generation across Australia increased from 1,978 in 2016 to 3,586
in 2021—an increase of 1,608 or 81.3%.
Total renewable electricity generation
(hydro plus other) accounted for 34.3% of total employment in electricity
generation in Australia in 2021. This compares with a 19.2% share in 2016.
Around 2.4% of employment in the industry could not be classified to either
fossil fuels or renewables in 2021.
Some jurisdictions had much higher
concentrations of employment in electricity generation using fossil fuels in
2021 including the Northern Territory (95.9%) and WA (90.1%). The fossil fuel
electricity generation share of total employment in electricity generation in
Queensland has fallen from 86.3% in 2016 to 74.0% in 2021, while the share
recorded in Victoria fell from 84.9% to 63.3%. Tasmania relies heavily on hydroelectricity
which is reflected in the sector’s 88.8% share of total electricity generation
employment. SA experienced a more than doubling in the other renewable electricity
generation share of total electricity generation employment from 20.7% to 42.6%
(see Table 11).
Table 11 Percentage of share
of total people employed in electricity generation by type and state and
territory, 2016 and 2021
| |
Electricity
generation nfd |
Fossil fuel
electricity
generation |
Hydro-electricity
generation |
Other
electricity
generation (a) |
TOTAL |
| |
2016 |
2021 |
2016 |
2021 |
2016 |
2021 |
2016 |
2021 |
2016 |
2021 |
| |
% |
% |
% |
% |
% |
% |
% |
% |
|
|
| NSW |
2.2 |
3.0 |
71.8 |
53.5 |
14.8 |
20.2 |
11.1 |
23.4 |
100.0 |
100.0 |
| Vic |
1.5 |
3.7 |
84.9 |
63.3 |
4.7 |
8.1 |
9.0 |
25.0 |
100.0 |
100.0 |
| Qld |
1.6 |
1.1 |
86.3 |
74.0 |
5.5 |
13.1 |
6.6 |
11.8 |
100.0 |
100.0 |
| SA |
7.6 |
4.1 |
70.9 |
51.9 |
0.7 |
1.5 |
20.7 |
42.6 |
100.0 |
100.0 |
| WA |
3.0 |
1.9 |
89.5 |
90.1 |
0.0 |
0.3 |
7.5 |
7.7 |
100.0 |
100.0 |
| Tas |
1.6 |
1.4 |
10.2 |
6.6 |
86.9 |
88.8 |
1.3 |
3.2 |
100.0 |
100.0 |
| NT |
1.7 |
0.0 |
96.8 |
95.9 |
0.0 |
0.0 |
1.5 |
4.1 |
100.0 |
100.0 |
| ACT |
0.0 |
10.5 |
0.0 |
14.0 |
0.0 |
4.7 |
100.0 |
70.9 |
100.0 |
100.0 |
| Australia total |
2.3 |
2.4 |
78.5 |
63.4 |
10.8 |
16.4 |
8.4 |
17.9 |
100.0 |
100.0 |
(a) includes biomass, geothermal, solar, tidal and wind.
nfd = not further defined.
Source: ABS, Census
of Housing and Population, (Canberra: ABS, 2016 and 2021), by Place of
Work, using TableBuilder.
Census data shows 45.9% of employment from
electricity generation using fossil fuels is based in Greater metropolitan
areas with 52.3% based in non-metropolitan regions. An additional 1.8% reported
no fixed address as their place of work in the week before the Census night. In
comparison 60.5% of employment in electricity generation using renewables was
based in Greater metropolitan areas, with 35.9% based in non–metropolitan areas,
while 3.6% reported no fixed address for their place of work in the week before
the Census night. The high percentage of employed people in renewable forms of
electricity generation in metropolitan areas is likely to be related to the
labour-intensive installation of solar panels on private residences in more
densely populated cities.
Other estimates for employment
in renewables and projections for future employment
The University of Technology Sydney (UTS) Institute
for Sustainable Futures (the Institute) undertook some analysis for the Clean
Energy Council in June 2020 in which it provided a current estimate for FTE
employment/jobs in the renewables sector and projections for employment growth
under a range of scenarios.[41]
Surveys were undertaken for large-scale
solar PV and wind power, distributed solar PV, hydro generation and pumped
hydro, battery storage, and the associated supply chains. Using employment
factors derived from these surveys, estimates of renewable energy jobs from
2020 to 2035 were produced using three energy market scenarios and other inputs
from the Australian Energy Market Operator’s (AEMO) Integrated System Plan
(AEMO 2020) for the eastern states:
- Central Scenario: growth is determined by market forces under
current federal and state government policies (i.e. business-as-usual with no
additional policy)
- Step Change: strong policy commitments occur with ‘aggressive
decarbonisation’ and growth in renewable energy.[42]
- High Distributed Energy Resource (DER): higher growth in rooftop
solar and battery storage relative to large-scale renewable energy.
Similar to the methods used by the ABS to
calculate FTE, the methodology used by the Institute to calculate employment
estimates uses a combination of industry survey data and an employment factor
methodology:
Simply put, an employment factor (full-time equivalent
jobs/megawatt of installed capacity) is derived from industry surveys and
applied to the level of installed capacity (MW) to estimate total employment.
The employment factor is reduced over time to reflect productivity
improvements.[43]
The authors estimate there were around
26,000 FTE jobs in the renewable energy sector across Australia in 2020 (prior
to the impact of COVID-19). The report tends to use the terms ‘employment’ and ‘jobs’
interchangeably. whereas the ABS traditionally presents labour estimates where
an ‘employed’ person may have one or more ‘jobs’. For simplicity, it may be
interpreted that the estimates refer to the number of FTE jobs in the renewable
energy sector.
Under the Step scenario that assumes strong
policy commitments which are consistent with the Paris Climate Agreement in
tandem with accelerated exits of coal generators, FTE jobs in the renewable
energy sector peaks at around 45,000 in 2025, and them moderates to around 34,400
in 2035.[44]
Under the High Distributed Energy Resource
(HDER), in which there is a higher growth in rooftop solar and battery storage
relative to large-scale renewable energy, it estimates that FTE jobs remains relatively
stable at around 30,000 between 2024 and 2027, but then accelerates, and could
be as high as 45,000 in 2035. If this scenario eventuates employment in
renewable power generation would be 19,000 or 73.1% higher than the current estimate
of 26,000 for 2020.[45]
A Central scenario assumes the status quo
whereby current federal and state government policies are allowed to continue
unchanged and market forces determine growth in use of renewable sources of
energy. Under this scenario FTE jobs would drop from 26,000 currently to around
15,000 in the mid-2020s and would not substantially recover to the 2020 level
until around the mid-2030s.[46]
The expectation that employment would fall under the Central scenario is based
on a forecast hiatus in the industry associated with low levels of new
installation. Employment was then expected to remain flat for the next five
years. However, the increase in renewable capacity and generation noted earlier
in this report in 2021 would appear to contradict this prediction.
The Institute projects that around two
thirds of FTE jobs generated in renewable energy between 2020 and 2035 could be
in regional areas, with some variation between states and territories depending
upon their technology mix.[47]
In terms of the ability of renewable energy to replace jobs
that could be lost in coal mining and electricity generation using fossil fuels
in regional areas the authors’ state:
… renewable energy cannot replace the loss of jobs in coal mining
- but the sector can play a meaningful role in creating alternative employment
within a wider regional industry development strategy that builds a range of
industries as the coal sector declines.[48]
Regions that mine metallurgical coal for
steel production are likely to be less vulnerable to job loss than regions
involved in mining thermal coal. However, the emergence of steel making
technologies that are less reliant on metallurgical coal are likely to have an
impact on demand for coal mining into the future. The Institute suggests the
growth of ‘green steel’ technologies and electric arc furnaces in South-East
Asia could reduce demand for metallurgical coal over time.[49]
In terms of additional data sources for
employment in the renewable energy sector the Department of Industry, Science,
Energy and Resources is conducting a national energy workforce survey which
will shed light on the types of jobs that exist in the energy sector, and the
characteristics and skills of people working in the sector. The first survey of
businesses in the energy sector is expected to be undertaken at the end of
January 2023, with the findings being used to produce the Australian Energy
Employment Report (AEER).[50]
Conclusion
There are a several estimates available for
employment in coal mining using different data sources. Some sources show
employment in the coal mining industry has fallen substantially since its most
recent peak.[51]
In contrast, ABS Census data shows employment growth of just under 7% between
2016 and 2021.
The prospects for employment in coal mining
are uncertain despite the likelihood of continued strong global demand for
metallurgical coal used in steel making. Much will depend on the strength of
demand for thermal coal in the short to medium term as Australia and other
countries make decisions on their preferred energy mix between fossil fuels and
renewables.
ABS data shows a significant fall in direct
FTE employment in renewable energy activities between 2011–12 and 2015–16, but a
strong recovery in the following three years to 2018–19 in response to the
building of large scale solar and wind farms and high rates of take up of
rooftop solar PV. However, employment estimates for 2018-19 were the last to be
published by the ABS using this data source.
ABS Census data shows strong growth in
employment in renewable energy electricity generation between 2016 and 2021,
with an increase of just over 1,600 or 81.3%. In comparison, employment in
electricity generation using fossil fuels fell by 1,435 or 17.8%.
There is potential for further growth in
rooftop solar as the cost of producing solar panels continues to fall, as
batteries and other enabling technologies improve, and in response to policy
initiatives aimed at encouraging households to install rooftop solar. The rate
of rooftop installations in future is also likely to respond to future changes
in retail electricity prices.[52]
Prospects for increased employment in the renewable
electricity generation sector will continue to be heavily influenced by the
level of government support for the sector in the future and the rate of
transition away from the use of fossil fuels for electricity generation.
Appendix
ABS Methodology for
calculating renewable energy employment
The following information is taken from the methodology
for the ABS publication Employment in Renewable Energy Activities.
Direct employment in renewable energy
activities is related to the production of renewable energy, and/or by the
design, construction and/or maintenance of renewable energy infrastructure.
The ABS used a range of techniques in compiling
these employment estimates including sourcing information from annual reports,
media reports and industry associations. The ABS also used employment numbers
provided directly by institutions and organisations as well as an employment
factor approach in deriving their estimates.
The employment factor approach looks at the
amount of potential renewable energy produced by different sources as well as
the generation infrastructure including the size and number of installations in
determining employment estimates. Size is the amount of energy generated as
measured in megawatts (MWs) for aggregated roof-top units, larger scale wind
and solar operations. Employment factors indicate the number of annual direct
full-time jobs created per physical unit of choice, for example, numbers of
annual FTE employees created per megawatt (MW) of installed capacity of wind
power. It is an estimation technique that has been used internationally to
generate employment numbers associated with renewable energy activities
It could be assumed that the installation of
more units on roofs of houses by small and medium-sized contractors or
construction of large solar and wind generating plants will result in greater
direct employment during the installation or construction phase.
Employment estimates for solar and wind
sources of renewable energy relied heavily on the employment factor approach
whereas all other forms of renewable energy generation rely on publicly
available information from the producers themselves.
An additional renewable energy activity
covered by employment estimates is employees of government bodies and
non-profit institutions (NPIs). The ABS considers the estimates published are
likely to understate the true levels of renewable energy employment within
government and NPIs. It is likely that a significant number of these entities
employ people engaged in work directly related to renewable energy. For
example, more accurate estimates could include local council employees that
develop and administer guidelines related to rooftop solar systems, or
employees of state government agencies that manage environmental aspects of
wind farm proposals.
Some government and NPI employees are
engaged in climate change related work such as climate change policy
development, advice, training and inter-disciplinary collaboration. Although
renewable energy is a central consideration of climate change policy, these
employees are not specifically engaged in renewable energy activities and are
excluded from the FTE estimates provided by the ABS. However, the estimates do
include research and development activities related to renewable energy
undertaken by universities, often in partnership with outside entities.
[1] Original data
are estimates that have not been seasonally adjusted or trended.
[2]. Coal Services
is a health and safety scheme that provides services to identify, assess,
monitor and control risks in workplaces in the NSW coal mining industry.
[3] Department of
Industry, Science and Resources, Resources
and Energy Quarterly, December 2022, p. .57 and p. 69.
[4] Australian
Bureau of Statistic (ABS), International
Trade in Goods and Services, Australia, Tables 1 and 12b.
[5] Department of
Industry, Science and Resources, Resources
and Energy Quarterly, December 2022, p. .50 and p. 60.
[6] Department of
Industry, Science and Resources, Resources
and energy quarterly: December 2022 – historical data [XLSX], table 24 (2).
[7]. Australian
Bureau of Statistic (ABS), Australian
System of National Accounts (Canberra: ABS, 2021), Table 5.
[8]. IVA is an
estimate of the difference between the market value of the output of an
industry and the purchases of materials and expenses incurred in the production
of that output.
[9]. Australian
Bureau of Statistic (ABS), Australian
Industry, (Canberra, ABS, 2022), Table 3. Selected industries exclude
Finance and insurance and government enterprises.
[10] The Labour
Account employment estimates are balanced annual estimates to the end of June
of each year.
[11] Australian
Bureau of Statistic (ABS), Labour
Account, (Canberra, ABS, 2022).
[12] The Labour
Account draws on data from the Australian National Accounts: National Income,
Expenditure and Product; Quarterly Business Indicators Survey (QBIS); Economic
Activity Survey (EAS); Survey of Employment and Earnings (SEE); Labour Force
Survey (LFS); Survey of Employee Earnings and Hours (EEH) and Linked
Employer-Employee Database (LEED).
[13]. The industry
classification for coal mining is taken from the ABS Australia and New Zealand Industry
Classification (ANZSIC). Coal mining consists of business units engaged in
open-cut or underground mining of black or brown coal.
[14]. Balanced
estimates result from incorporating data sourced from businesses and
households.
[15]. Original
estimates are the actual estimates the ABS derives from the survey data. These
estimates have not had a seasonal adjustment process applied to remove
the effects of systematic calendar related patterns or been smoothed using a
trending process. The moving 4 quarter average is used to smooth out volatility
from quarter to quarter.
[16]. ABS, Labour
Force, Australia methodology, (Canberra: ABS, 2022).
[17] Deloitte Access
Economics, Economic
effects of changes to labour hire laws, June 2019, p. 29.
[18] Based on 4
quarter moving averages of original estimates from the ABS Labour Force Survey.
[19]. ABS, Australian
Industry, (Canberra: ABS, 2022). The data series uses a combination of data
collected directly from the annual Economic Activity Survey (EAS) conducted by
the ABS, and Business Activity Statement (BAS) data provided by businesses to
the Australian Taxation Office (ATO).
[20] ABS,
Census of Population and Housing, (Canberra: ABS, 2016 and 2021), by
Place of Work (the geographic area in which a person worked in the week before
Census night), using TableBuilder.
[21] ABS, Census
of Population and Housing, (Canberra: ABS, 2016 and 2021), using
TableBuilder.
[22] ABS, Census
of Population and Housing, (Canberra: ABS, 2016 and 2021), by Place of
Work, using TableBuilder.
[23]. The
Jobs in Australia data series draws on the Linked Employer-Employee Dataset
(LEED), which is built using ATO administrative data linked to ABS Business
Longitudinal Analytical Data Environment (BLADE).
[24] Resources
Safety and Health Queensland, Qld
quarterly mine and quarry safety data.
[25] Coal
Services Annual Report, 2020-21, p. 35.
[26] Production
employment includes working proprietors and persons engaged as employees of the
operator of the mine. The estimates also include employees of contractors
undertaking work relating to coal production, coal preparation, overburden
removal; drivers transporting coal from the mine to a preparation plant; and
people engaged in administration/clerical work at the mine site.
[27] Place of Work records
the geographic area in which a person worked in the week before Census night.
[28] ‘About us’, Hydro Tasmania.
[29] The
Snowy Scheme’, Snowy Hydro.
[30] Department
of Climate Change, Energy, the Environment and Water, Australian
Energy Update 2022 data for charts, Figure 18.
[31] Department
of Climate Change, Energy, the Environment and Water, Australian
Energy Update 2022 data for charts, Figure 15.
[32] Bagasse is the
dry pulpy fibrous material that remains after crushing sugarcane or sorghum
stalks to extract their juice. It is used as a biofuel in the production of
heat, energy, and electricity, and in the manufacture of pulp and building
materials.
[33] Biogas is produced
from the anaerobic (oxygen free) digestion (or degradation) of organic matter.
It can be made from a large variety of organic resources, including industrial
waste, agricultural waste, energy crops, sludge from waste water treatment and
biowaste. Biogas is a source of energy that can be converted into heat or
electricity.
[34] Clean Energy
Council, Clean
Energy Australia Report 2022, (Melbourne: Clean Energy Council, 2022), p.
10.
[35] Clean Energy
Council, Clean
Energy Australia Report 2022, (Melbourne: Clean Energy Council, 2022), p.
19.
[36]. ABS, Australia and New Zealand Industry
Classification (ANZSIC), (Canberra: ABS, 2013).
[37]. Other
electricity generation aggregates together Biomass electricity generation not
elsewhere classified (nec), Electricity generation nec, Geothermal electricity
generation, Solar electricity generation, Tidal electricity generation and Wind
electricity generation.
[38]. ABS,
Employment
in Renewable Energy Activities, Australia,
(Canberra: ABS, 2020).
[39]. ABS,
Employment
in Renewable Energy Activities, Australia methodology, (Canberra: ABS,
2020).
[40] ‘Postcode
data for small-scale installations’, Small-scale installations by
installation year, Clean Energy Regulator.
[41]. C.
Briggs, J. Rutovitz, E. Dominish and K. Nagrath, Renewable
Energy Jobs in Australia: Stage 1, report prepared for the Clean Energy
Council by the Institute for Sustainable Futures, University of Technology
Sydney (UTS), (Sydney: UTS, 2020).
[42] A Step change is
defined in business or politics as a significant change in policy or attitude.
[43]. Briggs
et al, p. 22.
[44] Briggs et al, p.
4.
[45] Briggs et al, p.
4.
[46] Briggs et al, p.
4.
[47]. Briggs
et al, p. 39.
[48]. Briggs
et al, p. 42.
[49]. Briggs
et al, p. 42.
[50]. J.
Rutovitz, D. Visser, S Sharpe, H. Taylor, K. Jennings, A. Atherton, C. Briggs, F.
Mey, S. Niklas, A. Bos, S. Ferraro, F. Mahmoudi, S. Dwyer, D. Sharp, and G. Mortimer,
Developing
the future energy workforce: Opportunity assessment for RACE for 2030, (Sydney:
UTS, 2021), p. 10.
[51]. The ABS Australian
Industry publication shows a decline in coal mining employment of 17.1%
between June 2014 and June 2021, the ABS Labour Account shows a fall of 26.2%
between 2013-14 and 2021-22, and the ABS Labour Force survey shows a
fall of 20.1% between May 2014 and November 2022.
[52]. R. Best, P.
Burke and S. Nishitateno, Evaluating
the effectiveness of Australia’s Small-scale Renewable Energy Scheme for
rooftop solar, (working paper, 1903, Centre for Climate and Energy
Policy, Australian National University, Canberra, 2019), p. 2
For copyright reasons some linked items are only available to members of Parliament.
© Commonwealth of Australia

Creative Commons
With the exception of the Commonwealth Coat of Arms, and to the extent that copyright subsists in a third party, this publication, its logo and front page design are licensed under a Creative Commons Attribution-NonCommercial-NoDerivs 3.0 Australia licence.
In essence, you are free to copy and communicate this work in its current form for all non-commercial purposes, as long as you attribute the work to the author and abide by the other licence terms. The work cannot be adapted or modified in any way. Content from this publication should be attributed in the following way: Author(s), Title of publication, Series Name and No, Publisher, Date.
To the extent that copyright subsists in third party quotes it remains with the original owner and permission may be required to reuse the material.
Inquiries regarding the licence and any use of the publication are welcome to webmanager@aph.gov.au.
This work has been prepared to support the work of the Australian Parliament using information available at the time of production. The views expressed do not reflect an official position of the Parliamentary Library, nor do they constitute professional legal opinion.
Any concerns or complaints should be directed to the Parliamentary Librarian. Parliamentary Library staff are available to discuss the contents of publications with Senators and Members and their staff. To access this service, clients may contact the author or the Library‘s Central Entry Point for referral.