16
November 2020
PDF version [1.4MB]
Rory Haupt
and Liz Wakerly
Statistics and Mapping and
Economic Policy Sections
The media regularly reports the findings of various
indexes that seek to quantify the comparative performance of countries in
relation to specific areas as varied as happiness or economic competitiveness.
This Quick Guide brings together the findings of a selection
of these indexes to give a snapshot of how Australia compares internationally.
The indexes are arranged alphabetically according to subject and each entry
summarises what is being measured, where Australia ranks in the comparison and
provides a short analysis of the result and the underlying methodology. Entries
conclude with a list of similar or related measures.
These indexes are inevitably imperfect measures, as their
authors frequently acknowledge. Nevertheless, provided their limitations are
understood, they do provide an interesting summary of how Australia compares
relative to other nations. In that context, the indexes that follow show
Australia to be among the best performing countries in areas ranging from
health to security.
Contents
Introduction
1. Agriculture and food
Global Food Security Index
2. Aid and charity
Commitment to Development Index
3. Competitiveness and globalisation
Global Competitiveness Report
4. Corruption
Corruption Perceptions Index
5. Education
Programme for International Student
Assessment
6. Environment
Environmental Performance Index
7. Health
Global Health Security Index
8. Human Rights
Freedom in the World Index
9. Inequality
OECD Income Inequality
10. Innovation, science &
technology
Global Innovation Index
11. Politics and democracy
Democracy Index
12. Press freedom and the rule of law
World Press Freedom Index
13. Renewable energy
Renewable Energy Country
Attractiveness Index
14. Security and safety
Safe Cities Index
15. Tourism
The Travel & Tourism Competitiveness
Index
16. Well-being and happiness
World Happiness Report
Introduction
An increasing number of quantitative assessments of national
characteristics have emerged over time. Many of these assessments come in the
form of indexes: a combination of measures weighted to provide an overall
indicator in an area of interest. Indexes are generally comprised of a number
of statistical measures, as opposed to, for example, Gross Domestic Product
which is a single statistic. As such, as outlined in this paper, indexes can be
advantageous when assessing broader areas which often contain a number of
complex inputs. For example, how can we measure freedom as a whole, when
freedom can be represented in many different ways?
There are, however, limitations to the usefulness of indexes
insofar as they often require complex calculations and the weighting of
different components is usually chosen subjectively.
Selecting indexes based on their simplicity, suitability and
accessibility, analysis of each is broken down into four parts:
-
an outline of the index, and where Australia ranks
-
an in depth look into what the index measures including the
statistical inputs and methodology
- general commentary including further discussion of how Australia
performs, as well as an assessment of any advantages or critiques and
- a list of complementary indexes or statistics.
To facilitate the search for relevant indexes, they are
presented in alphabetical subject order.
Figure 1: Australia's rankings in indexes
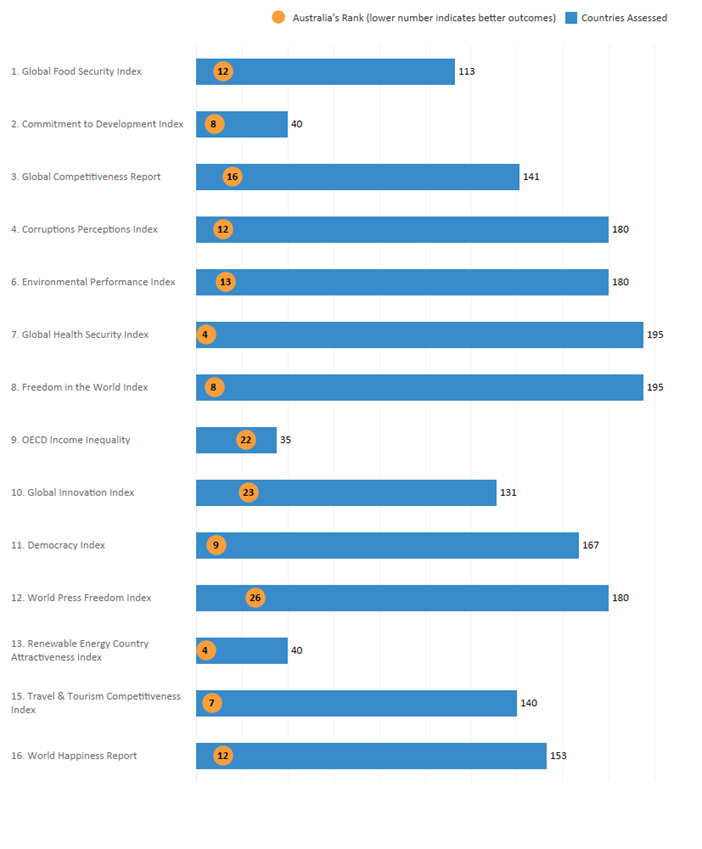
Note: Compiled by the Parliamentary Library. Sources shown throughout
paper.
1. Agriculture and food
Global Food Security Index
The most recent release of The Economist Intelligence
Unit’s Global Food
Security Index occurred in 2019. The index measures food security in a
country, where food security is defined as:
the state in which people at all times have physical, social
and economic access to sufficient and nutritious food that meets their dietary
needs for a health and active live.
The index is measured with reference to the three factors
of food security: affordability; availability; and quality and safety of food,
assessing food security amongst 113 countries. In the most recent rankings,
Australia is one of the leading nations in food security, ranking 12th in
the world with a score of 81.4 points. This represents a drop in the
rankings by 6 spots from the previous year.
Figure 2: Global Food Security Index—Rankings
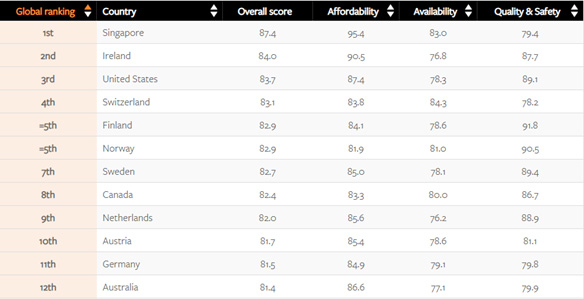
Source: The Economist Intelligence Unit, Global Food Security Index:
Rankings and trends, 2019, accessed 16 November 2020.
What
does it measure?
The Global Food Security Index takes into account
three different areas relating to food security: affordability; availability;
and quality and safety. Each area has a set of indicators which generate a
score for each country. These include factors spanning agriculture, consumption
and diversification. The overall ranking is a simple weighted average of the
three categorical rankings. Also available as part of the rankings is an adjustment
factor, which assesses the impact of climate change on the food security of
each country, informed by natural resources and resilience rankings. The
adjustment factor identifies which countries are expected to experience an
improvement in rank, or no change, or deterioration due to the effects of
climate change. For Australia, climate change is expected to lead to a
deterioration in rank, likely due to the nation’s susceptibility to
drought, bushfires and others natural disasters.
Commentary
A 2017 report from the European Commission’s Joint
Research Centre assesses the use
of the Global Food Security Index for assessing food security in
countries of interest. The report highlights a number of shortfalls of the
index. As the report notes, the indicators included in the index only assess a
subsection of food security determinants, with data that varies in age across
both countries and indicators. The example is used of 2015-16 El
Niño-damaged countries receiving better ranks than expected as such
impacts were not accounted for (p. 3). The index is comprised of indicators
assessing contributing factors of food security, as opposed to the outcomes
themselves, and as such, does not assess all factors of food security (p. 45).
A comparison with similar indexes shows both strong correlations and variations
(p. 42). The report concludes that the index is used best in conjunction with
other indicators which measure outcomes of food security. For a
more traditional measure, see food
security indicators by the Food and Agriculture Organization of the United
Nations. For a broader snapshot of a nation’s agriculture industry, data
are available from The
World Bank.
2. Aid and charity
Commitment to Development Index
The Center for Global Development’s Commitment to Development Index,
or CDI, provides a measure of the level of a state’s contribution to
global development through a variety of factors. The CDI assesses 40 countries
in seven areas—finance, environment, security, aid, technology, trade and
migration—and ranks the nations based on an overall score. In the 2020
rankings, Australia achieved a score of 70 overall, ranking it 8 out of 40
countries. This is an improvement from the 2018 index, when Australia was
ranked 14th out of the 27 countries assessed. Australia has strengths in
investment, trade and technology, but achieved a relatively low score in the
environment category, where it ranks it 37 out of 40 countries.
What
does it measure?
Each of the seven broad areas identified above is assessed
based on a number of sub-components, each, in turn, comprising various
indicators. For example, the finance score is provided by two subcomponents,
investment and financial secrecy, each of which is summarised by various
indicators, such as international investment agreements and bilateral treaties.
In order to achieve a similar measure across indicators and the seven
components, scores are standardised to percentiles, with the best performing
country in an indicator receiving 100 and the worst performing country
receiving zero. Each of the seven components is weighted equally in the final
rankings.
Commentary
The CDI provides a broad overview of a country’s
contribution to global development in several important areas. While the index
only includes 27 countries, all are OECD countries and, as such, the rankings
represent most of the developed countries in the world. An expansion of the
rankings would prove useful, potentially providing an indicator of the
willingness of emerging economies, such as India and Brazil, to commit to
global development. Such an expansion may, however, face difficulties relating
to collection of data and quality control. In terms of charity specific
indexes, the Aid
Transparency Index provides a useful measure of the use of aid across 45
aid organisations, ranging from development agencies, such as the United
Nations Development Programme, to state-based aid providers, such as
Australia’s Department of Foreign Affairs and Trade.
3. Competitiveness and
globalisation
Global Competitiveness Report
The World Economic Forum’s Global
Competitiveness Report was most recently released in 2019. The
report analyses and measures the competitiveness performance of 141 countries,
measured through 12 ‘pillars’. The report defines competitiveness
as:
… the set of institutions, policies, and factors that
determine the level of productivity of a country. (p. xiii)
Australia ranked 16th in the Global Competitiveness Index
with a score of 78.7. This is a drop in two spots since the previous year,
despite a reduction in score of only 0.2 points. Figure 3 highlights
Australia’s performance across the pillars, identifying the best
performing country (above score) and how Australia ranks (below score).
Figure 3: Global Competitiveness Report: Australia
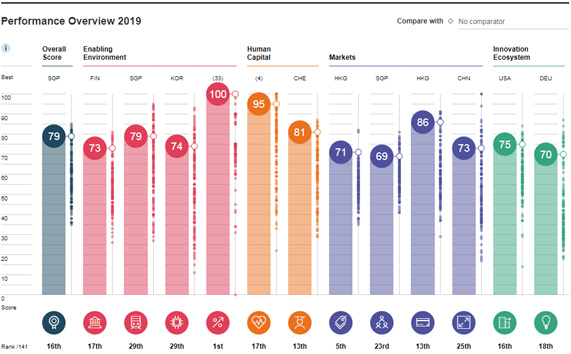
Source: World Economic Forum, Global
Competitiveness Report 2019: Australia, accessed 16 November 2020.
What
does it measure?
The Global Competitiveness Report uses 12 pillars to
assess competitiveness: institutions; infrastructure; ICT (information and
communication technologies) adoption; macroeconomic stability; health; skills;
product market; labour market; financial system; market size; business
dynamism; and innovation capability. Each pillar is weighted equally. Each of
the pillars is comprised of a number of sub-pillars, also equally weighted,
with scores for sub-pillars determined through numerous indicators. There are
98 indicators across the 12 pillars, with 54 based on statistics, such as mean
years of schooling; and 44 qualitatively based, such as an assessment of
property rights.
Commentary
The Global Competitiveness Report examines a wide
range of contributing factors. Any measure of competitiveness will involve
complexity, and as such a single index will be required to make concessions in
order to provide simplicity. The value of such an index is that it provides comparability
across nations.
4. Corruption
Corruption Perceptions Index
The most recent release of Transparency
International’s Corruption
Perceptions Index (CPI) occurred in 2019. The index uses the
perceptions of experts and businesspeople to provide a measure of the level of
public sector corruption in a nation. The measure is provided in the form of a
score, with 100 representing the absence of corruption, and 0 representing a
high level of corruption. In the 2019 release, Australia ranked 12th in the
world out of 180 nations, with a score of 77. This is a one rank increase
from the previous year, maintaining the same score of 77.
Figure 4: Corruption Perceptions Index 2019
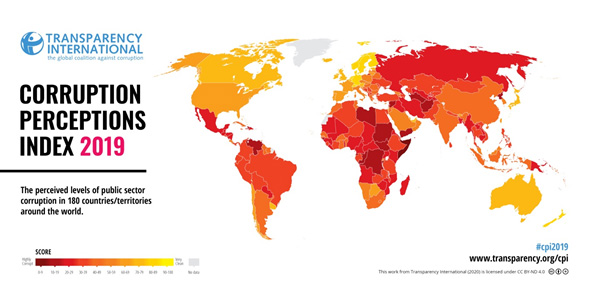
Source: Transparency International, Corruption
Perceptions Index 2019 (download
‘Maps’), accessed 16 November 2020.
What
does it measure?
The Corruption Perceptions Index measures the
perceived level of public sector corruption. Transparency International obtains
data from 13 data sources which measure public sector corruption—the
Economist Intelligence Unit’s Country Risk Service, for
example—with each source fulfilling a set of requirements to be considered.
The requirements include reliable and valid methodology, the rating of a
substantial number of countries, and the credibility of the source. Sources are
then standardised on a scale of 0-100, with the average being used as a
nation’s score. Standardisation is achieved through the subtraction of
the mean of each source in a set baseline year from each country score, which
is then divided by the standard deviation from the baseline year. Following
this, standardised scores are transformed to a 0-100 scale through the
multiplication of the score by the CPI standard deviation in 2012, and the
addition of the mean from the 2012 CPI. Transparency International also
provides a measure of uncertainty in their reporting, in the form of standard
errors and confidence intervals associated with each score.
Commentary
Similar to other indexes, the main criticism of the Corruption
Perceptions Index is that it is based on subjective rankings. It is
important to note, however, that these rankings are based on expert, rather
than analyst, views. The measure has also come under criticism for not being a
good measure of actual corruption, as Xypolia notes in The
Conversation: ‘What these indexes have in common is
that they are all largely based on surveys about perceptions on corruption
– personal judgements, not hard data’:
... One of the reasons why we rely on these
indexes is because we have struggled to come up with anything better.
Corruption by its very nature usually takes place away from the public eye and
records, which makes it difficult to measure.
5. Education
Programme for International Student
Assessment
The OECD Programme
for International Student Assessment (PISA) undertakes testing
of 15 year old students in three areas: reading, mathematics, and science. The
test is undertaken every three years, with the most recent results released in
2018. Students were assessed in 79 countries and economies, with a
particular focus on OECD countries. In the 2018 results, Australian students
received a mean reading score of 503, statistically significantly above the
OECD average of 487, but far below the 555 score achieved by mainland China. In
mathematics, Australia scored only slightly above the OECD average, scoring 491
points against the average of 489. This ranks below most comparator
countries such as New Zealand, Canada, and the United Kingdom, but above the
United States. The highest score for mathematics was China, who scored 591
points. In science, Australia received 503 points, relative to the OECD
average of 489 points. China received the highest score of 590 points. While consistently
above the OECD average, the rankings do show that Australia has room for
improvement, regularly featuring below many countries of cultural comparison.
Relative to 2015, Australia’s scores in the science and mathematics
categories have decreased, as have OECD averaged; while Australia has
maintained the same reading score with a slight decrease in OECD average.
What does it measure?
PISA seeks to test students on their proficiency across the
areas of reading, mathematics and science. To do so, a test framework is
developed. In developing the framework, international experts from each area
are enlisted to develop their respective area, with the framework agreed upon
by countries. Students are sampled from a population of 15 year olds within a
country. Questions within a test range from low to high difficulty, with
proficiency within a subject determined by an ability to answer questions successfully.
PISA scores are set relative to the variation in results on a normal
distribution, with mean scores around 500 points, and standard deviations
around 100 points. As such, a score of 490 in one year does not necessarily
reflect the same as a score of 490 in another year.
Commentary
The core advantage of PISA is that is tests students on
their ability to complete practical tasks. Unlike other indexes of education
which rely on years in schooling or population completion rates of schooling,
PISA provides a snapshot of one of the key goals of an education system: the
development of students’ abilities to develop comprehension and problem
solving skills across a number of subjects. With that said, however, there are
aspects of education which PISA does not capture. Another of the core goals of
an education system is to provide students with the ability to succeed as part
of the labour force. Without incorporation of measures such as completion
rates, and rates assessing transitions to work, PISA fails to capture some core
components of education. Furthermore, the variability of scores across time
limits the comparability of countries performance across years, instead meaning
comparisons must be drawn on performance relative to other countries year on
year. For other measures which incorporate a broader range of indicators, see
the OECD’s
Better Life Index Education section, or the UNDP
Education Index (p. 54).
6. Environment
Environmental Performance Index
The Environmental
Performance Index (EPI) is a joint project of the Yale Center for
Environmental Law & Policy, and the Center for International Earth Science
Information Network at Columbia University. The EPI was most recently released in 2020.
It assessed 180 countries, with rankings constructed on two core categories—environmental
health and ecosystem vitality—comprised of 32 indicators. Australia
ranks 13 with a score of 74.9, receiving the 11th highest score for
environmental health of 91.6, but a middling score for ecosystem vitality of
63.8. This is a 5.5 point improvement across 10 years.
Table 1: 2019 Environmental Performance Index Rankings
| Rank |
Country |
EPI
Score |
10-Year
Change |
| 1 |
Denmark |
82.5 |
7.3 |
| 2 |
Luxembourg |
82.3 |
11.6 |
| 3 |
Switzerland |
81.5 |
8.6 |
| 4 |
United Kingdom |
81.3 |
9.0 |
| 5 |
France |
80.0 |
5.8 |
| 6 |
Austria |
79.6 |
5.4 |
| 7 |
Finland |
78.9 |
6.0 |
| 8 |
Sweden |
78.7 |
5.3 |
| 9 |
Norway |
77.7 |
7.6 |
| 10 |
Germany |
77.2 |
1.2 |
| 11 |
Netherlands |
75.3 |
1.5 |
| 12 |
Japan |
75.1 |
-0.5 |
| 13 |
Australia |
74.9 |
5.5 |
Source: Environmental Performance Index, 2020 Environmental
Performance Index, accessed 16 November 2020.
What does it measure?
The EPI is influenced by two policy objectives:
environmental health, which seeks to measure environmental threats to human
health, such as poor air quality; and ecosystem vitality, a measure of a
country’s natural resources and ecosystem, such as biodiversity and
forests. Each of the policy objectives is informed by a number of categories,
with each category informed by indicators. The EPI is a hierarchical model,
with weighting occurring at each stage to inform the next step. Indicators are
normalised on a 0-100 scale for consistency. The weights are informed through
objective and subjective means: for environmental health, weights are assigned
based on the distribution of disability-adjusted life-years, or DALYs, lost to
environmental health influences; whereas for ecosystem vitality, weights are
subjective, informed by previous literature in the area. The overall indicator
is weighted 40 per cent in environmental health, and 60 per cent in ecosystem
vitality.
Commentary
The EPI represents a comprehensive measurement of
environmental health and performance within countries, accounting for a broad set
of environmental indicators. There is, however, a notable omission of policy
considerations from the metrics: the framework does not engage with areas such
as broader environmental policies related to climate change or clean energy.
The EPI is complemented by other indexes which focus on specific areas, such as
the Climate Change Performance Index
and the Global
Adaptation Index.
7. Health
Global Health Security Index
The Global Health
Security Index, or GHS Index, is a joint project of the Nuclear Threat
Initiative and the John Hopkins Center for Health Security, developed by the
Economist Intelligence Unit. The GHS Index measures health security and associated
health response capabilities, with the first index released in 2019. The
measure is applied to 195 countries. The index is developed with a focus on six
health security and response categories: prevention, detection and reporting,
rapid response, health system, compliance with international norms, and risk
environment. In the 2019 index, Australia ranked 4th, with an index
score of 75.5.
Table 2: 2019 Global Health Security Index Results
| Rank |
Country |
Index
Score |
Region |
Population |
Income |
| 1 |
United States |
83.5 |
Northern America |
100m+ |
High income |
| 2 |
United Kingdom |
77.9 |
Europe |
50-100m |
High income |
| 3 |
Netherlands |
75.6 |
Europe |
10-50m |
High income |
| 4 |
Australia |
75.5 |
Oceania |
10-50m |
High income |
| 5 |
Canada |
75.3 |
Northern America |
10-50m |
High income |
| 6 |
Thailand |
73.2 |
Southeastern Asia |
50-100m |
Upper middle income |
| 7 |
Sweden |
72.1 |
Europe |
1-10m |
High income |
| 8 |
Denmark |
70.4 |
Europe |
1-10m |
High income |
| 9 |
South Korea |
70.2 |
Eastern Asia |
50-100m |
High income |
| 10 |
Finland |
68.7 |
Europe |
1-10m |
High income |
Source: Global Health Security Index, Country Ranking View of Index Results,
2019, accessed 16 November 2020.
What does it measure?
The GHS seeks to measure a country’s preparedness for
a mass health event, such as a pandemic. It is comprised of indicators across
six categories, with a focus on prevention of pathogens, a detection of and
quick response to such pathogens, and the ability of a health system in dealing
with such events. All data is obtained from open-source information, such has
country-reported data, or that reported by international bodies, like the World
Health Organization. The index is comprised of 34 indicators, which in turn are
made up of 85 subindicators. For example, the ‘prevent’ category is
comprised of six indicators, one of which is biosafety. Biosafety is scored
according to two subindicators: whole-of-government biosafety systems; and
biosafety training and practices. The overall index score is obtained by
averaging the six category scores, with each category weighted equally.
Commentary
Given the events of the COVID-19 pandemic, the GHS proved
correct in noting that discussion and preparedness for such events was
necessary. The index has, however, proven to be inaccurate in its assessments
of country capabilities when contrasted with evidence that has arisen from the
pandemic. Abbey
et al., for example, compare GHS rankings of OECD countries with an assessment
of their performance throughout the pandemic. Of the five highest ranked OECD
countries in the GHS, only Australia has performed well, ranking second in the
authors’ multi-criteria rank. Alternatively, out of the 36 OECD countries
assessed, the top three countries in the GHS—the United States, United
Kingdom, and Netherlands—rank 32nd, 35th and 36th, respectively. Abbey et
al. posit that a possible explanation for over- and under-performing countries
in the pandemic has been the role of political leadership, a variable
unassessed in the GHS. While the GHS has correctly identified a requirement for
increased health security awareness, the recent pandemic has highlighted a need
for the index to assess their inputs. There are few health indexes available,
but the World Health Organization
publish a wide range of health statistics useful for identifying a
country’s performance in a number of areas.
8. Human Rights
Freedom in the World Index
The Freedom House Freedom
in the World report provides a numerical rating of freedom, based on
political rights and civil liberties. Countries are assigned a ranking out of
100, with 0 being not at all free, and 100 being fully free. Freedoms are assessed
on the basis of two subcategories relating to political rights and civil
liberties. In the most recent report, released in 2020, Australia achieved a
score of 97, ranking
jointly at 8th in the world, tied with Denmark, Ireland and New Zealand.
Over the past 10 years, Australia has increased in score from 96 to 97. The
three areas in which Australia’s
ranking did not score highly were all related to civil liberties: scoring 3
out of 4 points for freedom and independence of the media; 3 out of 4 points
for the equal treatment of the population under the law, policies and practice;
and 3 out of 4 points for freedom and opportunity from economic exploitation.
On the final two points, Indigenous peoples are noted as falling behind the
rest of the population.
Figure 5: Freedom in the World 2020
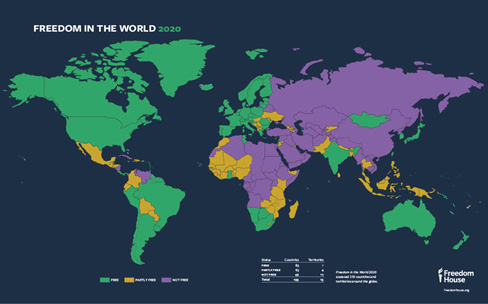
Source: Freedom House, Freedom
in the World 2020, p. 7, accessed 16 November 2020.
What
does it measure?
The overall measure is a score based on two categories:
political rights; and civil liberties. Each category is further addressed at
several sublevels. Using 25 measures (each scoring out of 4), political rights
are assessed based on electoral process, political pluralism and participation,
and the functioning of government; civil liberties are assessed based on
freedom of expression and belief, associational and organisational rights, rule
of law, and personal autonomy and individual rights. Each sublevel is also
provided with guiding questions to assist analysts with ratings. Due to its
broad scope, the Freedom in the World Index incorporates a number of relevant
freedoms in its measure. Most notable of these is freedom of the media,
included as a measure of civil liberty.
Commentary
Critiques of Freedom House’s Index and other human
rights indexes relate to the fact that, although there may be methodological
guidelines, ratings are still largely
subjective. Furthermore, since the ratings consider a broad overview of
freedom, human rights records might not be fully considered. For example, in
2017 the United Nations released
a statement criticising Australia’s human rights performances in
various areas, namely treatment of refugees and indigenous rights. These
criticisms are not necessarily reflected in the Index.
9. Inequality
OECD Income Inequality
A traditional economic measure for income inequality is the
Gini coefficient. The OECD publishes calculations of the income Gini
coefficient for all OECD countries. The OECD’s Income
inequality measure reports Australia had a Gini coefficient of 0.33 in 2019,
where 1 denotes complete inequality and 0 denotes complete equality. This is
higher than the median coefficient in the OECD, with Australia having the 14th
highest coefficient of the 35 measured OECD countries. Income distribution
in Australia is more equal than 13 other OECD countries.
Figure 6: OECD Income Inequality
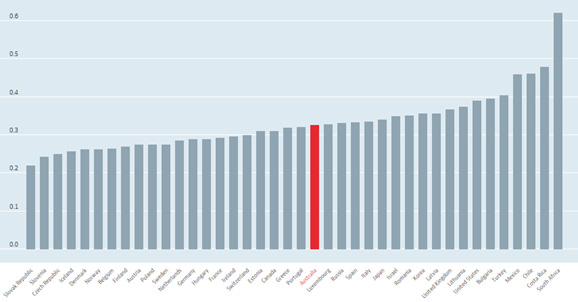
Source: OECD Data, Income inequality,
2019, accessed 16 November 2020.
What
does it measure?
In order to calculate income inequality, we must first
provide a definition of income. The OECD defines
a household’s disposable income as earnings, self-employment and capital
income plus public cash transfers, with income taxes and social security
contributions deducted. The income of a household is attributed
to each of its members, with an adjustment to reflect differences in needs for
households of different sizes. The Gini coefficient is based on the comparison
of cumulative proportions of the population against cumulative proportions of
income they receive, and it ranges between 0 in the case of perfect equality
and 1 in the case of perfect inequality.
Commentary
In comparison to the OECD
average, Australia has a relatively high level of income inequality—22 of
35 countries have lower measures of income inequality. However, in comparison
with countries that share similarities with Australia’s cultural and
political framework (including Canada, the United Kingdom and the United
States), Australia maintains more income equality. Of those countries, only
Canada has a lower score for income inequality, with a Gini coefficient of
0.307. The World Economic Forum provides an extensive analysis of gender
inequality in its The Global
Gender Gap Report 2020, in which Australia ranks 44th out of 153
countries.
10. Innovation, science &
technology
Global Innovation Index
The Global
Innovation Index, a joint project by Cornell University, INSEAD and the
World Intellectual Property Organization, provides a measure of innovation
within nations using a combination of data across seven areas: institutions;
human capital and research; infrastructure; market sophistication; business
sophistication; knowledge and technology outputs; and creative outputs. Also
included in the rankings are innovation input and output sub-indexes, which are
used to calculate the Global Innovation Index, and the efficiency ratio
of the country. In the 2020 report, which covered 131 economies, Australia
ranked 23rd in the Global Innovation Index, a decrease of one spot
from the previous year. Australia performed best in the category of market
sophistication, ranking 7th in the world, but was dragged down by a ranking of
40th in the category of knowledge and technology outputs.
What
does it measure?
The Global Innovation Index is measured across seven
areas. Each section has three different subsections, each comprising a set of
indicators. For example, the institutions pillar is comprised of the three
subsections of political environment, regulatory environment, and business
environment. The political environment subsection is comprised of two
indicators: political and operational stability, obtained through the IHS Markit
Country Risk scores; and government effectiveness, obtained through the
World Bank’s Worldwide
Governance Indicators. Subsection scores are calculated as a weighted
average of the relevant indicators, with section scores being calculated as a
weighted average of the relevant subsections. As such, the Global Innovation
Index includes a wide array of data and indicators, leading to a broad
interpretation of innovation. For example, while factors such as education and
infrastructure may directly influence innovation, underlying factors such as
political stability are also influential in the institutional structure of innovation.
The index is largely comprised of data-based indicators. Of the 80 indicators,
58 are drawn from hard data, 18 from indexes, and just 4 are formed in
qualitative ways, through surveys of experts.
Commentary
The Global Innovation Index provides an extensive
measure of innovation. The indicators used for the index are largely
quantitative, with only five of the 80 indicators based on qualitative data.
This leads to a robust index, as the limited qualitative inputs allows for a
more impartial index. While the index provides a wide-ranging measure of
innovation, incorporating factors such as education, science and technology,
other indexes may be more useful when looking for a specific measure of each of
those factors.
11. Politics and democracy
Democracy Index
The Economist Intelligence Unit’s Democracy Index uses
various indicators to assess the quality of democracy in 167 countries. The
index is based on 60 indicators across five categories: electoral process and
pluralism; the functioning of government; political participation; political
culture; and civil liberties. The most recent ratings for 2019 were released in
2020. Australia received a score of 9.09 out of 10, ranking it 9th. Australia’s
score of 9.09 has remained stable over time, with a score of 9.09 in 2006,
dropping as low as 9.01 from 2014-2016, before rising back to 9.09 from 2017.
Figure 7: Democracy Index 2019
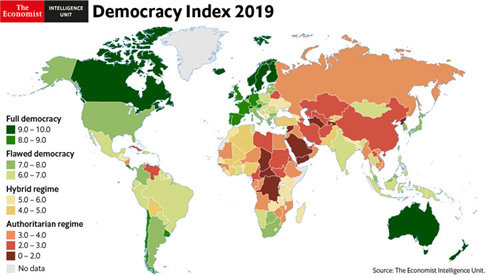
Source: Global Democracy Ranking, Democracy Index 2019,
accessed 16 November 2020.
What
does it measure?
Each of the five categories has a rating on a 0 to 10 scale;
the overall index is the simple average of the five category indexes. The
category indexes are based on the sum of the indicator scores in the category.
Examples of indicators include: freedom to form political parties; the
pervasiveness of corruption; the percentage of women in parliament; perceptions
of military rule; and freedom to form professional organisations and trade
unions. Adjustments to category scores are made if countries do not score a 1
in the following critical areas of democracy: whether national elections are
free and fair; the security of voters; the influence of foreign powers on
government and the capability of the civil service to implement policies. In
addition to experts’ assessments, the EIU uses, where available, public
opinion surveys—particularly in the political participation and political
culture categories. Index values are used to place countries within one of four
types of regime: full democracies; flawed democracies; hybrid regimes; and
authoritarian regimes.
Commentary
In order to limit subjective responses, the Democracy Index
combines expert assessments with public opinion data. Alternative measures, for
example that published by Freedom House (see index 8. Human Rights), use
only qualitative assessments to assign scores to countries. However, the
inclusion of dichotomous values (which take the value of 0, 0.5 or 1) in the
Democracy Index, removes some of the nuance achieved in other measures. For
example, the indicator ‘public confidence in parties’ takes on a
value of 1, if more than 40 per cent have confidence; 0.5 if it lies between 25
and 40 per cent; and 0 if less than 25 per cent.
12. Press freedom and the rule of law
World Press Freedom Index
The World Press Freedom
Index is published by Reporters Without Borders (RSF). The
degree of freedom available to journalists in 180 countries is determined by
pooling the responses of experts to a questionnaire
(with 87 questions) devised by RSF. This qualitative analysis is combined with
quantitative data on abuses and acts of violence against journalists during the
period evaluated. The criteria evaluated in the questionnaire are pluralism,
media independence, media environment and self-censorship, legislative
framework, transparency, and the quality of the infrastructure that supports
the production of news and information. These are combined with data on abuses
and violence against journalists and media outlets. Countries are given scores
ranging from 0 to 100, with 0 being the best possible score and 100 the worst.
In the 2020 rankings, Australia ranked 26th with a score of 20.21, a
fall of five places since 2019.
Figure 8: World Press Freedom Index
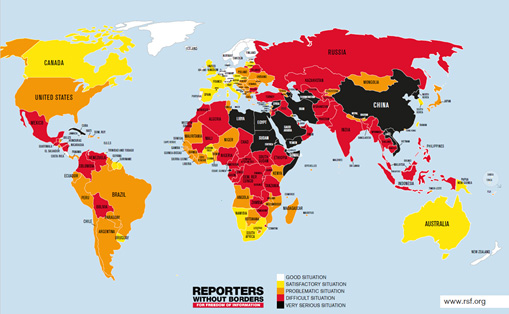
Source: Reporters Without Borders, 2020 World Press Freedom Index, accessed
16 November 2020.
What
does it measure?
The RSF calculates two scores. The first, ScoA is based on
the first six of the seven indicators listed above; the second, ScoB, combines
the first six measures with the seventh (abuses). (The abuses
indicator for each country is calculated on the basis of the data about the
intensity of abuses and violence against media actors during the period
evaluated.) A country’s final score is the greater of these two
scores. The method prevents an inappropriately low score (high ranking) being
given to a country where few or no acts of violence against journalists take
place because the provision of news and information is tightly controlled.
Commentary
The use of two measures provides a useful way to compare
press freedom across countries with very different journalism industries. In
some nations, particularly those with a tightly controlled, government-directed
industry, explicit abuses may be minimal. For example, the second lowest ranked
country in the index, Turkmenistan, has 0 abuses listed. However, its poor results
in ScoA results in a worse ranking. On the other hand, a country such as
Afghanistan has, relative to other countries in the region, a low score when it
comes to ScoA, but due to a high measure of abuses scores much higher in the
second measure, leaving it with a ranking of 122. With zero abuses, for
example, Afghanistan would have ranked 94th.
13. Renewable energy
Renewable Energy Country
Attractiveness Index
The Renewable
Energy Country Attractiveness Index (RECAI) is
developed by EY, with the most recent rankings published in May 2020. RECAI
ranks the top 40 countries in the world on the attractiveness of their
renewable energy investment and deployment opportunities. It assesses five
domains: macro vitals; energy imperative; policy enablement; project delivery;
and technology potential. Australia ranks well relative to other countries,
placing 4th behind the United States, China and France, but ahead of
Germany and the United Kingdom.
Table 3: 2020 Renewable Energy Country Attractiveness Index
| Rank |
Country |
Change
from
2016 |
| 1 |
United States |
0 |
| 2 |
China |
0 |
| 3 |
France |
5 |
| 4 |
Australia |
6 |
| 5 |
Germany |
0 |
| 6 |
United Kingdom |
7 |
| 7 |
India |
-4 |
| 8 |
Denmark |
7 |
| 9 |
Netherlands |
8 |
| 10 |
Japan |
2 |
Source: EY, Renewable
Energy Country Attractiveness Index May 2020 and Renewable
Energy Country Attractiveness Index May 2016, accessed 16 November 2020.
What does it measure?
The RECAI rankings factor various parameters from five
groups relevant to the renewable energy industry. All parameters are shown in
Figure 10 below.
Figure 9: Renewable Energy Country Attractiveness Index—Methodology
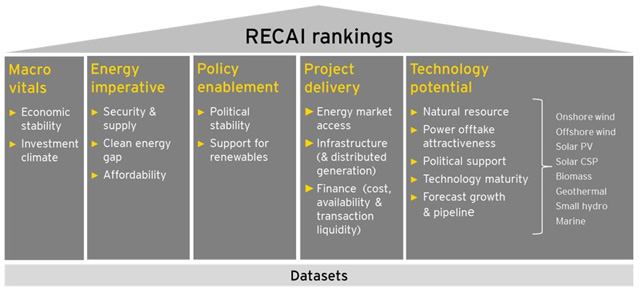
Source: EY, RECAI
Methodology, EY Renewable Energy Country Attractiveness index, 2019,
accessed 16 November 2020.
Each of the five pillars is assessed based on a set of
parameters. Each parameter is assessed through a series of datasets, with each
dataset converted to a range from 1-5. Parameter scores are then weighted based
on these scores. The various factors were chosen according to their role in
increasing the market attractiveness of renewable energies. This includes
economic, political and technological factors, as technological inputs are of
limited effectiveness if there is not a stable and supportive government, or a
stable economy, enabling the exploitation of their full potential.
Commentary
The RECAI provides a measure of the availability and
progression of renewable energies across 40 countries. Other indexes—such
as the World Bank’s measures of Energy and Mining—are
more useful when assessing energy output and composition as a whole. One such
measure is fossil fuel and renewable energy as a percentage of total final
consumption.
14. Security and safety
Safe Cities Index
The Economist Intelligence Unit’s (EIU’s) Safe Cities
Index (SCI) assesses urban security using 57 indicators across 60 cities.
The index—measured on a scale of 0 to 100, with 100 representing
‘best health’—uses four broad pillars: digital security;
health security; infrastructure security; and personal security. The most
recent iteration of the SCI was released in 2019, with two Australian cities
being assessed: Sydney was ranked 5th with a score of 87.9; Melbourne
was ranked 10th with a score of 87.3.
Table 4: 2019 Safe Cities Index Rankings
| Rank |
City |
Score |
2017 score |
| 1 |
Tokyo |
92.0 |
89.8 |
| 2 |
Singapore |
91.5 |
89.6 |
| 3 |
Osaka |
90.9 |
88.9 |
| 4 |
Amsterdam |
88.0 |
87.3 |
| 5 |
Sydney |
87.9 |
86.7 |
| 6 |
Toronto |
87.8 |
87.4 |
| 7 |
Washington, DC |
87.6 |
80.4 |
| =8 |
Copenhagen |
87.4 |
N/A |
| =8 |
Seoul |
87.4 |
83.6 |
| 10 |
Melbourne |
87.3 |
87.3 |
Source: Economist Intelligence Unit, Safe
Cities Index 2019, p. 15, accessed 16 November 2020 and Economist
Intelligence Unit, Safe
Cities Index 2017, p. 5, accessed 16 November 2020.
What
does it measure?
As noted above, the SCI is comprised of four, equally
weighted pillars. There are 57 indicators: 17 quantitative; and 40 qualitative.
Every city is scored across input and output performance within and across the
four domains. Each domain comprises between eight and 21 indicators, divided
between inputs (capacity/preparedness-driven), such as policy measures and
access to services, and outputs (performance-driven), such as air quality and
the prevalence of crime. Digital security assesses the ability of urban
citizens to freely use the internet and other digital channels without fear of
privacy violations or identity theft. Health security measures how
cities fare in terms of environmental policy as well as the level and quality
of healthcare available to residents. Infrastructure security considers
the built physical environment, such as city infrastructure and its
vulnerability to disasters and terrorist attacks. Personal security
considers how at-risk citizens are from crime, violence, man-made threats and
natural disasters.
Commentary
The SCI presents a measure of safety within a city,
assessing various elements that contribute to security. By comparison, in the
OECD’s Better
Life Index, Australia ranks 27th out of 40 in safety. Although having a
rate of homicide well below the OECD average, only 63 per cent feel safe
walking home at night (below the OECD average). The contrast between the two
indexes presents an interesting divergence in the assessment of safety in
Australia.
15. Tourism
The Travel & Tourism
Competitiveness Index
The World Economic Forum’s (WEF’s) Travel
& Tourism Competitiveness Report presents the Travel & Tourism
Competitiveness Index (TTCI) which, published biennially, benchmarks the travel
and tourism competitiveness of 140 economies and measures the ‘set of
factors and policies that enable the sustainable development of the Travel
& Tourism (T&T) sector, which in turn, contributes to the development
and competitiveness of a country’.
The index is comprised of four subindexes: the enabling
environment; travel and tourism policy and enabling conditions; infrastructure;
and natural and cultural resources. Each subindex includes a number of pillars.
In total, there are 14 pillars and 90 individual indicators, distributed among
the different pillars. Countries are assigned a score between 1 and 7 based on
how they perform, with better performing countries achieving higher scores. In
the 2019 release of the TTCI, Australia was ranked 7th with a score of
5.1. Spain, France, Germany, Japan, the United States and the United Kingdom
received higher scores.
Figure 10: 2019 Travel & Tourism Competitiveness Index—Rankings
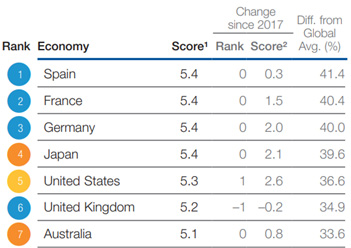
Source: World Economic Forum, ‘Travel
& Tourism Competitiveness Report’, 2019, p. xiii, accessed 16
November 2020.
What
does it measure?
Each of the four subindexes is made up of a number of
pillars. Subindexes and pillars are shown in Figure 12.
Figure 11: Travel & Tourism Competitiveness Index - Methodology
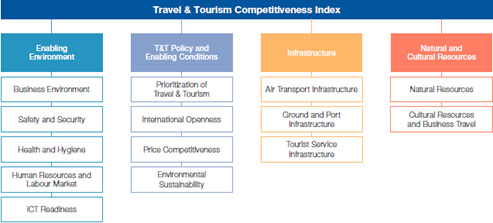
Source: World Economic Forum, ‘Travel
& Tourism Competitiveness Report’, 2019, p. ix, accessed 16 November
2020.
Each pillar is compiled of various indicators, with scores
for the pillars calculated as an unweighted average of these indicators. For
example, the enabling environment subindex is comprised of 12 business
environment indicators, five safety and security indicators, six health and
hygiene indicators, nine human resources and labour market indicators and eight
ICT readiness indicators. Each subindex score is calculated as the average of
the contributing pillars. Likewise, the total score for the TTCI is calculated
as the average of the subindexes.
Two thirds of the dataset for the TCCI is statistical data
from international organisations. The remaining third is based on survey data
from the WEF’s annual Executive Opinion Survey, which is used to measure
qualitative concepts.
Commentary
The 2019 Travel & Tourism Competitiveness Report
finds that travel and tourism competitiveness continues to improve worldwide,
but also flags that future demand for transportation services, especially
aviation, might outpace improvements in infrastructure capacity.
Analysis of TTCI subindexes can help to identify areas for
improvement. For example, while Australia appears to rank well across the
board, improvements could be made if we look at the travel and tourism policy
and enabling conditions, where Australia ranks a joint 28th. Australia’s
environmental sustainability—measured using policy indicators such as the
stringency and enforcement of government’s environmental regulations, and
variables assessing the status of water, forest resources and marine
life—ranks 49th, alongside Romania and Tanzania.
16. Well-being and happiness
World Happiness Report
The most recent World Happiness Report was
released in 2020. The report indicates that Australia ranks relatively well in
terms of happiness—measured across six variables—ranking 12th
out of 153 countries. Compared to the 2016 report, this is a drop of 3
ranks from 9, with a reduction in score from 7.313 to 7.223.
Figure 12: 2020 World Happiness Rankings
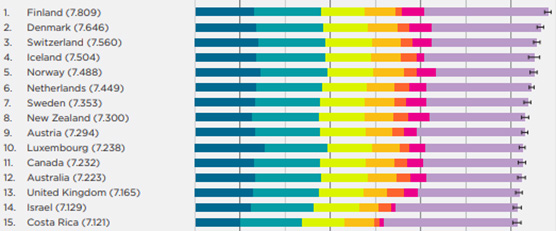
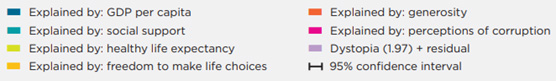
Notes: Dystopia is a hypothetical country with ‘values
equal to the world’s lowest national averages’ (p. 16). Residual ‘simply
represents that part of the national average ladder score that is not explained
by our model’ (p. 18).
Source: J Helliwell et
al. (eds), World Happiness Report 2020,
p. 19, accessed 16 November 2020.
What
does it measure?
The 2020 update presents average life evaluation scores for
153 countries. These scores are based on subjective responses to the Cantril
ladder question: participants are asked to imagine their position in a ladder
from 0 to 10, with 10 representing the best possible life, and 0 the worst
possible.
The authors consider six key variables:
- GDP per capita
- healthy years of life expectancy
- social support (as measured by having someone to count on in
times of trouble)
- trust (as measured by a perceived absence of corruption in
government and business)
- perceived freedom to make life decisions
- generosity (as measured by recent donations).
Furthermore, the 2020 report focuses on the influences
of environments on happiness, in particular the effects of social, urban and
natural environments.
Commentary
The notion of gauging the development of a nation based on
individual, self-reported life evaluation measures has been criticised, with some
debating ‘whether subjective views are truly measurable’ (p. 266).
However, the OECD report How’s
Life: Measuring Well-Being states ‘a large body of recent
research has shown … that it is indeed possible to make valid comparisons
between different groups of people’ (p. 266). It further states:
Measures of life satisfaction are a useful complement to more
traditional indicators based on objective conditions because they present an
overall picture of well-being that is grounded in people’s preferences
rather than in a-priori judgements about what are the important drivers of
individuals’ well-being. (p. 266)
The authors acknowledge a range of statistical and
analytical limitations, such as the risk that the explanatory ‘variables
[they] use may be taking credit properly due to other variables, or to unmeasurable
factors’ (p. 18). Nevertheless, in the 2016 report, the authors
argue:
that happiness, as measured by life evaluations, provides a
broader indicator of human welfare than do measures of income, poverty, health,
education, and good government viewed separately. We now make a parallel
suggestion for measuring and addressing inequality. Thus we argue that
inequality of well-being provides a better measure of the distribution of
welfare than is provided by income and wealth … (p. 4)
For copyright reasons some linked items are only available to members of Parliament.
© Commonwealth of Australia
Creative Commons
In essence, you are free to copy and communicate this work in its current form for all non-commercial purposes, as long as you attribute the work to the author and abide by the other licence terms. The work cannot be adapted or modified in any way. Content from this publication should be attributed in the following way: Author(s), Title of publication, Series Name and No, Publisher, Date.
To the extent that copyright subsists in third party quotes it remains with the original owner and permission may be required to reuse the material.
Inquiries regarding the licence and any use of the publication are welcome to webmanager@aph.gov.au.
This work has been prepared to support the work of the Australian Parliament using information available at the time of production. The views expressed do not reflect an official position of the Parliamentary Library, nor do they constitute professional legal opinion.
Any concerns or complaints should be directed to the Parliamentary Librarian. Parliamentary Library staff are available to discuss the contents of publications with Senators and Members and their staff. To access this service, clients may contact the author or the Library‘s Central Enquiry Point for referral.