7
November 2019
PDF version [1MB]
Gregory O'Brien
Statistics and Mapping Section
Executive
summary
- This paper, a companion to the Monthly Statistical Bulletin
published by the Parliamentary Library, provides tables and charts for a broad
range of social, demographic and economic indicators across all Australian
states and territories, and compares these with Australian averages.
- Each table presents data for the last five years to 2018–19 (or
the latest data available), while each chart plots data for the financial year
2018–19 (or the latest data available).
- Data used is the latest available as at September 16 2019.
Introduction
The purpose of this paper is to present a
range of economic and other statistical indicators for the states and
territories of Australia. To facilitate comparisons, indicators are presented
in relative terms such as growth rates, percentages, or proportions of gross
state product, so comparisons can be made using equivalent measures.
This publication is a companion to the Monthly
Statistical Bulletin which contains Australia-wide data only, but on a more
frequent basis.
A glossary of social, demographic and economic terms used in
the tables is provided at the end of this publication.
Data
Sources
Data sources are listed at the bottom of the page for each
indicator. All data is from an original ABS series unless otherwise indicated
as a trend or seasonally adjusted series.
Historical
Data
Long-term data series for every table in this paper and for
the Parliamentary Library’s companion publication, the Monthly
Statistical Bulletin, are available electronically and can be found on
the Parliamentary Library’s Monthly Statistical Bulletin and State Statistical
Bulletin pages.
Contents
Executive summary
Introduction
Chapter 1: Labour Market
1.1 Employment
1.2 Unemployment
1.3 Labour force
Chapter 2: Wages and Prices
2.1 Average weekly ordinary time
earnings
2.2 Real average weekly ordinary time
earnings
2.3 Male total average weekly earnings
2.4 Female total average weekly
earnings
2.5 Wage price index
2.6 Consumer price index
Chapter 3: State Accounts
3.1 Gross state product
3.2 Gross state product per capita
3.3 Labour productivity
Chapter 4: Business Conditions
4.1 Value of Retail Sales
4.2 Dwelling approvals
4.3 Business investment
Chapter 5: Housing
5.1 Lending for owner occupied housing
Chapter 6: Public Sector Finances
6.1 General government sector fiscal
balance
6.2 State and local government
taxation revenue
Chapter 7: Exports
7.1 Merchandise exports
Chapter 8: Social Statistics
8.1 Population
8.2 Capped apparent school retention
rates
8.3 General practice bulk billing
Glossary
Chapter 1: Labour Market
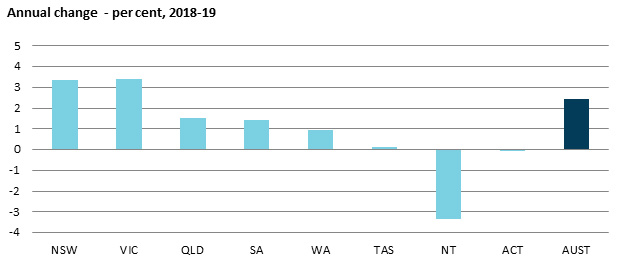
1.1 Employment
| |
2014-15 |
2015-16 |
2016-17 |
2017-18 |
2018-19 |
| Number employed (a) – '000 |
|
|
|
|
|
| New
South Wales |
3 647.1 |
3 783.7 |
3 826.1 |
3 946.8 |
4 079.6 |
| Victoria |
2 955.6 |
3 034.2 |
3 155.9 |
3 243.8 |
3 354.5 |
| Queensland |
2 324.2 |
2 362.5 |
2 366.6 |
2 464.5 |
2 502.1 |
| South
Australia |
803.4 |
807.1 |
818.0 |
835.7 |
847.7 |
| Western
Australia |
1 322.1 |
1 316.0 |
1 303.6 |
1 332.2 |
1 344.7 |
| Tasmania |
239.7 |
239.0 |
241.0 |
248.3 |
248.6 |
| Northern
Territory |
132.3 |
134.6 |
138.8 |
137.3 |
132.8 |
| Australian
Capital Territory |
211.5 |
214.7 |
220.7 |
228.4 |
228.3 |
| Australia |
11 636.0 |
11 891.7 |
12 070.7 |
12 437.1 |
12 738.3 |
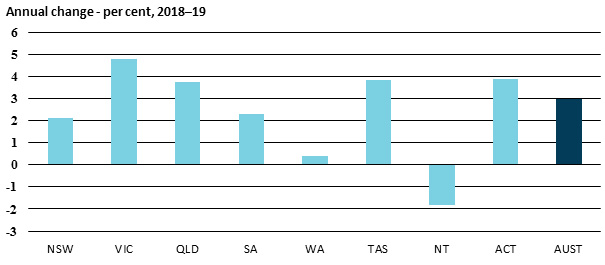
| Annual change – per cent |
|
|
|
|
|
| New
South Wales |
1.3 |
3.7 |
1.1 |
3.2 |
3.4 |
| Victoria |
2.5 |
2.7 |
4.0 |
2.8 |
3.4 |
| Queensland |
0.2 |
1.6 |
0.2 |
4.1 |
1.5 |
| South
Australia |
0.5 |
0.5 |
1.3 |
2.2 |
1.4 |
| Western
Australia |
1.1 |
-0.5 |
-0.9 |
2.2 |
0.9 |
| Tasmania |
2.9 |
-0.3 |
0.8 |
3.0 |
0.1 |
| Northern
Territory |
-0.2 |
1.7 |
3.1 |
-1.1 |
-3.3 |
| Australian
Capital Territory |
-0.4 |
1.5 |
2.8 |
3.5 |
0.0 |
| Australia |
1.3 |
2.2 |
1.5 |
3.0 |
2.4 |
| (a)
Total full-time and part-time employed; Annual average of monthly data. |
| Source:
ABS, Labour Force, cat. no. 6291.0.55.001 |
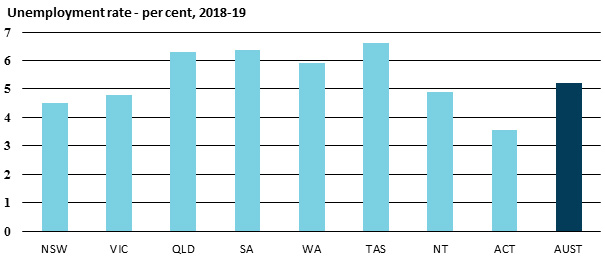
1.2 Unemployment
| |
2014-15 |
2015-16 |
2016-17 |
2017-18 |
2018-19 |
| Number unemployed (a) – '000 |
|
|
|
|
| New
South Wales |
228.8 |
215.8 |
199.5 |
200.5 |
189.4 |
| Victoria |
203.2 |
191.6 |
198.8 |
193.8 |
163.1 |
| Queensland |
161.3 |
155.1 |
156.1 |
158.4 |
162.7 |
| South
Australia |
59.8 |
63.1 |
58.9 |
51.9 |
52.0 |
| Western
Australia |
75.0 |
83.1 |
85.6 |
85.8 |
87.9 |
| Tasmania |
17.5 |
16.5 |
15.7 |
15.7 |
16.7 |
| Northern
Territory |
5.7 |
5.8 |
4.9 |
6.0 |
6.3 |
| Australian
Capital Territory |
10.2 |
10.3 |
8.8 |
9.4 |
8.5 |
| Australia |
761.5 |
741.2 |
728.3 |
721.6 |
686.6 |
| Unemployment rate (b) – per cent |
|
|
|
|
| New
South Wales |
5.8 |
5.0 |
4.8 |
4.8 |
4.5 |
| Victoria |
6.0 |
5.7 |
6.1 |
5.0 |
4.8 |
| Queensland |
6.3 |
6.2 |
6.1 |
6.1 |
6.3 |
| South
Australia |
7.6 |
6.8 |
6.5 |
5.6 |
6.4 |
| Western
Australia |
6.0 |
6.1 |
5.6 |
6.2 |
5.9 |
| Tasmania |
6.5 |
6.4 |
5.9 |
6.0 |
6.6 |
| Northern
Territory |
4.5 |
3.7 |
3.4 |
4.1 |
4.9 |
| Australian
Capital Territory |
4.5 |
3.7 |
4.0 |
3.6 |
3.6 |
| Australia |
6.1 |
5.6 |
5.6 |
5.4 |
5.2 |
| (a)
Annual average of monthly data. |
|
|
|
|
| (b)
Number unemployed as a proportion of the labour force, trend terms, as at
June of financial year. |
|
| Source:
ABS, Labour Force, cat. no. 6202.0, August 2019 |
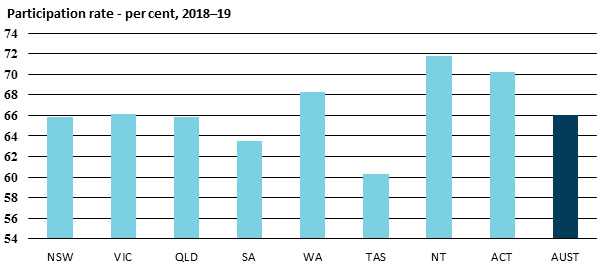
1.3 Labour force
| |
2014-15 |
2015-16 |
2016-17 |
2017-18 |
2018-19 |
| Labour force (a) – '000 |
|
|
|
|
|
| New
South Wales |
3 875.9 |
3 999.5 |
4 025.6 |
4 147.5 |
4 267.2 |
| Victoria |
3 158.8 |
3 225.7 |
3 354.7 |
3 437.8 |
3 516.6 |
| Queensland |
2 485.5 |
2 517.6 |
2 522.7 |
2 622.8 |
2 663.8 |
| South
Australia |
863.2 |
870.2 |
876.9 |
887.7 |
899.7 |
| Western
Australia |
1 397.0 |
1 399.0 |
1 389.2 |
1 417.9 |
1 432.4 |
| Tasmania |
257.2 |
255.5 |
256.7 |
264.0 |
265.3 |
| Northern
Territory |
138.0 |
140.4 |
143.8 |
143.4 |
139.0 |
| Australian
Capital Territory |
221.7 |
224.9 |
229.5 |
237.7 |
236.5 |
| Australia |
12 397.5 |
12 632.9 |
12 799.0 |
13 158.8 |
13 420.6 |
| Participation rate (b) – per cent |
|
|
|
|
| New
South Wales |
63.7 |
64.1 |
63.7 |
65.0 |
65.9 |
| Victoria |
64.7 |
65.3 |
66.2 |
65.6 |
66.2 |
| Queensland |
65.3 |
64.7 |
65.2 |
65.8 |
65.8 |
| South
Australia |
62.3 |
61.8 |
62.3 |
62.6 |
63.5 |
| Western
Australia |
68.6 |
67.5 |
67.7 |
68.5 |
68.3 |
| Tasmania |
60.8 |
59.5 |
61.0 |
61.3 |
60.3 |
| Northern
Territory |
76.6 |
75.0 |
75.5 |
76.0 |
71.8 |
| Australian
Capital Territory |
70.2 |
70.3 |
70.7 |
70.7 |
70.2 |
| Australia |
64.9 |
64.9 |
65.1 |
65.5 |
66.0 |
| (a)
Annual average of monthly data. |
|
|
|
|
| (b)
Labour force as a proportion of the civilian population aged 15 years and
over, trend series, as at June. |
|
| Source:
ABS, Labour Force, cat. no. 6202.0, August 2019 |
Chapter 2: Wages and Prices
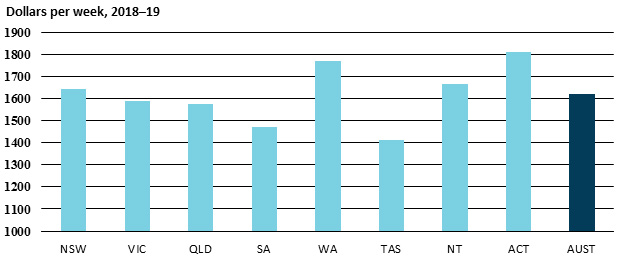
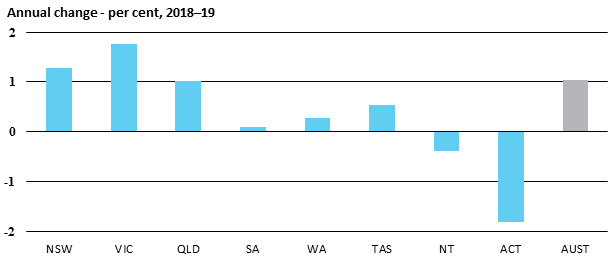
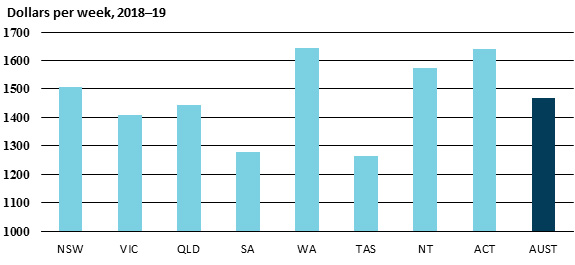
2.1 Average weekly ordinary time earnings
| |
2014-15 |
2015-16 |
2016-17 |
2017-18 |
2018-19 |
| AWOTE (a) (b) – $ per week |
|
|
|
|
|
| New
South Wales |
1 502.2 |
1 534.2 |
1 540.8 |
1 596.0 |
1 643.1 |
| Victoria |
1 396.6 |
1 439.7 |
1 503.9 |
1 534.8 |
1 588.6 |
| Queensland |
1 448.9 |
1 453.5 |
1 489.1 |
1 534.9 |
1 575.6 |
| South
Australia |
1 347.3 |
1 395.5 |
1 446.8 |
1 445.1 |
1 468.7 |
| Western
Australia |
1 682.2 |
1 703.7 |
1 709.0 |
1 741.6 |
1 769.0 |
| Tasmania |
1 277.9 |
1 326.7 |
1 349.0 |
1 367.8 |
1 410.0 |
| Northern
Territory |
1 483.7 |
1 561.4 |
1 627.5 |
1 658.2 |
1 666.8 |
| Australian
Capital Territory |
1 704.6 |
1 720.5 |
1 760.6 |
1 806.6 |
1 811.5 |
| Australia |
1 480.1 |
1 508.3 |
1 538.3 |
1 577.5 |
1 620.2 |
| Annual change – per cent |
|
|
|
|
|
| New
South Wales |
4.3 |
2.1 |
0.4 |
3.6 |
3.0 |
| Victoria |
0.9 |
3.1 |
4.5 |
2.1 |
3.5 |
| Queensland |
1.3 |
0.3 |
2.4 |
3.1 |
2.7 |
| South
Australia |
0.6 |
3.6 |
3.7 |
-0.1 |
1.6 |
| Western
Australia |
3.2 |
1.3 |
0.3 |
1.9 |
1.6 |
| Tasmania |
1.6 |
3.8 |
1.7 |
1.4 |
3.1 |
| Northern
Territory |
3.5 |
5.2 |
4.2 |
1.9 |
0.5 |
| Australian
Capital Territory |
2.2 |
0.9 |
2.3 |
2.6 |
0.3 |
| Australia |
2.4 |
1.9 |
2.0 |
2.5 |
2.7 |
| (a)
Annual average of bi-annual data. |
|
|
|
|
| (b)
Average weekly ordinary time earnings for full-time adult employees. |
|
|
| Care
should be taken when comparing average weekly earnings of states over time
due to compositional changes. |
| Source:
ABS, Average Weekly Earnings, cat. no. 6302.0, May 2019 |
2.2 Real average weekly ordinary time earnings
| |
2014-15 |
2015-16 |
2016-17 |
2017-18 |
2018-19 |
| Real AWOTE (a) (b) – $ per week |
|
|
|
|
| New
South Wales |
1 613.9 |
1 623.6 |
1 598.4 |
1 622.4 |
1 643.1 |
| Victoria |
1 511.4 |
1 533.5 |
1 572.1 |
1 568.8 |
1 596.5 |
| Queensland |
1 562.8 |
1 543.2 |
1 554.9 |
1 575.5 |
1 591.5 |
| South
Australia |
1 460.4 |
1 499.6 |
1 531.5 |
1 495.7 |
1 496.9 |
| Western
Australia |
1 808.5 |
1 814.3 |
1 808.2 |
1 825.9 |
1 830.9 |
| Tasmania |
1 404.3 |
1 438.4 |
1 436.2 |
1 425.9 |
1 433.6 |
| Northern
Territory |
1 577.8 |
1 658.1 |
1 726.0 |
1 741.3 |
1 734.5 |
| Australian
Capital Territory |
1 864.8 |
1 868.5 |
1 876.6 |
1 880.9 |
1 846.8 |
| Australia |
1 596.4 |
1 604.7 |
1 609.2 |
1 618.9 |
1 635.8 |
| Annual change – per cent |
|
|
|
|
|
| New
South Wales |
2.3 |
0.6 |
-1.6 |
1.5 |
1.3 |
| Victoria |
-0.5 |
1.5 |
2.5 |
-0.2 |
1.8 |
| Queensland |
-0.6 |
-1.3 |
0.8 |
1.3 |
1.0 |
| South
Australia |
-0.9 |
2.7 |
2.1 |
-2.3 |
0.1 |
| Western
Australia |
1.3 |
0.3 |
-0.3 |
1.0 |
0.3 |
| Tasmania |
0.5 |
2.4 |
-0.2 |
-0.7 |
0.5 |
| Northern
Territory |
2.1 |
5.1 |
4.1 |
0.9 |
-0.4 |
| Australian
Capital Territory |
1.1 |
0.2 |
0.4 |
0.2 |
-1.8 |
| Australia |
0.7 |
0.5 |
0.3 |
0.6 |
1.0 |
| (a)
Annual average. |
|
|
|
|
|
| (b)
Average weekly ordinary time earnings for full-time adult employees expressed
in average 2018–19 dollars; converted to real terms using the Consumer Price
Index. |
| Care
should be taken when comparing average weekly earnings of states over time
due to compositional changes. |
| Sources:
ABS, Average Weekly Earnings, cat. no. 6302.0, May 2019; ABS, Consumer
Price Index, cat. no. 6401.0, Jun 2019 |
2.3 Male total average weekly earnings
| |
2014-15 |
2015-16 |
2016-17 |
2017-18 |
2018-19 |
| MTAWE (a) (b) – $ per week |
|
|
|
|
|
| New
South Wales |
1 374.7 |
1 409.3 |
1 426.8 |
1 452.7 |
1 505.6 |
| Victoria |
1 275.4 |
1 294.4 |
1 332.5 |
1 368.5 |
1 407.1 |
| Queensland |
1 322.2 |
1 345.2 |
1 370.3 |
1 421.8 |
1 443.6 |
| South
Australia |
1 243.8 |
1 250.5 |
1 288.9 |
1 269.3 |
1 277.3 |
| Western
Australia |
1 685.0 |
1 634.7 |
1 637.7 |
1 649.4 |
1 643.0 |
| Tasmania |
1 157.6 |
1 163.9 |
1 188.5 |
1 248.7 |
1 265.1 |
| Northern
Territory |
1 472.0 |
1 586.9 |
1 658.7 |
1 687.5 |
1 572.8 |
| Australian
Capital Territory |
1 520.6 |
1 526.1 |
1 537.1 |
1 615.9 |
1 640.6 |
| Australia |
1 370.5 |
1 385.0 |
1 407.6 |
1 436.6 |
1 468.1 |
| Annual change – per cent |
|
|
|
|
|
| New
South Wales |
4.2 |
2.5 |
1.2 |
1.8 |
3.6 |
| Victoria |
-0.7 |
1.5 |
2.9 |
2.7 |
2.8 |
| Queensland |
-2.5 |
1.7 |
1.9 |
3.8 |
1.5 |
| South
Australia |
-2.8 |
0.5 |
3.1 |
-1.5 |
0.6 |
| Western
Australia |
3.4 |
-3.0 |
0.2 |
0.7 |
-0.4 |
| Tasmania |
3.8 |
0.5 |
2.1 |
5.1 |
1.3 |
| Northern
Territory |
4.1 |
7.8 |
4.5 |
1.7 |
-6.8 |
| Australian
Capital Territory |
1.6 |
0.4 |
0.7 |
5.1 |
1.5 |
| Australia |
1.1 |
1.1 |
1.6 |
2.1 |
2.2 |
| (a)
Annual average of bi-annual data. |
|
|
|
|
| (b)
Total average weekly earnings for all male employees. Not adjusted for CPI. |
| Source:
ABS, Average Weekly Earnings, cat. no. 6302.0, May 2019 |
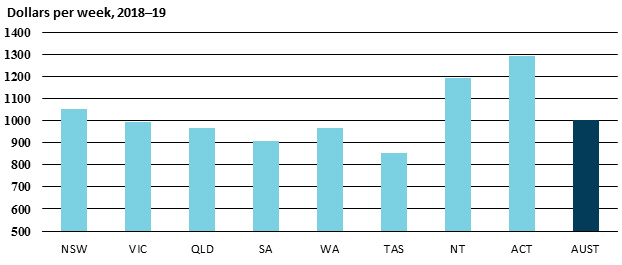
2.4 Female total average weekly earnings
| |
2014-15 |
2015-16 |
2016-17 |
2017-18 |
2018-19 |
| FTAWE (a) (b) – $ per week |
|
|
|
|
|
| New
South Wales |
916.3 |
962.6 |
977.5 |
1 020.4 |
1 052.2 |
| Victoria |
851.4 |
878.5 |
910.0 |
950.8 |
991.1 |
| Queensland |
885.0 |
895.7 |
892.2 |
906.9 |
967.5 |
| South
Australia |
854.7 |
825.0 |
866.9 |
886.7 |
907.1 |
| Western
Australia |
954.6 |
954.2 |
980.4 |
971.5 |
964.1 |
| Tasmania |
781.3 |
774.0 |
818.0 |
829.8 |
854.5 |
| Northern
Territory |
1 030.5 |
1 071.9 |
1 118.2 |
1 158.9 |
1 190.7 |
| Australian
Capital Territory |
1 185.3 |
1 219.2 |
1 221.7 |
1 234.9 |
1 291.2 |
| Australia |
897.9 |
920.3 |
939.6 |
967.9 |
1 003.6 |
| Annual change – per cent |
|
|
|
|
|
| New
South Wales |
0.7 |
5.1 |
1.5 |
4.4 |
3.1 |
| Victoria |
2.0 |
3.2 |
3.6 |
4.5 |
4.2 |
| Queensland |
6.0 |
1.2 |
-0.4 |
1.7 |
6.7 |
| South
Australia |
1.8 |
-3.5 |
5.1 |
2.3 |
2.3 |
| Western
Australia |
3.2 |
0.0 |
2.7 |
-0.9 |
-0.8 |
| Tasmania |
2.4 |
-0.9 |
5.7 |
1.4 |
3.0 |
| Northern
Territory |
2.0 |
4.0 |
4.3 |
3.6 |
2.7 |
| Australian
Capital Territory |
2.2 |
2.9 |
0.2 |
1.1 |
4.6 |
| Australia |
2.4 |
2.5 |
2.1 |
3.0 |
3.7 |
| (a)
Annual average of bi-annual data. |
|
|
|
|
| (b)
Total average weekly earnings for all female employees. Not adjusted for CPI. |
| Source: ABS, Average Weekly Earnings, cat. no. 6302.0,
May 2019 |
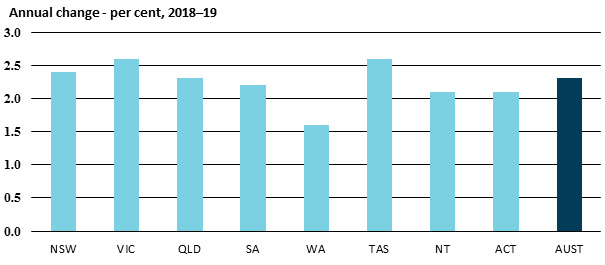
2.5 Wage price index
| |
2014-15 |
2015-16 |
2016-17 |
2017-18 |
2018-19 |
| Wage price index (a) (b) |
|
|
|
|
|
| New
South Wales |
119.8 |
122.4 |
124.9 |
127.5 |
130.6 |
| Victoria |
120.3 |
123.1 |
125.6 |
128.5 |
131.9 |
| Queensland |
120.5 |
122.8 |
125.1 |
127.9 |
130.8 |
| South
Australia |
120.4 |
123.1 |
125.8 |
128.4 |
131.2 |
| Western
Australia |
122.4 |
124.7 |
126.5 |
128.3 |
130.3 |
| Tasmania |
120.0 |
122.7 |
125.4 |
128.3 |
131.6 |
| Northern
Territory |
121.4 |
124.1 |
126.7 |
128.3 |
131.0 |
| Australian
Capital Territory |
119.7 |
121.7 |
124.0 |
126.4 |
129.0 |
| Australia |
120.4 |
123.0 |
125.4 |
127.9 |
130.9 |
| Annual change – per cent |
|
|
|
|
|
| New
South Wales |
2.3 |
2.2 |
2.0 |
2.1 |
2.4 |
| Victoria |
2.7 |
2.3 |
2.0 |
2.3 |
2.6 |
| Queensland |
2.4 |
1.9 |
1.9 |
2.2 |
2.3 |
| South
Australia |
2.6 |
2.2 |
2.2 |
2.1 |
2.2 |
| Western
Australia |
2.2 |
1.9 |
1.4 |
1.4 |
1.6 |
| Tasmania |
2.4 |
2.3 |
2.2 |
2.3 |
2.6 |
| Northern
Territory |
2.6 |
2.2 |
2.1 |
1.3 |
2.1 |
| Australian
Capital Territory |
1.8 |
1.7 |
1.9 |
1.9 |
2.1 |
| Australia |
2.4 |
2.2 |
2.0 |
2.0 |
2.3 |
| (a)
Index value at June of the financial year. |
|
|
|
|
| (b)
Total hourly rate of pay index excluding bonuses, all sectors. Base: 2008–09
= 100.0. |
| Source:
ABS, Wage Price Index, cat. no. 6345.0, June 2019 |
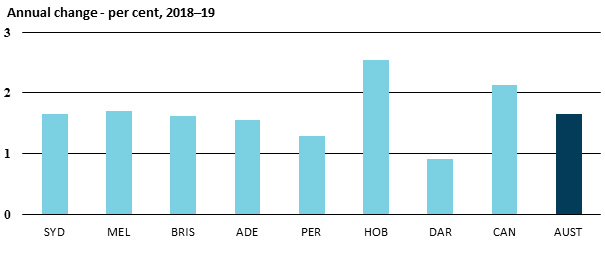
2.6 Consumer price index
| |
2014-15 |
2015-16 |
2016-17 |
2017-18 |
2018-19 |
| Consumer price index (a) |
|
|
|
|
|
| Sydney |
107.3 |
108.9 |
111.1 |
113.4 |
115.2 |
| Melbourne |
106.5 |
108.2 |
110.2 |
112.7 |
114.7 |
| Brisbane |
106.8 |
108.5 |
110.4 |
112.3 |
114.1 |
| Adelaide |
106.3 |
107.2 |
108.9 |
111.3 |
113.1 |
| Perth |
107.2 |
108.2 |
108.9 |
109.9 |
111.3 |
| Hobart |
104.9 |
106.3 |
108.2 |
110.5 |
113.3 |
| Darwin |
108.4 |
108.5 |
108.7 |
109.7 |
110.7 |
| Canberra |
105.3 |
106.1 |
108.1 |
110.7 |
113.0 |
Weighted
average eight
capital cities |
106.8 |
108.3 |
110.2 |
112.3 |
114.1 |
| Annual change – per cent (b) |
|
|
|
|
| Sydney |
1.9 |
1.5 |
2.0 |
2.0 |
1.7 |
| Melbourne |
1.4 |
1.6 |
1.9 |
2.3 |
1.7 |
| Brisbane |
1.9 |
1.6 |
1.7 |
1.7 |
1.6 |
| Adelaide |
1.6 |
0.9 |
1.5 |
2.3 |
1.5 |
| Perth |
1.8 |
1.0 |
0.6 |
0.9 |
1.3 |
| Hobart |
1.1 |
1.4 |
1.8 |
2.1 |
2.5 |
| Darwin |
1.4 |
0.1 |
0.1 |
1.0 |
0.9 |
| Canberra |
1.1 |
0.7 |
1.9 |
2.4 |
2.1 |
Weighted
average eight
capital cities |
1.7 |
1.4 |
1.7 |
1.9 |
1.6 |
| (a)
Annual average of quarterly data; base year for CPI is 2011-12. |
| (b)
Change in the annual averages of table above. |
| Source:
ABS, Consumer Price Index, cat. no. 6401.0, June 2019 |
Chapter 3:
State Accounts
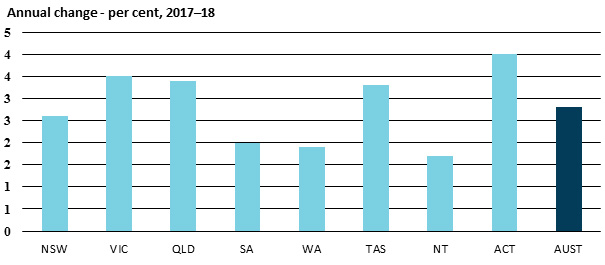
3.1 Gross state product
| |
2013-14 |
2014-15 |
2015-16 |
2016-17 |
2017-18 |
| Gross state product, chain volume measures – $ million |
| New
South Wales |
525 199 |
539 689 |
561 098 |
578 518 |
593 275 |
| Victoria |
369 281 |
380 716 |
393 854 |
409 566 |
423 961 |
| Queensland |
310 904 |
314 121 |
322 002 |
328 449 |
339 504 |
| South
Australia |
100 291 |
101 314 |
101 528 |
103 935 |
106 004 |
| Western
Australia |
246 424 |
252 666 |
255 535 |
251 057 |
255 883 |
| Tasmania |
28 091 |
28 382 |
28 862 |
29 298 |
30 266 |
| Northern
Territory |
23 939 |
24 581 |
25 083 |
25 767 |
26 200 |
| Australian
Capital Territory |
34 432 |
35 204 |
36 598 |
37 923 |
39 442 |
| Australia |
1 638 132 |
1 676 400 |
1 724 123 |
1 764 512 |
1 814 535 |
| Annual change – per cent |
|
|
|
|
|
| New
South Wales |
1.9 |
2.8 |
4.0 |
3.1 |
2.6 |
| Victoria |
2.4 |
3.1 |
3.5 |
4.0 |
3.5 |
| Queensland |
2.2 |
1.0 |
2.5 |
2.0 |
3.4 |
| South
Australia |
0.8 |
1.0 |
0.2 |
2.4 |
2.0 |
| Western
Australia |
5.8 |
2.5 |
1.1 |
-1.8 |
1.9 |
| Tasmania |
1.1 |
1.0 |
1.7 |
1.5 |
3.3 |
| Northern
Territory |
1.3 |
2.7 |
2.0 |
2.7 |
1.7 |
| Australian
Capital Territory |
0.9 |
2.2 |
4.0 |
3.6 |
4.0 |
| Australia |
2.6 |
2.3 |
2.8 |
2.3 |
2.8 |
| Note:
Gross state product is only published on a financial year basis. 2018-19
figures will be released in November 2019. |
| Source:
ABS, Australian National Accounts: State Accounts, cat. no. 5220.0,
2017-18 |
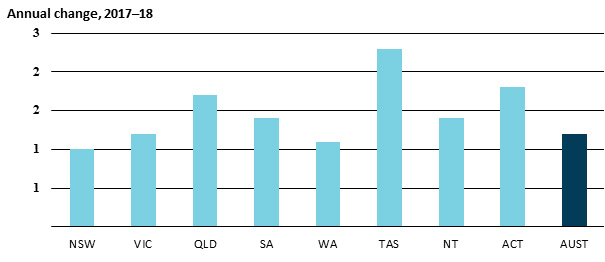
3.2 Gross state product per capita
| |
2013-14 |
2014-15 |
2015-16 |
2016-17 |
2017-18 |
| Gross state product per capita, chain volume measures (a) – $ |
|
|
| New
South Wales |
70 450 |
71 367 |
73 142 |
74 186 |
74 955 |
| Victoria |
63 314 |
63 905 |
64 640 |
65 610 |
66 391 |
| Queensland |
66 355 |
66 169 |
67 015 |
67 256 |
68 379 |
| South
Australia |
59 767 |
59 839 |
59 515 |
60 519 |
61 343 |
| Western
Australia |
98 483 |
99 923 |
100 299 |
97 940 |
98 997 |
| Tasmania |
54 758 |
55 213 |
55 968 |
56 364 |
57 686 |
| Northern
Territory |
98 796 |
101 258 |
102 760 |
104 677 |
106 191 |
| Australian
Capital Territory |
89 129 |
89 810 |
91 753 |
93 140 |
94 831 |
| Australia |
70 322 |
70 921 |
71 893 |
72 381 |
73 267 |
| Annual change – per cent |
|
|
|
|
|
| New
South Wales |
0.5 |
1.3 |
2.5 |
1.4 |
1.0 |
| Victoria |
0.2 |
0.9 |
1.1 |
1.5 |
1.2 |
| Queensland |
0.6 |
-0.3 |
1.3 |
0.4 |
1.7 |
| South
Australia |
-0.1 |
0.1 |
-0.5 |
1.7 |
1.4 |
| Western
Australia |
4.0 |
1.5 |
0.4 |
-2.4 |
1.1 |
| Tasmania |
0.8 |
0.8 |
1.4 |
0.7 |
2.3 |
| Northern
Territory |
-0.2 |
2.5 |
1.5 |
1.9 |
1.4 |
| Australian
Capital Territory |
-0.8 |
0.8 |
2.2 |
1.5 |
1.8 |
| Australia |
0.9 |
0.9 |
1.4 |
0.7 |
1.2 |
| Note:
Gross state product is only published on a financial year basis. 2018-19
figures will be released in November 2019. |
| Source:
ABS, Australian National Accounts: State Accounts, cat. no. 5220.0,
2017-18 |
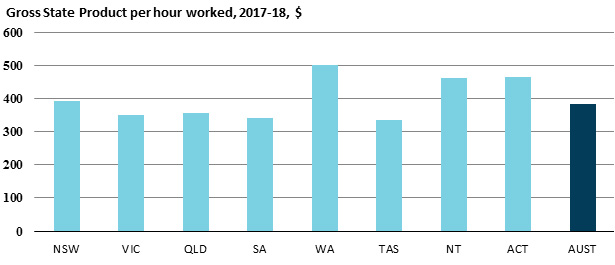
3.3 Labour productivity
| |
2013-14 |
2014-15 |
2015-16 |
2016-17 |
2017-18 |
| Gross State Product per hour worked, $ |
|
|
|
| New
South Wales |
370.6 |
382.5 |
374.9 |
392.8 |
391.0 |
| Victoria |
332.0 |
342.7 |
336.7 |
341.9 |
348.9 |
| Queensland |
331.3 |
340.9 |
342.2 |
355.5 |
354.7 |
| South
Australia |
326.3 |
332.4 |
332.4 |
340.7 |
341.8 |
| Western
Australia |
468.2 |
480.1 |
491.8 |
498.7 |
499.6 |
| Tasmania |
326.3 |
324.7 |
322.8 |
331.1 |
336.0 |
| Northern
Territory |
422.9 |
438.2 |
433.1 |
447.4 |
462.7 |
| Australian
Capital Territory |
432.0 |
444.3 |
445.8 |
464.0 |
463.9 |
| Australia |
362.1 |
372.8 |
369.8 |
381.0 |
382.5 |
| Annual change – per cent |
|
|
|
|
|
| New
South Wales |
-0.5 |
3.2 |
-2.0 |
4.8 |
-0.5 |
| Victoria |
-1.6 |
3.2 |
-1.7 |
1.5 |
2.1 |
| Queensland |
-2.3 |
2.9 |
0.4 |
3.9 |
-0.2 |
| South
Australia |
-1.0 |
1.9 |
0.0 |
2.5 |
0.3 |
| Western
Australia |
4.3 |
2.6 |
2.4 |
1.4 |
0.2 |
| Tasmania |
-1.3 |
-0.5 |
-0.6 |
2.6 |
1.5 |
| Northern
Territory |
-3.8 |
3.6 |
-1.2 |
3.3 |
3.4 |
| Australian
Capital Territory |
0.3 |
2.8 |
0.3 |
4.1 |
0.0 |
| Australia |
-0.5 |
2.9 |
-0.8 |
3.0 |
0.4 |
| (a)
Gross state product (chain volume measures) per hour worked, all sectors
(i.e. market and non-market sectors). |
| Note:
Gross state product is only published on a financial year basis. |
| Source:
ABS, Australian National Accounts: State Accounts, cat. no. 5220.0,
2017-18; ABS, Labour Force, Detailed, cat. no. 6291.0.55.001, March
2019 |
Chapter 4: Business Conditions
4.1 Value of Retail Sales
| |
2014-15 |
2015-16 |
2016-17 |
2017-18 |
2018-19 |
| Value (a) – $ million |
|
|
|
|
|
| New
South Wales |
91 261 |
96 088 |
99 281 |
102 074 |
104 233 |
| Victoria |
71 228 |
75 235 |
77 704 |
81 125 |
85 009 |
| Queensland |
58 573 |
60 162 |
61 883 |
62 498 |
64 841 |
| South
Australia |
18 654 |
19 400 |
20 160 |
20 794 |
21 270 |
| Western
Australia |
33 258 |
33 968 |
34 035 |
33 976 |
34 113 |
| Tasmania |
5 637 |
5 910 |
6 128 |
6 301 |
6 542 |
| Northern
Territory |
3 071 |
3 120 |
3 125 |
3 155 |
3 098 |
| Australian
Capital Territory |
5 130 |
5 410 |
5 676 |
5 803 |
6 027 |
| Australia |
286 812 |
299 293 |
307 993 |
315 725 |
325 133 |
| Annual change – per cent |
|
|
|
|
|
| New
South Wales |
7.4 |
5.3 |
3.3 |
2.8 |
2.1 |
| Victoria |
5.5 |
5.6 |
3.3 |
4.4 |
4.8 |
| Queensland |
2.7 |
2.7 |
2.9 |
1.0 |
3.7 |
| South
Australia |
4.6 |
4.0 |
3.9 |
3.1 |
2.3 |
| Western
Australia |
2.7 |
2.1 |
0.2 |
-0.2 |
0.4 |
| Tasmania |
4.2 |
4.8 |
3.7 |
2.8 |
3.8 |
| Northern
Territory |
0.8 |
1.6 |
0.2 |
1.0 |
-1.8 |
| Australian
Capital Territory |
3.8 |
5.5 |
4.9 |
2.2 |
3.9 |
| Australia |
5.0 |
4.4 |
2.9 |
2.5 |
3.0 |
| Source:
ABS, Retail Trade Australia, cat. no. 8501.0, July 2019 |
4.2 Dwelling approvals
| |
2014-15 |
2015-16 |
2016-17 |
2017-18 |
2018-19 |
| Number (a) |
|
|
|
|
|
| New
South Wales |
63 419 |
73 489 |
73 091 |
72 669 |
57 696 |
| Victoria |
67 672 |
68 082 |
65 435 |
75 811 |
59 986 |
| Queensland |
46 704 |
51 144 |
43 234 |
43 191 |
33 235 |
| South
Australia |
11 400 |
12 591 |
11 544 |
12 810 |
10 706 |
| Western
Australia |
32 707 |
24 650 |
20 367 |
18 423 |
15 725 |
| Tasmania |
2 872 |
2 448 |
2 248 |
2 851 |
3 146 |
| Northern
Territory |
1 814 |
1 703 |
912 |
773 |
673 |
| Australian
Capital Territory |
4 261 |
4 677 |
5 524 |
5 664 |
6 302 |
| Australia |
230 849 |
238 784 |
222 355 |
232 192 |
187 469 |
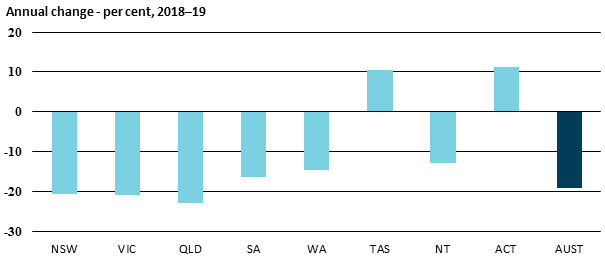
| Annual change – per cent |
|
|
|
|
|
| New
South Wales |
17.2 |
15.9 |
-0.5 |
-0.6 |
-20.6 |
| Victoria |
23.4 |
0.6 |
-3.9 |
15.9 |
-20.9 |
| Queensland |
18.9 |
9.5 |
-15.5 |
-0.1 |
-23.1 |
| South
Australia |
-2.2 |
10.4 |
-8.3 |
11.0 |
-16.4 |
| Western
Australia |
5.9 |
-24.6 |
-17.4 |
-9.5 |
-14.6 |
| Tasmania |
31.5 |
-14.8 |
-8.2 |
26.8 |
10.3 |
| Northern
Territory |
-15.2 |
-6.1 |
-46.4 |
-15.2 |
-12.9 |
| Australian
Capital Territory |
-8.1 |
9.8 |
18.1 |
2.5 |
11.3 |
| Australia |
15.6 |
3.4 |
-6.9 |
4.4 |
-19.3 |
| (a)
Houses and other dwellings (e.g. flats) intended for long-term residential
use; includes both private and public sector dwellings. |
| Source:
ABS, Building Approvals, cat. no. 8731.0, July 2019 |
4.3 Business investment
| |
2013-14 |
2014-15 |
2015-16 |
2016-17 |
2017-18 |
| Chain volume measures (a) – $ million |
|
|
|
|
| New
South Wales |
52 756 |
54 157 |
55 502 |
55 634 |
61 715 |
| Victoria |
38 759 |
41 549 |
41 946 |
43 100 |
47 287 |
| Queensland |
70 327 |
53 866 |
40 452 |
40 753 |
45 055 |
| South
Australia |
12 225 |
12 550 |
11 214 |
9 091 |
12 406 |
| Western
Australia |
72 624 |
65 607 |
52 931 |
37 805 |
37 838 |
| Tasmania |
2 363 |
2 505 |
2 349 |
2 437 |
2 861 |
| Northern
Territory |
10 385 |
9 209 |
7 001 |
9 139 |
7 688 |
| Australian
Capital Territory |
2 220 |
2 276 |
2 344 |
2 571 |
2 715 |
| Australia |
261 129 |
241 559 |
213 738 |
200 530 |
217 566 |
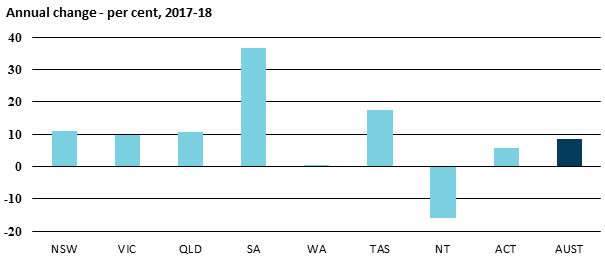
| Annual change – per cent |
|
|
|
|
|
| New
South Wales |
-9.2 |
2.7 |
2.5 |
0.2 |
10.9 |
| Victoria |
10.1 |
7.2 |
1.0 |
2.8 |
9.7 |
| Queensland |
-3.0 |
-23.4 |
-24.9 |
0.7 |
10.6 |
| South
Australia |
-0.8 |
2.7 |
-10.6 |
-18.9 |
36.5 |
| Western
Australia |
-9.5 |
-9.7 |
-19.3 |
-28.6 |
0.1 |
| Tasmania |
-3.6 |
6.0 |
-6.2 |
3.7 |
17.4 |
| Northern
Territory |
-2.1 |
-11.3 |
-24.0 |
30.5 |
-15.9 |
| Australian
Capital Territory |
-14.8 |
2.5 |
3.0 |
9.7 |
5.6 |
| Australia |
-4.5 |
-7.5 |
-11.5 |
-6.2 |
8.5 |
| (a)
Private business gross fixed capital formation for other buildings and
structures, machinery and equipment, livestock and intangible fixed assets. |
| Note:
National account data is only available for financial years. 2018-19 data
will be available in November 2019. |
| Source:
Australian National Accounts: State Accounts, cat. no. 5220.0, 2017-18 |
Chapter 5: Housing
5.1 Lending for owner occupied housing
| |
2014-15 |
2015-16 |
2016-17 |
2017-18 |
2018-19 |
| Value (a) – $ million |
|
|
|
|
|
| New
South Wales |
45 183 |
56 763 |
57 154 |
62 180 |
52 785 |
| Victoria |
37 229 |
45 693 |
46 218 |
53 134 |
46 342 |
| Queensland |
27 654 |
29 114 |
30 679 |
31 027 |
27 727 |
| South
Australia |
7 924 |
8 517 |
8 769 |
8 800 |
8 805 |
| Western
Australia |
20 039 |
17 612 |
16 358 |
15 542 |
13 574 |
| Tasmania |
1 857 |
1 883 |
2 183 |
2 332 |
2 510 |
| Northern
Territory |
1 150 |
913 |
856 |
831 |
742 |
| Australian
Capital Territory |
2 951 |
3 230 |
3 404 |
3 857 |
3 634 |
| Australia |
143 988 |
163 725 |
165 619 |
177 705 |
156 118 |
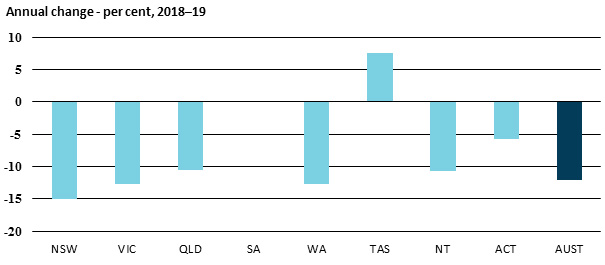
| Annual change – per cent |
|
|
|
|
|
| New
South Wales |
6.4 |
25.6 |
0.7 |
8.8 |
-15.1 |
| Victoria |
7.4 |
22.7 |
1.1 |
15.0 |
-12.8 |
| Queensland |
4.9 |
5.3 |
5.4 |
1.1 |
-10.6 |
| South
Australia |
1.3 |
7.5 |
2.9 |
0.4 |
0.1 |
| Western
Australia |
-6.0 |
-12.1 |
-7.1 |
-5.0 |
-12.7 |
| Tasmania |
-0.9 |
1.4 |
15.9 |
6.9 |
7.6 |
| Northern
Territory |
0.9 |
-20.6 |
-6.3 |
-2.8 |
-10.7 |
| Australian
Capital Territory |
7.9 |
9.4 |
5.4 |
13.3 |
-5.8 |
| Australia |
4.1 |
13.7 |
1.2 |
7.3 |
-12.1 |
| (a)
Lending commitments by all types of lenders for the construction and purchase
of new or established owner occupied dwellings. |
| Source:
ABS, Lending to Households and Businesses, cat. no. 5601.0, July 2019 |
Chapter 6: Public Sector Finances
6.1 General government
sector fiscal balance
| |
2013-14 |
2014-15 |
2015-16 |
2016-17 |
2017-18 |
| General government sector fiscal balance (a) – $ million |
|
|
|
| New
South Wales |
-1 346 |
612 |
71 |
- 503 |
-2 517 |
| Victoria |
1 104 |
- 423 |
55 |
-2 026 |
-6 164 |
| Queensland |
-2 585 |
- 659 |
- 478 |
1 332 |
- 90 |
| South
Australia |
-1 699 |
- 122 |
94 |
-2 334 |
- 907 |
| Western
Australia |
-1 129 |
-1 914 |
-3 442 |
-3 941 |
-1 882 |
| Tasmania |
- 159 |
- 62 |
- 68 |
524 |
- 245 |
| Northern
Territory |
- 101 |
- 121 |
- 22 |
- 469 |
- 703 |
| Australian
Capital Territory |
- 575 |
- 912 |
- 627 |
- 209 |
- 231 |
| Total
(b) |
-6 493 |
-3 602 |
-4 430 |
-7 634 |
-12 739 |
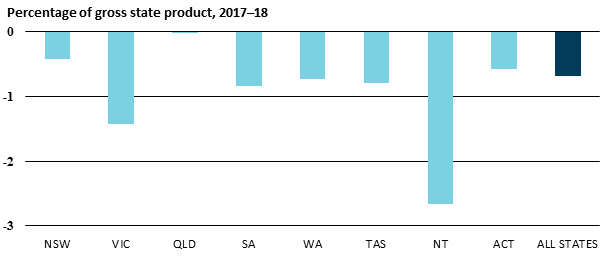
| General government sector fiscal balance – percentage of gross
state product |
|
|
| New
South Wales |
-0.3 |
0.1 |
0.0 |
-0.1 |
-0.4 |
| Victoria |
0.3 |
-0.1 |
0.0 |
-0.5 |
-1.4 |
| Queensland |
-0.9 |
-0.2 |
-0.2 |
0.4 |
0.0 |
| South
Australia |
-1.7 |
-0.1 |
0.1 |
-2.2 |
-0.8 |
| Western
Australia |
-0.4 |
-0.8 |
-1.4 |
-1.6 |
-0.7 |
| Tasmania |
-0.6 |
-0.2 |
-0.2 |
1.8 |
-0.8 |
| Northern
Territory |
-0.4 |
-0.5 |
-0.1 |
-1.8 |
-2.7 |
| Australian
Capital Territory |
-1.7 |
-2.7 |
-1.7 |
-0.6 |
-0.6 |
| Total
(c) |
-0.4 |
-0.2 |
-0.3 |
-0.4 |
-0.7 |
| (a)
The financing requirement of government. A positive sign, or fiscal surplus,
indicates a net lending position; a negative sign, or fiscal deficit, indicates
a net borrowing position. |
| (b)
The sum of all state and territory jurisdictions may not agree with the
total, due to transfers between jurisdictions. |
| (c)
Total or aggregate fiscal balance for all jurisdictions is expressed as a
percentage of gross state product. |
| Sources:
ABS, Government Finance Statistics, cat. no. 5512.0, 2017-18 |
6.2 State and local government taxation revenue
| |
2013-14 |
2014-15 |
2015-16 |
2016-17 |
2017-18 |
| General government sector taxation revenue – $ million |
|
|
|
| New
South Wales |
27 816 |
30 350 |
33 426 |
35 150 |
35 661 |
| Victoria |
21 156 |
22 904 |
24 776 |
26 533 |
28 277 |
| Queensland |
15 135 |
16 043 |
16 168 |
16 708 |
17 195 |
| South
Australia |
5 412 |
5 765 |
5 871 |
5 935 |
6 137 |
| Western
Australia |
10 446 |
10 784 |
11 150 |
10 757 |
10 848 |
| Tasmania |
1 295 |
1 353 |
1 429 |
1 477 |
1 548 |
| Northern
Territory |
671 |
828 |
729 |
737 |
770 |
| Australian
Capital Territory |
1 296 |
1 377 |
1 568 |
1 695 |
1 718 |
| Total
(a) |
83 227 |
89 404 |
95 116 |
98 992 |
102 154 |
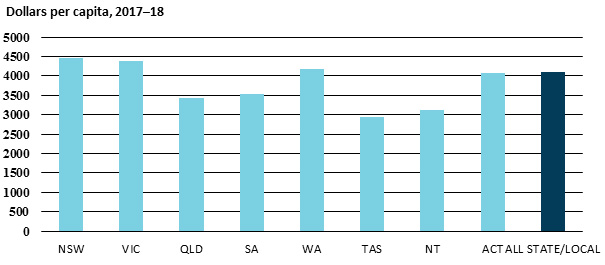
| General government sector taxation revenue per capita - $ |
|
|
|
| New
South Wales |
3 705 |
3 985 |
4 323 |
4 467 |
4 464 |
| Victoria |
3 589 |
3 803 |
4 013 |
4 197 |
4 377 |
| Queensland |
3 207 |
3 358 |
3 337 |
3 391 |
3 431 |
| South
Australia |
3 208 |
3 390 |
3 428 |
3 443 |
3 534 |
| Western
Australia |
4 149 |
4 245 |
4 362 |
4 179 |
4 180 |
| Tasmania |
2 521 |
2 627 |
2 761 |
2 827 |
2 931 |
| Northern
Territory |
2 763 |
3 384 |
2 967 |
2 978 |
3 113 |
| Australian
Capital Territory |
3 333 |
3 479 |
3 890 |
4 114 |
4 081 |
| Total
(b) |
3 545 |
3 754 |
3 932 |
4 024 |
4 087 |
| (a)
Total is the sum of taxation revenue from all state and local government
sources, not taxation revenue for Australia as it excludes Commonwealth
taxation. |
| (b)
Total is the quotient of total taxation revenue (a) and the population of
Australia. This is not equivalent to the taxation revenue per capita for
Australia as Commonwealth taxation is excluded. |
| Source:
ABS, Taxation Revenue, cat. no. 5506.0, 2017-18 |
Chapter 7: Exports
7.1 Merchandise exports
| |
2013-14 |
2014-15 |
2015-16 |
2016-17 |
2017-18 |
| Merchandise exports (a) – $ million |
|
|
|
|
| New
South Wales |
36 599 |
37 032 |
36 193 |
44 078 |
47 597 |
| Victoria |
23 964 |
23 609 |
23 323 |
24 729 |
26 824 |
| Queensland |
44 813 |
46 488 |
47 867 |
66 485 |
74 263 |
| South
Australia |
12 354 |
11 322 |
11 567 |
11 432 |
12 042 |
| Western
Australia |
130 426 |
110 775 |
99 635 |
120 398 |
129 698 |
| Tasmania |
2 753 |
2 542 |
2 848 |
2 758 |
3 675 |
| Northern
Territory |
6 804 |
6 177 |
4 701 |
4 898 |
5 721 |
| Australian
Capital Territory |
1 |
6 |
14 |
21 |
23 |
| Australia
(b) |
272 922 |
254 552 |
243 423 |
290 880 |
314 479 |
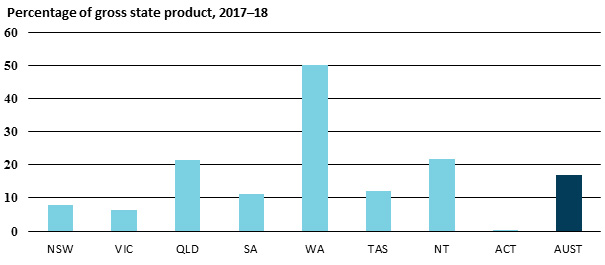
| Merchandise exports – percentage of gross state product |
|
|
|
| New
South Wales |
7.3 |
7.1 |
6.7 |
7.6 |
7.9 |
| Victoria |
6.7 |
6.3 |
6.0 |
6.0 |
6.2 |
| Queensland |
15.5 |
15.7 |
15.8 |
20.2 |
21.3 |
| South
Australia |
12.6 |
11.4 |
11.6 |
11.0 |
11.2 |
| Western
Australia |
48.3 |
44.0 |
41.5 |
48.0 |
50.0 |
| Tasmania |
10.1 |
9.2 |
10.1 |
9.4 |
11.9 |
| Northern
Territory |
27.8 |
25.2 |
19.3 |
19.0 |
21.7 |
| Australian
Capital Territory |
0.0 |
0.0 |
0.0 |
0.1 |
0.1 |
| Australia
(b) |
17.1 |
15.7 |
14.6 |
16.5 |
17.0 |
| (a)
State in which the final stage of manufacture or production occurs. FOB
value. |
| (b)
Includes re-exports and state figures not available for publication.
Australian total, therefore, may not equal sum of states and territories. |
| Note:
This table is based on national accounts data. |
| Sources:
ABS, International Trade in Goods and Services, cat. no. 5368.0; ABS, Australian
National Accounts: State Accounts, cat. no. 5220.0, 2017-18 |
Chapter 8: Social Statistics
8.1 Population
| |
2012-13 |
2013-14 |
2014-15 |
2015-16 |
2016-17 |
| Population (a) – '000 |
|
|
|
|
|
| New
South Wales |
7 508.4 |
7 616.2 |
7 732.9 |
7 867.1 |
7 979.6 |
| Victoria |
5 894.9 |
6 022.3 |
6 173.2 |
6 320.3 |
6 460.5 |
| Queensland |
4 719.7 |
4 777.7 |
4 845.2 |
4 928.4 |
5 010.4 |
| South
Australia |
1 686.9 |
1 700.7 |
1 712.8 |
1 723.7 |
1 736.4 |
| Western
Australia |
2 517.6 |
2 540.7 |
2 556.0 |
2 574.8 |
2 594.2 |
| Tasmania |
513.6 |
515.1 |
517.5 |
522.3 |
528.1 |
| Northern
Territory |
242.9 |
244.7 |
245.7 |
247.7 |
247.2 |
| Australian
Capital Territory |
388.8 |
395.8 |
403.1 |
412.0 |
420.4 |
| Australia |
23 475.7 |
23 816.0 |
24 190.9 |
24 600.8 |
24 981.3 |
| Annual change – per cent |
|
|
|
|
|
| New
South Wales |
1.4 |
1.4 |
1.5 |
1.7 |
1.4 |
| Victoria |
2.1 |
2.2 |
2.5 |
2.4 |
2.2 |
| Queensland |
1.4 |
1.2 |
1.4 |
1.7 |
1.7 |
| South
Australia |
0.9 |
0.8 |
0.7 |
0.6 |
0.7 |
| Western
Australia |
1.2 |
0.9 |
0.6 |
0.7 |
0.8 |
| Tasmania |
0.3 |
0.3 |
0.5 |
0.9 |
1.1 |
| Northern
Territory |
0.5 |
0.7 |
0.4 |
0.8 |
-0.2 |
| Australian
Capital Territory |
1.4 |
1.8 |
1.8 |
2.2 |
2.0 |
| Australia |
1.5 |
1.4 |
1.6 |
1.7 |
1.5 |
| (a)
Estimated resident population numbers are as at June of each year. |
| Source:
ABS, Australian Demographic Statistics, cat. no. 3101.0, March 2018 |
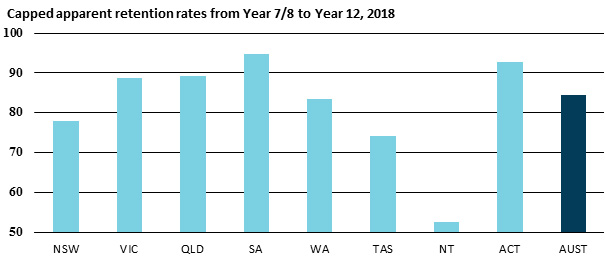
8.2 Capped apparent school retention rates
| |
2014 |
2015 |
2016 |
2017 |
2018 |
| Apparent retention rates from Year 10 to Year 12 (a) |
|
|
|
| New
South Wales |
77.5 |
77.5 |
77.2 |
77.5 |
76.3 |
| Victoria |
84.1 |
84.8 |
85.0 |
85.3 |
84.7 |
| Queensland |
85.9 |
86.7 |
87.3 |
87.8 |
87.8 |
| South
Australia |
89.9 |
92.2 |
94.5 |
91.7 |
90.8 |
| Western
Australia |
85.9 |
81.0 |
80.5 |
83.1 |
85.0 |
| Tasmania |
69.4 |
72.1 |
70.8 |
71.5 |
73.2 |
| Northern
Territory |
68.1 |
63.8 |
64.2 |
70.2 |
65.1 |
| Australian
Capital Territory |
92.4 |
95.1 |
92.2 |
92.1 |
90.0 |
| Australia |
82.5 |
82.7 |
82.9 |
83.3 |
82.8 |
| Apparent retention rates from Year 7/8 to Year 12 (b) |
|
|
|
| New
South Wales |
78.1 |
78.2 |
78.4 |
78.9 |
77.8 |
| Victoria |
85.2 |
86.4 |
87.9 |
88.5 |
88.7 |
| Queensland |
87.1 |
88.4 |
88.6 |
89.1 |
89.2 |
| South
Australia |
93.0 |
95.7 |
97.5 |
94.7 |
94.6 |
| Western
Australia |
89.3 |
82.8 |
80.3 |
82.3 |
83.3 |
| Tasmania |
68.4 |
71.7 |
70.4 |
71.5 |
74.0 |
| Northern
Territory |
59.6 |
53.7 |
56.7 |
58.6 |
52.5 |
| Australian
Capital Territory |
94.6 |
96.6 |
94.0 |
94.8 |
92.8 |
| Australia |
83.6 |
84.0 |
84.3 |
84.8 |
84.5 |
| (a)
The number of full-time school students in Year 12 expressed as a percentage
of the corresponding group at the commencement of their Year 10 schooling. |
| (b)
The number of full-time school students in Year 12 expressed as a percentage
of the corresponding group at the commencement of their secondary schooling. |
| Source:
ABS, Schools, cat. no. 4221.0, 2018 |
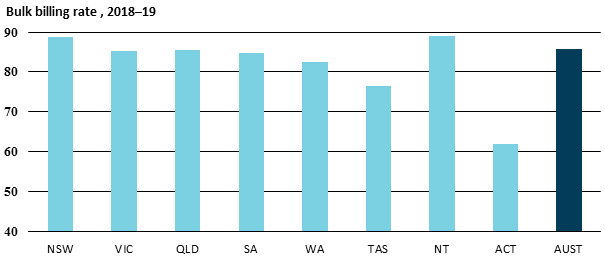
8.3 General practice bulk billing
| |
2014-15 |
2015-16 |
2016-17 |
2017-18 |
2018-19 |
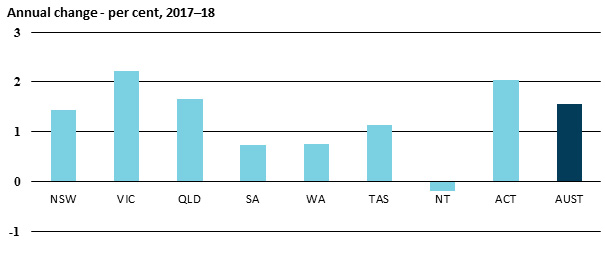
| General practice bulk billing rate (a) – per cent |
|
|
|
| New
South Wales |
87.6 |
88.2 |
88.6 |
88.7 |
88.9 |
| Victoria |
83.1 |
84.0 |
84.8 |
85.2 |
85.5 |
| Queensland |
82.8 |
83.7 |
84.5 |
85.4 |
86.0 |
| South
Australia |
82.3 |
83.3 |
84.0 |
84.8 |
85.2 |
| Western
Australia |
75.3 |
77.8 |
80.1 |
82.4 |
85.3 |
| Tasmania |
77.0 |
77.3 |
76.7 |
76.5 |
76.4 |
| Northern
Territory |
80.7 |
84.5 |
87.4 |
88.9 |
89.6 |
| Australian
Capital Territory |
57.0 |
57.9 |
60.0 |
61.8 |
64.1 |
| Australia |
83.4 |
84.3 |
85.1 |
85.7 |
86.2 |
| (a)
Proportion of general practitioner attendances (excluding practice nurse),
enhanced primary care and other non-referred attendances that are bulk
billed. |
| Note:
This data is only published on a financial year basis. |
| Source:
Department of Health and Ageing, Annual Medicare Statistics, 2018-19 |
Glossary
Apparent school retention rate. The
number of full-time school students in a designated level/year of education
expressed as a percentage of their respective cohort group (which is either at
the commencement of their secondary schooling or Year 10). For a discussion of
‘apparent’ retention rates compared to actual retention rates, see the ABS
source publication, Schools, Australia, 2014 (cat. no. 4221.0)
explanatory notes.
Average weekly earnings. Average gross (before tax)
earnings of employees.
Average weekly ordinary time earnings. Weekly earnings
attributed to award, standard or agreed hours of work.
Bankruptcies. Bankruptcies and Administration Orders
under Parts IV and XI of the Bankruptcy Act 1966.
Business investment. Private gross fixed capital
formation for machinery and equipment; non-dwelling construction; livestock;
and intangible fixed assets.
Consumer price index. A measure of change in the price
of a basket of goods and services from a base period. Changes in the consumer
price index are the most commonly used measures of inflation.
Dependency ratio. Ratio of the economically inactive to
economically active population. Shows the number of children aged 0–14 years
and persons aged 65 years and over, per 100 persons aged 15–64 years.
Employed persons. Persons aged 15 and over who, during
a period of one week, worked for one hour or more for pay or worked for one
hour or more without pay in a family business or on a family farm.
General government sector. Government departments and
other entities that provide largely non-market public services and are funded
mainly through taxes and other compulsory levies.
General government sector net debt. Selected
liabilities (deposits held plus proceeds from advances plus borrowing) minus
selected assets (cash and deposits plus investments plus advances outstanding)
of the general government sector.
General government sector fiscal balance. The financing
requirement of the general government sector. A positive sign, or fiscal
surplus, indicates a net lending position; a negative sign, or fiscal deficit,
indicates a net borrowing position.
General practice bulk billing rate. The percentage of
general practitioner attendances (excluding practice nurse) that are bulk
billed.
Gross domestic product. The total market value of goods
and services produced within Australia, after deducting the cost of goods and
services used up in the process of production but before deducting for
depreciation.
Gross state product. Equivalent to gross domestic
product except it refers to production within a state or territory rather than
to the nation as a whole.
Gross state product—chain volume measures. Also known
as real gross state product, this is a measure used to indicate change in the
actual quantity of goods and services produced within a state or territory.
Gross state product per capita. The ratio of the chain
volume measure of gross state product to an estimate of the resident population
in the state or territory.
Job vacancy. A job available for immediate filling and
for which recruitment action has been taken.
Job vacancy rate. The number of job vacancies expressed
as a percentage of the number of employee jobs plus the number of job
vacancies.
Labour force. The employed plus the unemployed.
Labour force participation rate. The number of persons
in the labour force expressed as a percentage of the civilian population aged
15 years and over.
Labour productivity. Gross state product (chain volume
measures) per hour worked, all sectors (that is, market and non-market
sectors).
Long-term unemployed. Persons unemployed for a period
of 52 weeks or more.
Male total average weekly earnings. Weekly ordinary
time earnings plus weekly overtime earnings of all male employees. This measure
of earnings is used in the process of benchmarking pensions.
Real average weekly earnings. Average weekly earnings
adjusted for inflation as measured by the Consumer Price Index.
Total fertility rate. The average number of children
females will bear during their lifetime.
Turnover. Includes retail sales; wholesale sales;
takings from repairs, meals and hiring of goods; commissions from agency
activity; and net takings from gaming machines. Turnover includes the Goods and
Services Tax.
Unemployed persons. Persons aged 15 and over who,
during a period of one week, were not employed but had actively looked for work
in the previous four weeks and were available to start work.
Unemployment rate. The number of unemployed persons
expressed as a percentage of the labour force.
Wage price index. A measure of change in the price of
labour (that is, wages, salaries and overtime) unaffected by changes in the
quality or quantity of work performed.
Youth unemployment. Number of 15–24 year olds looking
for full-time work.
Youth unemployment rate. Number of 15–24 year olds
looking for full-time work expressed as a percentage of the full-time labour
force in the same age group.
For copyright reasons some linked items are only available to members of Parliament.
© Commonwealth of Australia
Creative Commons
In essence, you are free to copy and communicate this work in its current form for all non-commercial purposes, as long as you attribute the work to the author and abide by the other licence terms. The work cannot be adapted or modified in any way. Content from this publication should be attributed in the following way: Author(s), Title of publication, Series Name and No, Publisher, Date.
To the extent that copyright subsists in third party quotes it remains with the original owner and permission may be required to reuse the material.
Inquiries regarding the licence and any use of the publication are welcome to webmanager@aph.gov.au.
This work has been prepared to support the work of the Australian Parliament using information available at the time of production. The views expressed do not reflect an official position of the Parliamentary Library, nor do they constitute professional legal opinion.
Any concerns or complaints should be directed to the Parliamentary Librarian. Parliamentary Library staff are available to discuss the contents of publications with Senators and Members and their staff. To access this service, clients may contact the author or the Library‘s Central Enquiry Point for referral.