29
June 2020
PDF version [1496KB]
Dr Damon
Muller
Politics and Public
Administration
Executive
summary
- This paper provides an overview of the 2019 federal election,
including the results, the political environment, and the major features of the
campaign.
- The 2019 federal election was held on Saturday 18 May 2019.
- The Liberal-National Coalition, led by Prime Minister Scott
Morrison, won a majority in the House of Representatives with 77 of the 151
seats and 51.5 per cent of the national two-party preferred vote, a net
increase of one seat on the 2016 election result.
- The Australian Labor Party won 68 seats, with the Australian Greens
retaining their single seat. Three independents were elected to the House of
Representatives (including Helen Haines, who replaced retiring independent
Cathy McGowan in the division of Indi), along with one Centre Alliance MP and
one Katter’s Australian Party MP.
- The Coalition won 19 seats in the Senate, with the ALP winning 13,
the Greens winning six, and the Jacqui Lambie Network and Pauline Hanson’s One
Nation winning one seat each. When combined with the ongoing senators, the
Coalition has 35 votes in the Senate, Labor 26, the Greens nine and there are
six other cross-benchers.
- Mr Morrison was elected as Liberal Party leader and Prime
Minister on 24 August 2018 following the ousting of Malcolm Turnbull. The
Nationals also contested the election with new leader and Deputy Prime Minister
Michael McCormack, who replaced former leader Barnaby Joyce in February 2018.
- The election followed the ‘citizenship crisis’ of the 45th
Parliament in which 15 senators and members of the House of Representatives
were disqualified or resigned from Parliament. Election candidates were
required to complete a qualification checklist with their nomination, and only
one citizenship case was referred to the High Court following the election,
which was dismissed by the Court.
- The Coalition won the election having trailed Labor in the polls
for essentially the entire term of the 45th Parliament, representing an
unprecedented failure of polling for Australian federal elections. The polling
failure has resulted in at least one inquiry and may lead to changes in the
performance and transparency of Australian polling.
- Clive Palmer, who contested the 2013 federal election with the
Palmer United Party, returned to electoral politics with the renamed United
Australia Party. While the party failed to win any seats, the estimated $60
million advertising spend by the party eclipsed the spending of all other major
parties, and has led to some calling for expenditure caps in federal elections.
Contents
Executive summary
Introduction
Results
Timing of the election
Redistributions
The election campaign
The opinion polling failure
Cost of the election and campaign
Early voting
Electoral participation
Conclusion
Appendix A: Parties contesting the
2019 federal election
Appendix B: Section 44 disqualifications
Appendix C: Final opinion poll results
prior to the 2019 federal election
Appendix D: Public election funding
paid
Introduction
This paper provides an overview of the 2019 federal election.
This includes the political and electoral context in which the election
occurred, the results in the House of Representatives and the Senate, the
timing of the election and the election campaign. The paper also discusses key
democratic indicators such as early voting, campaign spending, and electoral
participation.
Held on Saturday 18 May 2019, the 2019 federal election
returned Prime Minister Scott Morrison (Cook, NSW) and the Liberal-National
Coalition to government with a majority of 77 of the 151 seats in the House of
Representatives. The result meant that Mr Morrison was the third Liberal Prime
Minister since the 2013 federal election when Tony Abbott won government from a
minority Labor Government. The Coalition was widely expected to lose the 2019 election,
having trailed the Labor Opposition, led by Bill Shorten (Maribyrnong, Vic.), in
the polls for almost the entire parliamentary term.
The
electoral context
While every election is unique in some respects, the 2019
federal election came after a particularly turbulent term that followed the
2016 double dissolution election. After emerging from the 2016 federal election
with a slim majority of 76 seats, the Coalition lost a number of its MPs and senators
due to ineligibility (as did Labor), a prime minister due to internal
instability, and its majority in the House before the 2019 federal election.
Parliament’s
citizenship crisis
On 14 July 2017 Greens Senator Scott Ludlam (WA) announced
by tweet that he was resigning from the Senate after he was revealed to have
been a New Zealand citizen.[1]
Section 44(i) of the Australian Constitution holds that anyone holding
citizenship of another country is incapable of being chosen or sitting as a
senator or member of the House of Representatives.
Senator Ludlam’s resignation was particularly notable as it
led to widespread citizenship examinations that eventually resulted in a total
of 15 disqualifications due to section 44(i)—seven from the House of
Representatives and eight from the Senate. A full list of the disqualified
members and senators is in Appendix B.
While Senator Ludlam was the first of the section 44(i) citizenship
casualties, he was the third senator to have been found ineligible in the 45th
Parliament under section 44. The High Court finding former Pauline Hanson’s One
Nation (PHON) senator Rodney Culleton (WA) ineligible in February 2017 due to
having been convicted and under sentence for a crime (section 44(ii)),[2]
and in April 2017 the Court finding Family First Senator Bob Day (SA) ineligible
under section 44(v) due to a direct or indirect pecuniary interest with the
public service of the Commonwealth.[3]
While most of the members of the House of Representatives
who were disqualified or resigned prior to being disqualified were returned at subsequent
by-elections, the recounts required by the High Court in the Senate led to
considerable change in the composition of the Senate. This resulted in changes
in the party composition as replacements were either elected from a different
party (Nationals Senator Fiona Nash was replaced by Liberal Jim Molan in NSW)
or left the party for which they ran at the 2016 election.[4]
As such the Senate, which elected all of its 76 senators at the 2016 double
dissolution election, looked quite different immediately before the 2019
federal election.
As a response to the citizenship crisis, the Parliament
passed the Electoral
Legislation Amendment (Modernisation and Other Measures) Act 2018 in
February 2019. One effect of this legislation was to require candidates
nominating for election to the House of Representatives or the Senate to
complete a candidate qualification checklist as part of their nomination
process. The checklist requires candidates to list information about their
citizenship and family history, and for the 2019 election completed checklists
were made available on the Australian Electoral Commission (AEC) website. No
successful citizenship challenges following the election suggest that the
initiative was successful in obliging candidates to consider their citizenship
prior to nominating.
Leadership
change and the minority government
Scott Morrison led the Liberal Party (LP) to the election,
having taken over as Liberal leader and Prime Minister in August 2018 following
the ousting of Malcolm Turnbull (Wentworth, NSW) less than nine months before
the election. Prior to the leadership change, Kevin Hogan MP (NP, Page, NSW) had
indicated that if there was a leadership spill he would move to the crossbench
in protest—a move he duly made.[5]
Mr Turnbull subsequently resigned from the Parliament,
triggering a by-election in his seat of Wentworth on 20 October 2018. The
seat was narrowly won by independent Dr Kerryn Phelps. Following the loss of
Wentworth, the Coalition was reduced to 74 seats of the 150 seat House of
Representatives, two seats short of an absolute majority of 76 votes. While an
absolute majority is only required in a small number of situations, the Speaker
of the House (one of the Coalition’s 74 members) does not vote except to have a
casting vote in the case of a tie.[6]
Coalition numbers were reduced further when, on 27 November
2018, Liberal Julia Banks (Chisholm, Vic.) announced that she was leaving the LP
due to disillusionment with the party and would sit as an Independent.[7] As a result of
these various developments, despite winning 76 seats at the 2016 federal
election, the Coalition went into 2019 as a minority government (even before some
of the electoral redistributions, which are discussed below).
The election was also the first for Michael McCormack (Riverina,
NSW) as leader of the Nationals (NP); Mr McCormack had taken over as leader in
February 2018 from Barnaby Joyce (New England, NSW). Mr Joyce had resigned as NP
leader and deputy Prime Minister following weeks of controversy over his
personal life.[8]
Results
House of
Representatives
The Liberal-National Coalition was returned to government at
the May 2019 election with 51.53 per cent of the two-party preferred vote. The
Coalition had a net gain of one seat compared to the 2016 federal election,
winning a total of 77 seats in the 151 seat House of Representatives (a
majority of one seat following the appointment of a Liberal Speaker). Labor won
68 seats (a net loss of one), with three seats going to independents, one to
the Greens, one to the Centre Alliance (CA) (formerly the Nick Xenophon Team)
and one to Katter’s Australian Party (KAP) (Table 1 below).
Table 1: House of
Representatives seats won by party by state, 2019 federal election
| State |
ALP |
LP |
LNP |
NP |
GRN |
IND |
KAP |
CA |
Total |
| NSW |
24 |
15 |
- |
7 |
- |
1 |
- |
- |
47 |
| VIC |
21 |
12 |
- |
3 |
1 |
1 |
- |
- |
38 |
| QLD |
6 |
- |
23 |
- |
- |
- |
1 |
- |
30 |
| WA |
5 |
11 |
- |
- |
- |
- |
- |
- |
16 |
| SA |
5 |
4 |
- |
- |
- |
- |
- |
1 |
10 |
| TAS |
2 |
2 |
- |
- |
- |
1 |
- |
- |
5 |
| ACT |
3 |
- |
- |
- |
- |
- |
- |
- |
3 |
| NT |
2 |
- |
- |
- |
- |
- |
- |
- |
2 |
| Total |
68 |
44 |
23 |
10 |
1 |
3 |
1 |
1 |
151 |
Source: Compiled by the Parliamentary Library from AEC election
results data.
The 2019 federal election continued the trend of decreasing first
preference votes for both of the major parties, with both parties returning the
lowest primary vote for some years (Figure 1 below). This election saw the ALP
receive the lowest primary vote it had received since 1931 (when it received
27.1 per cent) and the lowest primary vote for the LP since it first contested
federal elections in 1946.[9]
In two-party preferred (TPP) terms the election saw a slight swing of 1.17
percentage points towards the Coalition compared to 2016, leaving the Coalition
with a 1.53 per cent winning margin.
Figure 1: First preference and
two-party preferred vote, federal elections 2004–
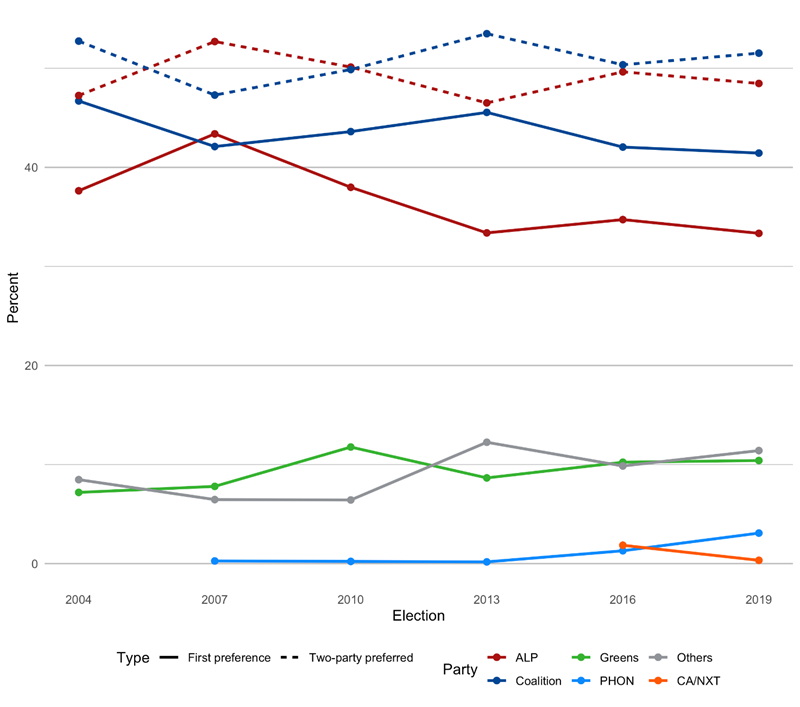
Source: Compiled by the Parliamentary Library from AEC election
results data.
Table 2: House of Representatives national results (top
15 parties), 2019 federal election
| Party |
Votes |
Percent |
Seats |
Swing |
| |
|
|
|
Votes |
Seats |
| Australian Labor Party |
4 752 160 |
33.34 |
68 |
-1.39 |
-1 |
| Liberal |
3 989 404 |
27.99 |
44 |
-0.69 |
-1 |
| The Greens |
1 482 923 |
10.40 |
1 |
0.17 |
0 |
| Liberal National Party of Queensland |
1 236 401 |
8.67 |
23 |
0.15 |
+2 |
| The Nationals |
642 233 |
4.51 |
10 |
-0.11 |
0 |
| United Australia Party |
488 817 |
3.43 |
0 |
3.43 |
0 |
| Independent |
479 836 |
3.37 |
3 |
0.55 |
+1 |
| Pauline Hanson's One Nation |
438 587 |
3.08 |
0 |
1.78 |
0 |
| Animal Justice Party |
116 675 |
0.82 |
0 |
0.12 |
0 |
| Christian Democratic Party (Fred Nile Group) |
97 513 |
0.68 |
0 |
-0.63 |
0 |
| FRASER ANNING'S CONSERVATIVE NATIONAL PARTY |
77 203 |
0.54 |
0 |
0.54 |
0 |
| Katter's Australian Party |
69 736 |
0.49 |
1 |
-0.05 |
0 |
| Centre Alliance |
46 931 |
0.33 |
1 |
-1.52 |
0 |
| Shooters, Fishers and Farmers |
41 479 |
0.29 |
0 |
0.18 |
0 |
| Country Liberals (NT) |
38 837 |
0.27 |
0 |
0.03 |
0 |
| Formal |
14 253 393 |
94.46 |
|
-0.48 |
|
| Informal |
835 223 |
5.54 |
|
0.48 |
|
| Total |
15 088 616 |
91.89 |
|
0.89 |
|
Source: Compiled by the Parliamentary Library from AEC election
results data.
PHON polled better than it has in recent elections, with its
national first preference vote of 3.1 per cent an increase on the 1.29 per cent
it received in 2016. The result was well short of the 8.4 per cent national
primary vote it received in 1998, however, or even its next-best general
election result of 4.3 per cent in 2001. The party ran candidates in 59 seats
(primarily in Queensland (Qld) and Western Australia (WA)) and did not win any
lower house seats. In Qld ON received 8.86 per cent of the first preference
vote, a positive swing of 3.34 percentage points since 2016.
The Greens received a very slight positive national swing
(0.17 per cent), returning incumbent Adam Bandt in the division of Melbourne
(Vic.), and KAP received a very slight negative national swing (-0.05 per cent),
also returning the party’s only incumbent candidate, Bob Katter, in Kennedy
(Qld).
The Centre Alliance, which only ran candidates in three South
Australian seats, experienced a significant negative national swing (-1.52 per
cent) compared to the previous general election. CA incumbent Rebekha Sharkie
was returned in the division of Mayo (SA).
Three independents were elected. Andrew Wilkie was returned
in the division of Clark (Tas.) for his fourth term.[10]
Helen Haines, the designated successor of two-term independent Cathy McGowan,
won the division of Indi (Vic.), the first time an independent has been
replaced by another independent.[11]
Independent Zali Steggall won the division of Warringah (NSW) from eight-term
incumbent Liberal member and former Prime Minister Tony Abbott.[12]
Independent Kerry Phelps, who won the division of Wentworth
(NSW) at a by-election on 20 October 2018 following the resignation from
Parliament of former Prime Minister Malcolm Turnbull, was not successful at the
2019 general election. The seat of Wentworth was returned to the Liberals, and
represented no net change for the division compared to the 2016 general
election.
The United Australia Party (UAP) ran candidates in all 151
electorates and received a primary vote of 3.4 per cent, failing to elect any
of its candidates. While not strictly a like-to-like comparison, the Palmer
United Party received 5.5 per cent of the primary vote in 2013, electing Clive
Palmer to the division of Fairfax (Qld).
Table 3: Two-party preferred
by state (percentage), 2019 federal election
| State |
Coalition |
Australian Labor
Party |
Swing to Coalition |
| New South Wales |
51.78 |
48.22 |
1.25 |
| Victoria |
46.86 |
53.14 |
-1.31 |
| Queensland |
58.44 |
41.56 |
4.34 |
| Western Australia |
55.55 |
44.45 |
0.89 |
| South Australia |
49.29 |
50.71 |
1.56 |
| Tasmania |
44.04 |
55.96 |
1.40 |
| Australian Capital Territory |
38.39 |
61.61 |
-0.48 |
| Northern Territory |
45.80 |
54.20 |
2.86 |
| National |
51.53 |
48.47 |
1.17 |
Source: Compiled by the Parliamentary Library from AEC election
results data.
While the Coalition won the majority of the TPP vote in only
three of the eight Australian states and territories, these were three of the
four largest by number of voters (see Table 3 above and Figure 2 below). The
ALP won a majority of the TPP vote in a majority of the states and territories,
however as these included the smallest states and territories it meant the
Coalition led the ALP in TPP terms Australia-wide by about 436,000 votes. If Qld
were excluded, the ALP would have won a majority of the seats (62 for the ALP
compared to 54 for the Coalition).
Figure 2: Two-party preferred
margin by state, 2019 federal election

Source: Compiled by the Parliamentary Library from AEC election
results data.
Figure 3: Two-party preferred
swing to Coalition by state, 2019 federal election
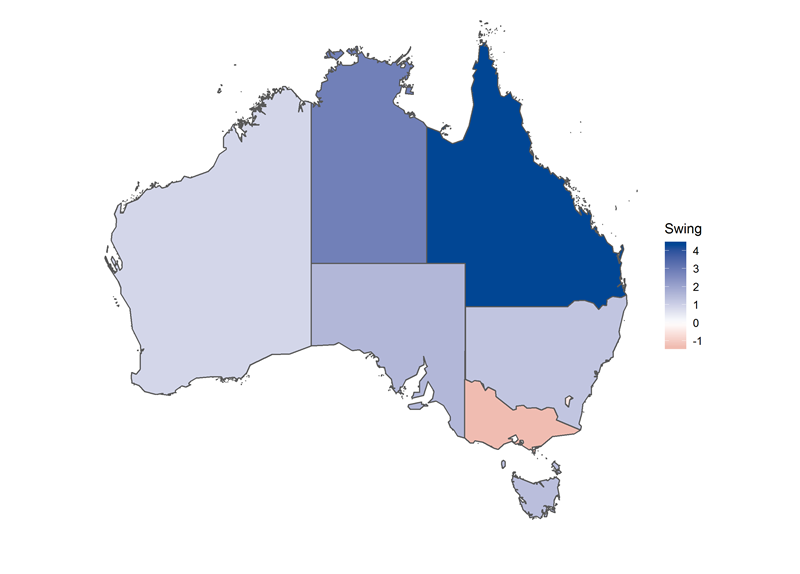
Source: Compiled by the Parliamentary Library from AEC election
results data.
All states and territories except Victoria and the ACT
recorded a TPP swing towards the Coalition at the election (Table 3 and Figure 3 above). At the electorate level, most states and territories had electorates
that swung both to and against the Coalition. However in WA and Qld there was a
much stronger swing towards the Coalition across electorates. In Victoria
electorates tended to swing more to Labor, although to a lesser extent than the
swing to the Coalition in electorates in Qld (Figure 4 below).
When examined by vote type, the Coalition performed more
strongly in early voting, leading the ALP by 9.2 percentage points in TPP
terms. Election-day votes were much more even, however, with Labor having a
slight two-party preferred lead in all types of election-day votes (Table 4 below).
Figure 4: Two-party preferred
swings to the Coalition by electorate for each state,
2019 federal election
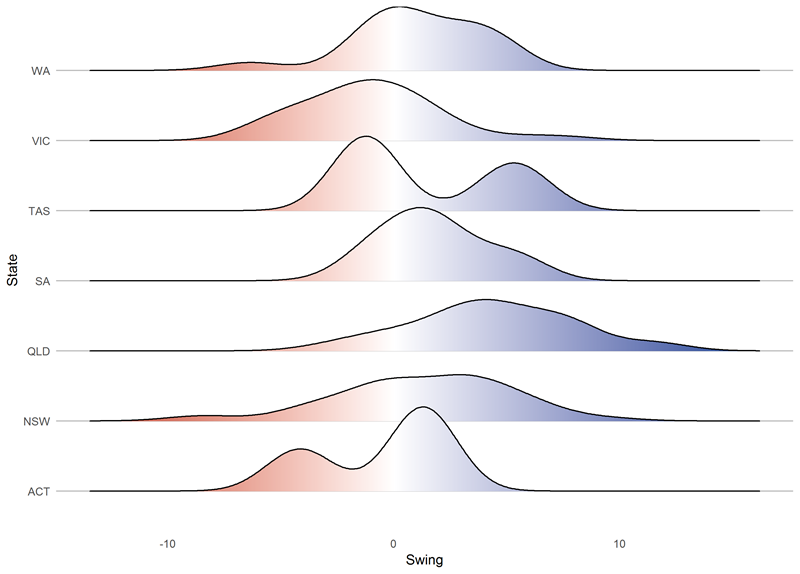
Note: This chart shows what proportion of divisions in each
state swung to each party and by how much. The division of Whitlam was excluded
due to the AEC not reporting a TPP swing, and the NT has too few electorates
for a distribution to be calculated.
Source: Compiled by the Parliamentary Library from AEC election
results data.
Table 4: Two-party preferred
vote share by vote type, 2019 federal election
| Vote type |
Coalition (votes) |
ALP (votes) |
Coalition (%) |
ALP (%) |
| Postal |
699 547 |
514 117 |
57.64 |
42.36 |
| Pre-Poll Declaration |
300 964 |
292 914 |
50.68 |
49.32 |
| Pre-Poll Ordinary |
2 206 882 |
1 859 965 |
54.27 |
45.73 |
| Total Early |
3 207 393 |
2 666 996 |
54.60 |
45.40 |
| Absent |
267 677 |
309 819 |
46.35 |
53.65 |
| Ordinary |
3 849 803 |
3 905 494 |
49.64 |
50.36 |
| Provisional |
19 940 |
26 271 |
43.15 |
56.85 |
| Total Election Day |
4 137 420 |
4 241 584 |
49.38 |
50.62 |
Source: Compiled by the Parliamentary Library from AEC election
results data.
Preferences
Over two-thirds (almost 70 per cent) of the divisions were
decided by second or later preferences, meaning that the winning candidate
received less than 50 per cent of the first preference vote. Seats decided by first
or later preferences are given by winning party in Table 5 below.
Table 5: Seats decided by first
or later preferences by party, 2019 federal election
| Decided By |
LP |
ALP |
LNP (Qld) |
NP |
GRN |
IND |
KAP |
CA |
Total |
| First preference |
22 |
14 |
4 |
5 |
0 |
1 |
0 |
0 |
46 |
| Later preferences |
22 |
54 |
19 |
5 |
1 |
2 |
1 |
1 |
105 |
Source: Compiled by the Parliamentary Library from AEC election
results data.
The number of seats decided by later preferences at this
election follows the trend in recent elections whereby the number of
electorates decided by later preferences has steadily increased (Figure 5 below).
Figure 5: Electorates decided
by first or later preferences, federal elections 2004–
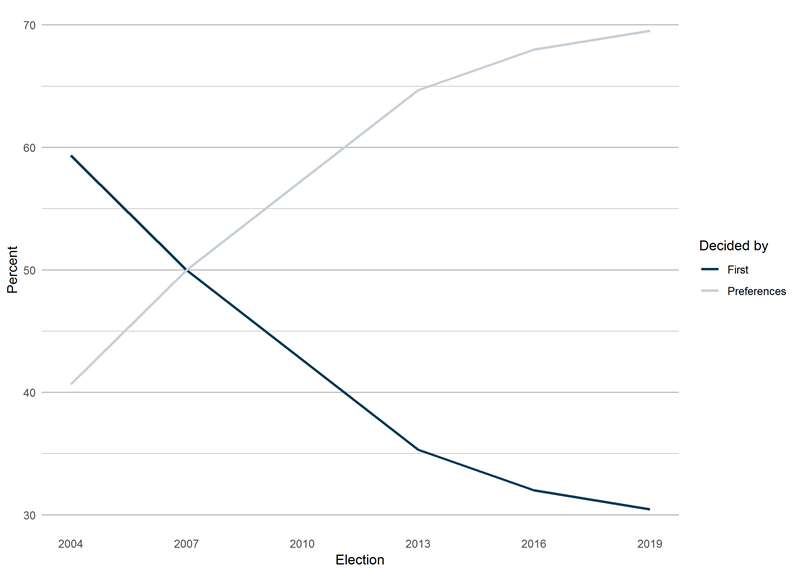
Source: Compiled by the Parliamentary Library from AEC election
results data.
Of the 151 divisions at the election, 15 were what the AEC
refers to as ‘non-classic divisions’, where the final two candidates (the two-candidate
preferred—or TCP—candidates) were not Labor or Coalition candidates. The high (by
historical standards) number of ‘non-classic’ divisions makes examining
preferences more complex—preferences in ‘classic’ divisions always go to either
Labor or the Coalition, whereas in ‘non-classic’ divisions preferences will be
counted towards another party, or an independent candidate.[13]
When considering ‘classic’ divisions only, it is apparent that Labor won 54
seats overall on preferences compared to the Coalition’s 46 seats, and that, across
all vote types, Labor gained more than half of preferences (and in some cases
considerably more than half). However, early voting in ‘classic’ seats,
particularly postal and pre-poll ordinary votes, was more favourable to the
Coalition in terms of preference flows than election-day votes (Figure 6 below).
Figure 6: Share of TCP votes
by vote type in ‘classic’ divisions, 2019 federal election
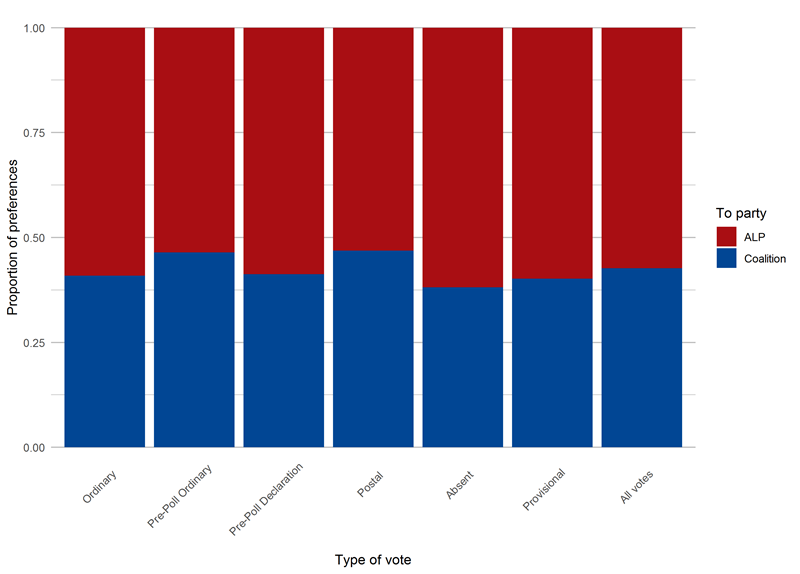
Source: Compiled by the Parliamentary Library from AEC election
results data.
The observation that Labor did better than the Coalition in
terms of preferences in ‘classic’ seats may appear counter-intuitive given that
the Coalition won the election (in terms of both TPP vote and seats); however,
while Labor did receive a greater proportion of the preferences, it also
received considerably fewer first preference (primary) votes. As can be seen in
Figure 7 below, the Coalition received more primary votes in ‘classic’ seats
than the combined Labor primary votes and Greens preferences flowing to Labor.
Labor’s preferences flows, while strong, were insufficient compared to the
Coalition’s much stronger lead on primary votes.
Figure 7: Source of votes and
preferences in ‘classic’ seats by TCP party, 2019 federal election
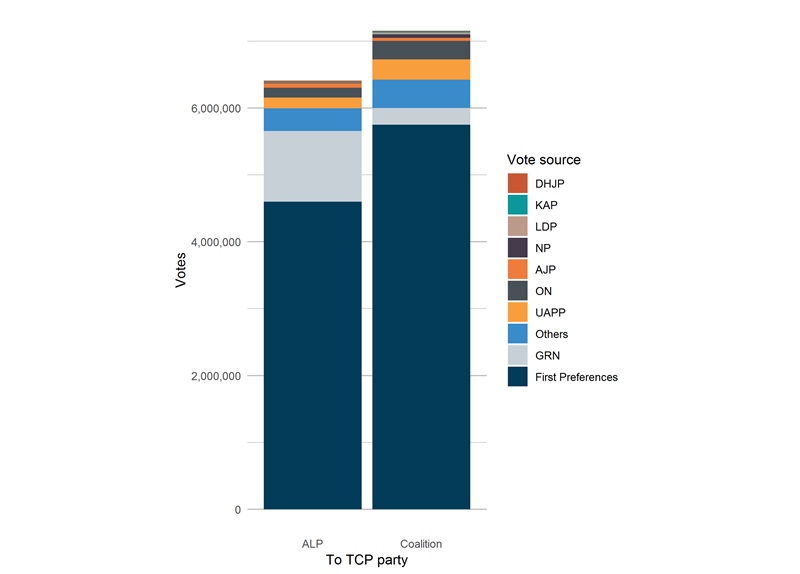
Source: Compiled by the Parliamentary Library from AEC election
results data.
The strong preference flows to Labor appear to have been
mostly driven by the Greens (Figure 7, above). Around 1.35 million Greens votes
flowed as preferences overall to TCP parties, with over one million of those
going to Labor and around 250,000 going to the Coalition. The number of Greens
preferences flowing to Labor therefore tends to overwhelm the preferences of
every other party, most of which tended to favour the Coalition (Figure 8, below). For example, PHON and UAP preferences were about twice as likely to
flow to the Coalition than to Labor.
Figure 8: Preference flows to the ALP and Coalition in
‘classic’ divisions, 2019 federal election
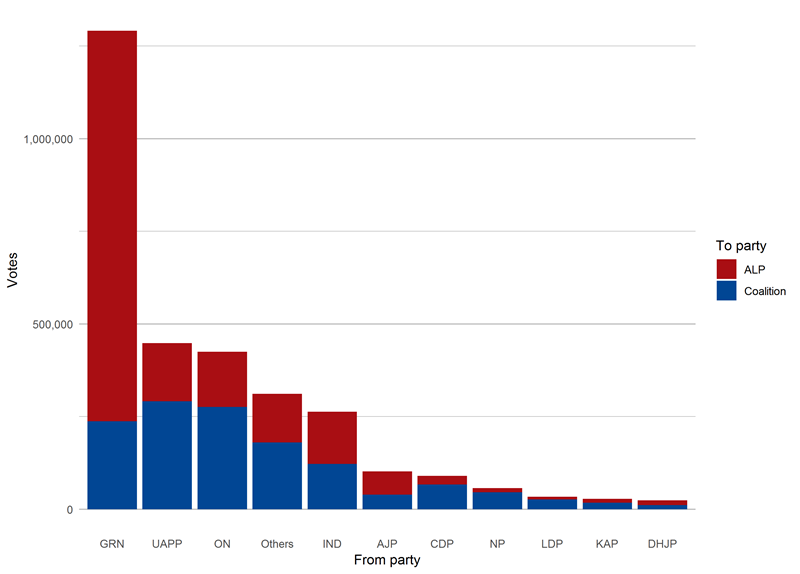
Note: ‘classic’ divisions are divisions where one of the two
candidate preferred candidates is from Labor and the other is from the
Coalition, and includes ‘three cornered contests’ where there is more than one
Coalition candidate in the division.
Source: Compiled by the Parliamentary Library from AEC election
results data.
Senate
The 2019 Senate election saw the predicted effect of the
2016 Senate voting system changes on minor party representation in the Senate
realised.[14]
Subject to a normal half-Senate quota, the only small parties other than the
Greens that won seats were PHON in Qld and the Jacqui Lambie Network (JLN) in
Tasmania (both of which incidentally returned senators who had been
disqualified during the section 44 crisis of the 45th Parliament). Both PHON
and the JLN were successful due to receiving a high proportion of the vote in
their respective states. In Qld PHON received the third highest vote by group,
with 0.72 quotas, and in Tasmania the JLN received 0.62 quotas, the fourth
highest vote in the state. The new Senate voting system has had the effect of
allowing small parties to gain Senate seats on the basis of votes rather than
preference deals.
The results of the Senate election by party and state are in
Table 6 below.
Table 6: Seats won by state in the Senate, 2019 federal
election
| State |
ALP |
LNP (Qld) |
LP |
NP |
Coalition
Total |
GRN |
JLN |
ON |
Total |
| NSW |
2 |
- |
2 |
1 |
3 |
1 |
- |
- |
6 |
| VIC |
2 |
- |
3 |
- |
3 |
1 |
- |
- |
6 |
| QLD |
1 |
3 |
- |
- |
3 |
1 |
- |
1 |
6 |
| WA |
2 |
- |
3 |
- |
3 |
1 |
- |
- |
6 |
| SA |
2 |
- |
3 |
- |
3 |
1 |
- |
- |
6 |
| TAS |
2 |
- |
2 |
- |
2 |
1 |
1 |
- |
6 |
| ACT |
1 |
- |
1 |
- |
1 |
0 |
- |
- |
2 |
| NT |
1 |
- |
1 |
- |
1 |
0 |
- |
- |
2 |
| Total |
13 |
3 |
15 |
1 |
19 |
6 |
1 |
1 |
40 |
Source: Compiled by the Parliamentary Library from AEC election
results data.
Figure 9: National Senate
primary votes (dots) and swings (arrows) by party group, 2019 federal election
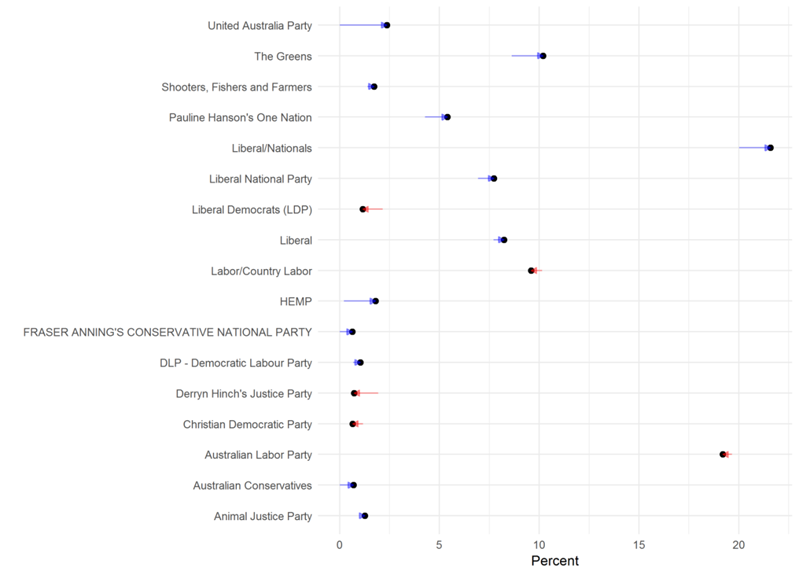
Note: only includes parties that received at least 0.5 per cent
of the national first preference vote. Some parties occur multiple times due to
running under different group names in different states—the AEC does not
provide the data required to calculate swings for combined groups.
Source: Compiled by the Parliamentary Library from AEC election
results data.
Smaller parties tended to do well in
the Senate election, with many recording a positive swing compared to the 2016
election, with notable exceptions in Derryn Hinch’s Justice Party and the
Liberal Democrats—two parties that were represented in the Senate prior to the
2019 election (Figure 9 above). In general, however, these positive swings
were not sufficient to make the parties competitive with the more established
parties in terms of winning seats. The largest negative national swing was
recorded by the CA, which saw a 3.11 percentage point drop in its vote from
2016.
Figure 10: National Senate votes (blue) and seats (red)
by party group, 2019 federal election
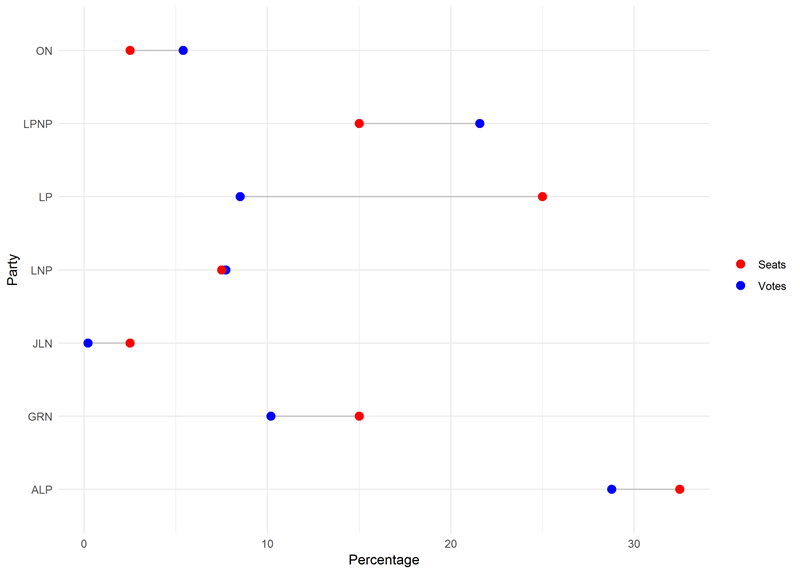
Source: Compiled by the Parliamentary Library from AEC election
results data.
Nationally, the Senate seat share of the LP, the Greens, the
JLN and the ALP tended to out-perform the parties’ vote share. The Liberal
National Party (LNP) of QLD received an unusually proportional 7.5 per cent of
the seats for 7.7 per cent of the vote (Figure 10 above). The high seat
performance relative to votes for the LP is likely due to having done
relatively well in small states (WA, SA and Tasmania), where a large state-wide
vote share is relatively small on a national level, however still results in
winning seats.
As discussed in the introduction to this paper, due to the section
44 citizenship crisis the composition of the Senate immediately prior to the
2019 election looked quite different from that of the Senate elected in 2016.
The net change as a result of the 2019 election was generally a loss of most of
the non-Greens minor party senators, with the seats being picked up by the
Coalition (Table 7 below).[15]
As elected, the resulting Senate was much more favourable to the Government for
passing legislation. If the ALP and the Greens chose to use their 35 combined
votes against the Government in the Senate, the Coalition Government only needed
four more votes from the six cross-benchers, in addition to its 35 votes, to
pass legislation. With the resignation of independent Senator Cory Bernardi
(SA) in January 2020 and his replacement by Liberal Senator Andrew McLachlan on
6 February, the Government gained one more Senate vote, meaning that it needs just
three votes from five crossbench senators to pass legislation.[16]
Table 7: Senate composition
following the 2019 federal election
| Party |
Terms end
30/06/2022 |
Terms end
30/06/2025 |
Terms end next
election |
Total |
Change |
| LP |
14 |
15 |
2 |
31 |
5 |
| ALP |
13 |
11 |
2 |
26 |
0 |
| GRN |
3 |
6 |
0 |
9 |
0 |
| NP |
2 |
2 |
0 |
4 |
-1 |
| CA |
2 |
0 |
0 |
2 |
0 |
| PHON |
1 |
1 |
0 |
2 |
0 |
| IND |
1 |
0 |
0 |
1 |
-1 |
| JLN |
0 |
1 |
0 |
1 |
1 |
| Others |
0 |
0 |
0 |
0 |
-4 |
Note: The following parties were no longer represented in the
Senate following the 2019 election: Derryn Hinch’s Justice Party (DHJP), the
Liberal Democratic Party (LDP), the United Australia Party, and, after 25 June
2019, the Australian Conservatives (AC). Senator Cori Bernardi disbanded the AC
party to sit as an independent prior to the Senate first sitting following the 2019
election. Territory senators do not have fixed terms; their terms end at the
next general election.
Source: Compiled by the Parliamentary Library
Timing of
the election
The timing of the 2019 federal election was the subject of
considerable speculation from late 2018. The 2016 double dissolution election
meant that a half-Senate election was required to be held between July 2018 and
May 2019 for the senators elected in 2016 for a short term.[17]
Further complicating the choice of election date were fixed-term elections due
in NSW (23 March 2019) and Victoria (24 November 2018), and the Federal Budget,
traditionally held in early May. The Budget was moved to 2 April 2019 to
accommodate the election timing.
Media reports stated that Prime Minister Malcolm Turnbull
had intended to call an election on 27 January 2019 for a 2 March election day,
in order to go to the polls before the NSW state election.[18]
By April 2019, however, new Prime Minister Scott Morrison was leaving open the
possibility of a May election.[19]
There was some debate over election timing in respect of how
late an election could be held.[20]
Prior to the announcement of the election there was some speculation that it
could be held as late as 25 May 2019,[21]
and while the Electoral Commissioner did not dismiss the possibility, he noted
that ‘the later we go, the more complex it becomes for the AEC but that does
not mean it is impossible.’[22]
On the morning of Thursday 11 April 2019 the Prime Minister
visited the Governor-General and advised the dissolution of the 45th Parliament
for a general election on Saturday 18 May 2019.[23]
The key dates the Prime Minister nominated (and consequential dates that follow
from those) are listed in Table 8 below.
Table 8: Key dates for the
2019 federal election
| Milestone |
Date |
| Issue of the writs |
Thursday 11 April 2019 |
| Close of the rolls |
Thursday 18 April 2019 |
| Close of nominations |
Tuesday 23 April 2019 |
| Declaration of nominations |
Wednesday 24 April 2019 |
| Early voting commences |
Monday 29 April 2019 |
| Election advertising blackout commences |
Wednesday 15 May 2019 |
| Polling day |
Saturday 18 May 2019 |
| Writs returned |
Friday 21 June 2019 |
| Last day for return of the writs |
Friday 28 June 2019 |
Source: Compiled by the Parliamentary Library
The Parliament was prorogued at 8.29am on 11 April 2019, and
as such the Senate Estimates hearings scheduled for 11 and 12 April 2019 did
not proceed.
While recent elections have generally been announced on a
weekend, with the writs issued early the following week, the 2019 election
timing provided complications with both Easter and Anzac Day occurring within
the election period.[24]
The timing of the election is dictated by the Commonwealth
Electoral Act (1918) (CEA), which nominates a minimum 33 day period between
the issue of the writs and polling day.[25]
The 2019 election period was 37 days, slightly above the average for elections
since 1984 of 35.6 days. The writs were due to be returned 41 days after
polling day, in time for the new Senators to commence their terms on Monday 1
July 2019, and were returned with a week to spare on Friday 21 June 2019.[26]
The CEA requires that close of the rolls must happen
seven days after the issue of the writs (section 155) and the close of
nominations between 10 and 27 days after the issue of the writs (section 156).
Issuing the writ on Monday 15 April would have meant that the close of rolls
would have been on Easter Monday (and for an 18 May election the close of
nominations would have had to have been on Anzac Day).
While the campaign period included public holidays, early
voting did not commence until Monday 29 April (five days after the declaration
of nominations, which is 24 hours after the close of nominations, under
subsection 200D(4) of the CEA), and so was not interrupted by any public
holidays. Prior to the election being called the Electoral Commissioner had stated
at Senate Estimates that if Anzac Day had fallen within the pre-poll period
then pre-poll voting would not be available on that day.[27]
The Prime Minister and Leader of the Opposition agreed not to campaign or run
political advertising on Good Friday, Easter Sunday or Anzac Day (however this
truce was not observed by all campaigners).[28]
Redistributions
One year after a new Parliament first meets, the CEA
requires that the AEC use the latest population statistics to determine how
many electorates each state and territory is entitled to using a formula based
on section 24 of the Australian Constitution. The entitlement
determination that occurred in the 45th Parliament required that SA lost one
seat and Victoria and the ACT gained one seat each due to their relative
population changes.[29]
For the first time 151 Members of the House of Representatives were elected at the
2019 federal election.
The 45th Parliament also saw electoral redistributions in Qld,
the NT and Tasmania due to seven years having passed since those jurisdictions
last had redistributions.
The redistribution of Qld was completed on 27 March
2019, and made relatively minor changes to the boundaries. The redistribution
retained the names of all 30 seats and adjusted the boundaries of 18 seats,
with 33,604 electors (1.09 per cent of all enrolled Queensland electors)
changing seats.[30]
The redistribution of Victoria was completed on 13
July 2018 and resulted in the creation of a new division of Fraser located in
the western suburbs of Melbourne (in honour of the former Prime Minister
Malcolm Fraser), resulting in a total of 38 electoral divisions. The
redistribution also renamed the division of McMillan to Monash, in honour of
Sir John Monash; the division of Melbourne Ports was renamed to Macnamara in
honour of Dame Annie Jean Macnamara; the division of Murray was renamed to
Nicholls in honour of Sir Douglas Ralph Nicholls and Lady Gladys Nicholls; and
the division of Batman was renamed to Cooper in recognition of William Cooper.
The names of the remaining 33 divisions were retained. A total of 769,523
electors (18.93 per cent of enrolled Victorian electors) changed their division
as a result of the redistribution, and an additional 435,141 electors (10.71
per cent of enrolled Victorian electors) were in a division that was renamed.[31]
The redistribution of the ACT was completed on 13 July
2018 and resulted in the creation of a third electoral division for the ACT,
which was named Bean in honour of Charles Bean. The naming of the electorate
resulted in a number of objections, with the augmented Electoral Commission
voting four to two in favour of Bean. The redistribution resulted in 151,218
electors in the ACT (52.44 per cent of all enrolled ACT electors) changing
their division.[32]
The redistribution of SA was completed on 20 July
2018 and resulted in the abolition of the division of Port Adelaide. In
addition, the division of Wakefield was renamed to Spence in honour of
Catherine Helen Spence. The boundaries of all South Australian divisions were
adjusted and 255,784 electors (21.40 per cent of all enrolled South Australian
electors) changed division as a result.[33]
The redistribution of the NT was completed on 7
February 2017 and resulted in an adjustment of the boundaries of the two
divisions and the movement of 2,680 electors (2.07 per cent of enrolled NT
electors) who changed divisions.[34]
The redistribution of Tasmania was completed on 14
November 2017 and resulted in adjustments of the boundaries of Bass and Lyons
and renaming of the division of Denison to Clark in honour of Andrew Inglis
Clark. The redistribution resulted in 22,800 electors (6.08 per cent of enrolled
Tasmanian electors) changing divisions.[35]
The abolished seat of Port Adelaide in SA was held by Labor,
but the new seats of both Bean (ACT) and Fraser (Vic.) were notional Labor,
giving Labor a national net gain as the result of the redistributions. The divisions
of Corangamite and Dunkley in Victoria, both won in 2016 by the Liberals, were
notionally ALP following the redistribution (by 0.03 percentage points and 1.25
percentage points respectively).[36]
The election
campaign
The 2019 federal election campaign was generally
unremarkable. The Coalition went into the election behind in the polls, however
while the Coalition was out-polled by Labor throughout the campaign, the gap
between the two parties closed across the election period.
The Coalition had its third Prime Minister since Tony Abbott
led the Coalition to government in 2013, while the ALP’s leadership team was
largely unchanged since Bill Shorten took the leadership of the party in
October 2013 following the defeat of the Rudd government.
Most commentators expected an ALP victory, if possibly a
narrow one.[37]
In particular, it was predicted that Labor would pick up two to three seats
from the Liberals in Victoria and win seats from the Liberals in NSW, but would
probably not win additional seats in Qld.[38]
The campaign was shaken by the death, two days before the
election, of former Labor Prime Minister Robert ‘Bob’ Hawke. Media reports
suggested that both major parties held the view that the death of Mr Hawke
would be generally beneficial for Labor’s election efforts.[39]
The ALP was the first of the major parties to hold a
campaign launch, doing so in Brisbane on Sunday 5 May. The launch featured
former prime ministers Kevin Rudd and Julia Gillard, and Bill Shorten
articulated Labor’s campaign promises on health, tax cuts, education, climate
change and fairness.[40]
The Coalition campaign launch was held in Melbourne on Mothers’ Day, Sunday 12
May. Commentators noted that the launch was focused almost exclusively on Scott
Morrison as leader, in part to shift focus from the leadership instability that
the party had experienced in the past six years.[41]
While it had been the case that the parties had an agreement
not to claim travel allowances after the campaign launch, a media report prior
to the election stated that at the 2019 election ‘both sides of politics can
travel on chartered and domestic flights and claim travel allowance all the way
to election day’.[42]
Post-election media reports stated that in April, May and June cabinet
ministers’ staff accumulated $5 million in travel expenses, and shadow
ministers’ staff around $1.6 million.[43]
The policy contest
The federal Budget, usually delivered in May, was delivered
on 2 April 2019, and was viewed by commentators as an ‘election budget’. The
Budget featured tax cuts, both immediate and into the future, and a commitment
to return the Budget to a small surplus, though was otherwise restrained in
terms of new spending.[44]
The Coalition largely relied on the Budget, delivered two weeks before the
election period began, as the foundation of its campaign, with a focus on
maintaining a strong economy.[45]
A statement by the Prime Minister proposed that voters ‘have
the choice between the LNP that is delivering a strong economy and will
continue to do so, or Bill Shorten and the Labor Party, who are proposing
massive new taxes that will only weaken our economy’.[46]
Bill Shorten, in a statement to voters, asserted that the Government ‘has no
agenda for the next three years apart from a plan to give a $77 billion tax
handout to the top end of town’.[47]
Labor went to the election with largely the same suite of
policies that had delivered it an almost three per cent swing and 49.6 per cent
of the two-party preferred vote at the 2016 federal election. Labor’s promises
amounted to an extensive list of expenditure measures along with a number of
savings measures to fund them. The highest profile savings measures were the
abolition of negative gearing on all but newly-built investment properties
(grandfathering existing negative gearing), and the cessation of tax rebates
for franking credits.[48]
These two policies were calculated to save the budget $14.2 billion over the following
four years and $32 billion in a decade, respectively.[49]
The Opposition Leader conceded that Labor’s campaign promises, particularly in
relation to the savings issues, ‘have given our opponents plenty of ammunition
for their endless scare campaigns’.[50]
One aspect of the campaign that was considered significant (mostly
in retrospect) was the position of the ALP on the proposed Adani coal mine in
Queensland. Labor’s climate change position, which was viewed as being
anti-coal, was reported prior to the election as damaging Labor’s chances of
picking up rural and regional Queensland seats, although it was expected that
Labor would do better in Brisbane.[51]
While Labor generally attempted to avoid taking a position on the Adani mine,
noting that environmental approvals had already been granted by the Government,
one significant union threatened to campaign against candidates if it looked
like Labor would not support the mine proceeding.[52]
The Greens argued that the Adani mine ‘can’t be built’, and
former Greens leader Bob Brown led a convoy from Hobart to the mine site in the
Qld Galilee Basin to protest against the mine.[53]
After stopping at Clermont in central Qld, the convoy finished at Parliament
House in Canberra prior to the election.[54]
In the wake of the election, Greens leader Richard Di Natale concluded that the
convoy had harmed Labor in the election ‘because the Labor party refused to
take a clear position’.[55]
Similarly, a Labor MP who lost a central Qld seat agreed that the way Labor’s
climate policy was conveyed alienated blue-collar workers.[56]
According to Labor’s official review of its campaign:
Labor’s ambiguous language on Adani, combined with some
anti-coal rhetoric and the Coalition’s campaign associating Labor with the
Greens in voters’ minds, devastated its support in the coal mining communities
of regional Queensland and the Hunter Valley.[57]
Candidate
disendorsements
The election saw an unprecedented number of candidates
either resign or lose their party endorsement. There is no provision in the CEA
for the removal from the ballot paper of candidates who resign or who are
disendorsed by their party after the close of nominations. For the 2019 federal
election ten candidates resigned or were disendorsed by their party after the
close of nominations:
- Gurpal Singh (Scullin, Vic.), Liberal
- Luke Creasey (Melbourne, Vic.), Labor
- Peter Killin (Wills, Vic.), Liberal
- Jeremy Hearn (Isaacs, Vic.), Liberal
-
Jessica Whelan (Lyons, Tas.), Liberal
- Steve Dickson (Qld Senate), One Nation
- Wayne Kurnorth (NT Senate), Labor
- Jay Dessi (Lalor, Vic.), Greens
- Tony Pecora (Melbourne, Vic.), United Australia and
- David Paull (Parkes, NSW), Greens.
While none of the disendorsed candidates were elected, some
polled well despite their disendorsement (Jeremy Hearn received 35 per cent of
the vote in Isaacs, coming second behind the winning Labor candidate, for
example).
As a response to the string of disendorsements the Victorian
Liberal Party brought forward its preselection process for the next federal
election, closing nominations in January 2020.[58]
However the candidates’ votes, due to be conducted in March 2020, have at the
time of publication been delayed indefinitely due to the COVID-19 pandemic.[59]
Candidates who are disendorsed by
their party after the close of the nominations continue to have their original
party listed against their name on the ballot paper, and the party will receive
per-vote public funding for any votes received by such candidates. The public
funding scheme was changed prior to the 2019 federal election, with parties and
candidates being required to submit a claim to the AEC for reimbursement of
campaign expenditure up to the public funding amount. On the basis of the
public funding rate and the votes the candidates received, the Liberals were
eligible for around $246,000 in public funding from the votes from their
disendorsed candidates, Labor around $51,000, and the Greens around $31,000.
None of the disendorsed Senate candidates received sufficient votes to reach
the four per cent threshold to qualify for public funding.
Electoral
advertising on social media
Authorisation
requirements
Following changes to the CEA by the Electoral and
Other Legislation Amendment Act 2017 (Cth), the requirements to authorise
electoral advertising were expanded and in some cases clarified to explicitly
cover electoral advertising by social media.[60]
The AEC is responsible for administering and enforcing the
authorisation provisions. A pre-election report in The Guardian noted
the AEC’s strategy for policing social media advertising:
The AEC said in a statement that generally unauthorised paid
electoral ads infringe on the Commonwealth Electorate Act. But given the volume
of material on Facebook and other channels, the AEC said it “benefits” from
public reports to identify where the law has been breached.
Once alerted, it contacts the Facebook group and asks for the
ad to be authorised or removed.
“If the infringement is not addressed, the AEC can contact
the relevant social media provider to advise them to remove the unauthorised
electoral advertisement,” a spokesman said. “The AEC may also consider legal
action, such as an injunction to prevent the further display of the unlawful
advertising, and, in serious cases, civil penalties for breaching the Electoral
Act.”[61]
More recently the AEC has indicated that it had positive
interactions with social media providers in respect of the 2019 election. In
December 2019, in evidence to the parliamentary Joint Standing Committee on
Electoral Matters (JSCEM) inquiry into the 2019 federal election, the Electoral
Commissioner stated:
At the last event, we had more interaction and, I would say,
better cooperation with the social media companies than we've ever had
previously. It was the first election where our interaction was comprehensive
before and during, and we're pretty happy with what we achieved with them as a
one-off... It wasn't just with Twitter, Google and Facebook; we also reached out
to WeChat. As you know, in Australia there are a very large number of users of
WeChat as well. [62]
In its post-election submission to the JSCEM inquiry, the
AEC stated that it had received 1,072 enquiries and complaints relating to
electoral communication (an increase on what was received in relation to the 2016
election). It provided advice in relation to 544 of these and investigated 528,
of which 109 (some 20 per cent) related to social media communications. The
outcomes of the 528 investigations are detailed in Table 9 below.[63]
Table 9: Electoral communication
investigated by the AEC at the 2019 federal election
| |
Communications
investigated |
No breach |
Breach (s 321D) |
Breach (s 329) |
| Social media |
109 |
81 |
25 |
3 |
| Signs and print |
223 |
183 |
47 |
3 |
| Other communications |
186 |
175 |
10 |
1 |
| Total |
528 |
439 |
82 |
7 |
Source: Australian Electoral Commission[64]
Note: Section 321D of the CEA relates to improper authorisation
of electoral communication and section 329 relates to electoral communications
that mislead or deceive an elector in relation to the casting of a vote.
In the report the AEC stated that it issued 78 warnings in
relation to breaches and took further action on 11 matters where the
infringement was not addressed following the warning by asking the social media
company to remove the material.[65]
Transparency
of electoral advertising on Facebook
In light of recent criticisms of the lack of transparency of
political advertising on Facebook, Facebook has introduced an ‘Ad
Library’, which aims to make public otherwise ‘dark’ (that is, not publicly
viewable) targeted political advertising. An ABC report shortly after the 2019
election noted that Facebook’s Ad Library did not include information such as
the demographic targeting of ads, as is available in some regions. It was also reported
that Facebook would make the data available globally in June 2019 (Ad Library now
contains Facebook ads from Australian political parties and candidates).[66]
In evidence to the JSCEM the AEC noted that, according to
Facebook, Ad Library was not available in relation to political advertising for
the 2019 federal election due to a number of elections internationally.[67]
In April 2019 Facebook had published a blog post in which it discussed Ad
Library in the context of the election, stating that it would ‘shin[e] a
brighter light on advertising and Pages [which] makes both Facebook and
advertisers more accountable, which is good for people and good for democracy’.
Facebook also stated that it would block foreign electoral advertising:
Combating foreign interference is a key pillar of our
approach to safeguarding elections on our platform. As part of this commitment,
we’re temporarily not allowing electoral ads purchased from outside Australia
ahead of the election in May.
The restriction will take effect the day after the election
is called and will apply to ads we determine to be coming from foreign entities
that are of an electoral nature, meaning they contain references to politicians,
parties or election suppression. We also won’t allow foreign ads that include
political slogans and party logos.[68]
Due to the limited transparency of political advertising on
Facebook at the time of the 2019 election, both the
Guardian and the ABC
launched initiatives encouraging people to take screenshots of political
advertising and to share these with the media organisations for archiving. The
Guardian’s archive is still available, although the ABC archive appears no
longer to be accessible.
The Guardian published some analysis of the Facebook ads
that were submitted to it and data provided by Facebook’s Ad Library, finding
that ads sponsored by political campaigns were targeted in a range of ways, for
example towards particular demographics or specific interests that might be
affected by significant election policies. The Guardian’s analysis also found
‘many’ ads without proper authorisation information, including ads from
anonymous pages.[69]
One particular stream of social media election advertising
that has been investigated in some depth related to material suggesting that
Labor had plans to introduce a death tax if it was elected. According to an
investigation by The Guardian, the death tax material was widely shared
on Facebook, and the belief that Labor would introduce a death tax was
encountered by Labor MPs campaigning for the election.[70]
The Guardian report found that claims Labor was in favour of a death tax
could be traced back to a Daily Telegraph article from July 2018 regarding
Australian Council of Trade Unions support for an inheritance tax;[71]
a follow-up discussion on the ‘Sunrise’ television program the next day; and a subsequent
media release by the Treasurer in January 2019.[72]
The report states that at first the spread of the material
was relatively organic:
The Sunrise clip was shared by One Nation leader Pauline
Hanson’s official Facebook account the same day it aired. Hanson’s post alone
was viewed 106,000 times. LNP members Ian MacDonald and George Christensen began
to push the death tax messaging from their Facebook pages in late January and
early February, but their posts achieved relatively little engagement.[73]
The Guardian noted that the material spread rapidly
in the lead-up to the election and was forwarded to people via direct Facebook
message. The same message was also being spread by minor parties and others:
The death tax messaging on social media was being amplified
by minor parties, including Clive Palmer’s United Australia party, which was
engaged in saturation advertising, by fringe right-wing groups, and by
individual Coalition senators. The LNP backbencher George Christensen published
three Facebook posts on the topic on one day, 22 April. Christensen’s first
post was titled “Labor’s secret plans for a DEATH TAX”. A day later, Rite-On, a
right-wing group with a significant online following, published a post
headlined “DEATH TAX – INHERITANCE TAX – DEATH DUTY, call it what you will, it
will hit us all”.[74]
Exactly who was responsible for the rapid spread of the
death tax message remains unclear; however the information in the report might
seem to indicate that it was more than just organic spread of a message that
caught the attention of a sub-set of the electorate.
Even if Facebook’s Ad Library had been in full operation
in the 2019 federal election, it is difficult to know how effective it would
have been in revealing any organisation behind the death taxes campaign. The Guardian
reports that the campaign did involve some paid Facebook advertising by
candidates and campaigns, which should have been caught by Ad Library; but
sharing by groups and individuals would likely not have been exposed by Ad
Library. It is therefore questionable whether Facebook provides the tools to
render transparency to these sorts of campaigns.
In a policy shift that happened after the federal election, Facebook
has recently stated that posts shared by politicians are not subject to
Facebook’s community standards or fact-checking.[75]
Facebook has stated that it exempts politicians from its fact-checking program,
but that if a politician shares previously debunked content it will be
‘demoted’ (however paid ads must be consistent with Facebook’s ‘Community
Standards’, and debunked content cannot be displayed in paid ads).[76]
Google has stopped allowing political ads to be targeted to search users, and
Twitter has stopped accepting paid political advertising.[77]
Expenditure
on social media electoral advertising
How much of the electoral advertising spend in Australia
goes on social media is impossible to accurately determine. Australian federal
political finance laws do not require parties to disclose their election
campaign spending—parties are only required to report annual total income,
donations, expenditure and loans, and are not required to state what proportion
of the expenditure related to a campaign.
Media monitoring companies also tend not to provide social
media campaign spending estimates as they do with traditional broadcast media,
at least partly because much of the advertising is micro-targeted and so only
appears to certain users.[78]
Television, radio and print advertising, on the other hand, is by definition
public, and more closely monitored, allowing spending estimates to be made. For
example, for the 2016 election an estimated $16m was spent on television, radio
and print advertising, 90 per cent of it by the Coalition and the ALP; for the
2019 federal election, by mid-March 2019 Clive Palmer alone had already spent
an estimated $21m.[79]
In contrast, it has been estimated that the major party spends on online and
social media advertising would constitute around 20 to 30 per cent of the total
ad spend.[80]
Election appeals: citizenship
and purple signs
In its inquiry report on the section 44 crisis, the JSCEM
recommended that, in the absence of a referendum to change the Constitution,
the Government should consider strategies to mitigate the impact of section 44,
such as ‘that all candidates for election be required to make a public
disclosure of family citizenship history at time of nomination.’[81]
The Government responded to this recommendation by passing the Electoral
Legislation Amendment (Modernisation and Other Measures) Act 2019 (Cth),
which requires that, as part of the nomination process, all election candidates
are required to disclose certain information in relation to the eligibility
criteria in section 44.[82]
In relation to the 2019 federal election, this measure appears to have been
successful, as only one substantive section 44 challenge—which was subsequently
dismissed by the court—was filed in the wake of the election (however former
senator Rodney Culleton was referred to police by the AEC for submitting a
nomination form stating he was eligible while he was listed as an undischarged
bankrupt[83]).
The section 44 challenge that resulted from the election was
to the eligibility of the member for Kooyong (Vic.), federal Treasurer Josh
Frydenberg. Mr Frydenberg’s eligibility had come under question at the height
of the section 44 crisis, but the question of his eligibility was not referred
to the High Court.[84]
The High Court’s 2018 decision in Alley v Gillespie
confirmed that the only way for the eligibility of a member or candidate to be
challenged on the basis of section 44 was by a referral from the relevant
Chamber of Parliament, or in the 40 days after the return of the writ for the
election under section 355 of the CEA.[85]
The petition lodged by Michael Staindl against Mr Frydenberg claimed that Mr
Frydenberg was not eligible to sit in the Parliament as he was a citizen of the
Republic of Hungary.[86]
The challenge against Mr Frydenberg’s eligibility was labelled by critics as
being anti-Semitic and ‘disgraceful’ (Mr Frydenberg’s mother was a Holocaust
survivor).[87]
The Federal Court, sitting as the Court of Disputed Returns,
dismissed the challenge on 17 March 2020, concluding that Mr Frydenberg ‘was
not, and never has been, a citizen of Hungary’. Mr Staindl was ordered to pay
costs.[88]
On the subject of election signs, two other petitions
related to the same election signage in both Mr Frydenberg’s electorate of
Kooyong and in the division of Chisholm, which elected Liberal candidate Gladys
Liu.[89]
The High Court, sitting as the Court of Disputed Returns, referred the petitions
for trial to the Federal Court of Australia.[90]
The petitions related to signs at polling places in the two electorates that
were authorised by the Liberal Party. The signs were in Chinese characters and
were in the distinctive purple colour (or a very similar colour) that has been
a feature of the AEC’s branding since 2007. The petitions argued that the signs
were likely to mislead voters as they translated to instructing voters that the
‘correct’ way to vote was to put a ‘1’ next to the LP candidate.[91]
On 24 December 2019 the Federal Court, sitting as the Court
of Disputed Returns, dismissed the petitions. The Court concluded that the
signs were misleading and deceptive in that they purported to be from the AEC
and they stated that the ‘correct’ way to vote was to vote for the Liberal
Party. The Court found that, even if voters were influenced by the signs, it
would not have been in sufficient numbers to affect the result of the election.
The Court ordered that the LP official who authorised the
signs demonstrate to the court why their authorisation of the signs was not an
illegal act under section 329(1) of the CEA.[92]
On 20 February 2020 the Court found that it had insufficient evidence to
determine that the official had the requisite state of mind and knowledge to
have breached the Act and did not proceed any further with the case.[93]
Clive Palmer’s
High Court case on the early release of election results
Under Australia’s preferential voting system, each election
in each division comes down to a contest between two candidates, with the
preferences on the votes for all of the other candidates eventually counting
towards one of those two candidates. To expedite the count, the AEC chooses the
candidates most likely to be the final two candidates in each division, and
conducts and publishes a preference count against those candidates. The count
is referred to as the ‘two-candidate preferred’ (TCP) count, and these
candidates are the TCP candidates. The TCP candidates are not made public by
the AEC until after the polls have closed in that division.
In April 2019 Clive Palmer took the AEC to the High Court,
arguing that the AEC’s practice of choosing two candidates in each division
might reduce the incentive for voters in parts of the country where the polls
are still open due to time zone differences to vote for minor parties or
independents. He sought orders from the Court to prevent the AEC publicly
revealing the predicted final two candidates in any electorate until all of the
polls in the country had closed.[94]
The High Court unanimously dismissed the case on 7 May 2019.
In reasons published in August 2019, some months after the election, the Court
stated that Mr Palmer’s contention that releasing the predicted final
candidates was not authorised under the CEA, and that releasing the
information would distort the voting system ‘lacked a factual foundation’.[95]
The opinion polling
failure
In the time period between the 2016 federal election and the
2019 federal election the Coalition only received a TPP opinion (voting
intentions) poll result above 50 per cent twice, both in 2017 in the
short-lived YouGov poll series.[96]
For the majority of the term of the 45th Parliament, and for the entirety of
the term in the case of the most prolific pollsters, Labor led the polls in TPP
terms (Figure 11 below). While the polls in the lead-up to the election showed
a narrowing of the gap, the final polls of all of the major polling companies
predicted a narrow win for Labor (see Appendix C).
Figure 11: Opinion polls over
the 45th Parliament
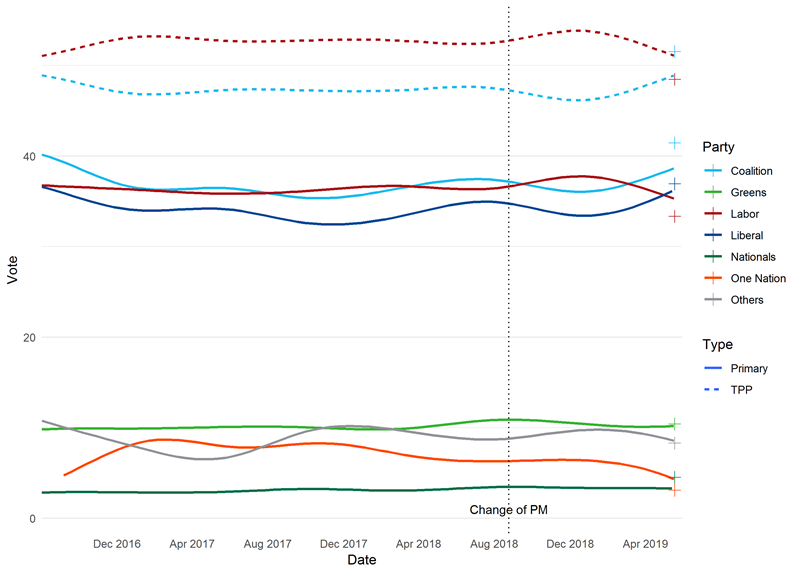
Note: curved lines represent polling averages for each party
and the ‘+’ indicates the 2019 election result for the party.
Source: Compiled by the Parliamentary Library from various
sources.
What is particularly notable about the failure of polling in
the 2019 federal election was not so much that the polls consistently failed to
predict the outcome (although this is significant), but that the polls were so
poor in 2019 after having been so accurate in previous elections.
The Library’s analysis of the polling for the 2016 federal
election noted:
The accuracy of the pollsters has been analysed by a number
of sources, including by polling company ReachTel, who were pleased to report
that it was ‘accurate to less than a single percentage point’ for its TPP
results. In fact, all of the final polls from the major polling companies came
to within one percentage point of the final TPP result, with Essential and
Newspoll coming within 0.1 percentage point of the final result. Newspoll had
each of the major party primary votes to within 0.3 percentage points of their
actual result.[97]
That is, the polls were remarkably accurate in 2016 in
Australia, despite significant failures in other western democracies. The 2016
federal election paper went on to note:
Given the significant failures of polling in recent elections
in other, similar, western democracies (such as the United Kingdom (UK) in 2015
and the United States in 2016), there is a question as to why the national
polling in Australia continues to be so accurate. The increasing number of
households without landlines was thought to undermine the representativeness of
political polling, however, the one Australian polling company that still uses
live phone calls, Ipsos, was substantially less accurate than those who use
robopolling (automated phone calls) and online panels, such as ReachTel and
Newspoll.
It may be that Australia’s compulsory voting is one of the
reasons that polling still works for Australian elections. A review of the
failure of the polls at the 2015 UK general election found that three groups
were underrepresented in the polling: older voters, who predominately voted
Tory; young non-voters, who were polled less frequently than young people who
did intend to vote; and busy voters, who were more likely to vote Tory.
Compulsory voting means that Australian polling has much
firmer grounds for extrapolating from demographic sub-samples. As long as some
older people respond to an online poll, and those people are reasonably representative
of the views of older people, it is not difficult to extrapolate to the wider
voting population with a degree of accuracy. Sophisticated turnout models to
determine which demographics will vote are not necessary. Polling experts also
note that the Telemarketing and Research Industry Standard, which allows
polling companies to contact numbers on the Do Not Call Register if the polling
is for research purposes, also adds to the accuracy of Australian polling. [98]
The major factors that existed in 2016 essentially
continued relatively unchanged in 2019: a trend away from fixed phone lines to
mobile phones; lack of a phone directory mapping mobile phone numbers to
geographical addresses; and compulsory voting and high levels of turnout. Any
analysis of the 2019 polling failure should be viewed within this wider
context.
It has been noted that while seat-level polling continues
to be highly unreliable, and similar failures in state election polls have
occurred recently, the amount of polling at the federal level in the lead-up to
an election tends to smooth over any inconsistencies between single polls when
the entirety of the polling is aggregated.[99]
As such, the failure in 2019 was essentially unprecedented.
One political scientist has argued that the polling
suggesting that Labor would win likely affected the style of campaigns run by
Labor and the Coalition, which as a result may have affected the outcome of the
election.[100]
A number of theories have been proposed as to why the
polls may have failed so notably in 2019, but as yet there is little evidence
to promote one theory over another. The theories that have been advanced for
the failure include:
- herding, where polling companies deliberately or inadvertently
adjust their results to be more consistent with other polling results (either
their own previous polls or the polls of other polling companies)[101]
- reluctance of polled voters to tell pollsters that they planned
to vote for the Coalition (referred to as the ‘shy Tory’ effect in the UK)[102]
- a late swing to the Coalition, not captured by any of the polls (however
at least one polling expert’s view is that all the evidence suggests that there
was no such late swing)[103]
-
voters deciding late, who had told pollsters they ‘don’t know’
who they were voting for, favouring the Coalition[104]
and
-
poor sampling procedure that systematically missed some voters
who prefer the Coalition.[105]
The Australian Market and Social Research Organisation
(AMSRO), a peak body for social research companies, announced an inquiry into
the polling failure.[106]
However it has been noted that of the pollsters who published national polls
for the 2019 federal election, only Ipsos appears to be a member of AMSRO,[107]
and the media organisations that had commissioned Ipsos’ polling have ended the
relationship after the 2019 federal election.[108]
In a statement YouGov, which owns Galaxy and conducts
Newspoll, stated that it would submit a written statement to the inquiry, but
that as ‘the polling conducted under our brand YouGov Galaxy during the federal
election was commissioned by paid clients it is not appropriate to provide raw
data from these polls retrospectively to third parties’.[109]
AMSRO released an interim discussion paper on 20 May 2020
for consultation,[110]
focusing on methodological transparency, rather than offering a view as to what
went wrong in 2019.[111]
A complicating factor for examining the cause of the polling
failure is the lack of transparency in the ways in which polling is conducted
in Australia. One long-time polling expert has noted that many Australian polls
do publish their sample size and the dates on which the polling is conducted,
but do not publish the sampling variance of the poll, and some do not publish
the questions that were asked.[112]
In conducting a poll a polling company will typically identify
a number of parties and ask the respondent which of those, or ‘other’, would
receive their first preference. If the answer is ‘other’ then a list of minor
parties may be read out. Analysts have noted that including a minor party in
the first list tends to elevate the numbers of respondents who chose that
party. Changes in the parties that are part of that list over time leads to
difficulties in comparing results over time, particularly if a polling company
is not transparent about the changes. Pollsters can also be inconsistent and
non-transparent about how they treat the respondents who report they do not
know who they are voting for.[113]
Even the questions of who owns a polling company and the interests of the
owners, and who has paid for a particular poll, are often unclear.[114]
Another polling analyst has reported that while Galaxy, which
produces Newspoll, used online methods and robopolls, it was not known what
proportion of each sampling approach was used to produce the outcome.[115]
Other Australian pollsters use a variety of measures for contacting respondents:
The four active pollsters at this election were YouGov
Galaxy, which conducts Newspoll, Ipsos, Essential and Morgan. Galaxy uses
online methods and robopolling, Essential uses online methods, Ipsos uses live
phone polling and Morgan uses face-to-face interviews. No pollster does only
landline polling – Ipsos calls mobiles.[116]
In September 2019 YouGov announced that it would be
adjusting its polling procedure in the wake of the 2019 federal election opinion
polling failure and that it supported the creation of an Australian Polling
Council, along similar lines to the British Polling Council. YouGov stated that
it was ‘supportive of a common goal of greater transparency and ongoing public
confidence’.[117]
In April 2020 YouGov announced the creation of the Australian Polling Council,
with Essential and UComms as members. The three members constitute the majority
of political opinion polling in Australia. The statement said:
The objectives of the Council are to adhere
to a strict set of guidelines intended to:
◦ Ensure
standards of disclosure that provide an adequate basis for judging the
reliability and validity of the results of survey results that are published in
media
◦ Encourage
the highest professional standards in public opinion polling and advance the
understanding of how polls are conducted and how to interpret poll results
◦ Inform media
and the public about best practice in the conduct and reporting of polls
Inspired by similar organisations in the US
and Great Britain; YouGov, Essential and UComms believe that the future of
Australian polling should operate with guidelines informed by a deep
understanding of the market and the complexities of the local landscape.
These guidelines aim to provide an
appropriate balance between responsible disclosure to the public, the needs of
media outlets, and the intellectual property rights of the polling companies.
Active polling companies in the industry are invited to join in to
develop these guidelines.
The Australian Polling Council believes that
though published political polling needs to have appropriate standards of
transparency, existing standards of disclosure are not fit for purpose. The
guidelines ought to be determined by active pollsters as well as accepted by
the Australian media. [118]
The organisations stated that they would release a new set
of standards and disclosure for polling before July 2020.
In the absence of complete transparency it is difficult to
have an informed view of the accuracy of polling, or to diagnose what went
wrong in 2019, and whether it is likely to continue to go wrong in the future. It
is likely that there is not any one cause of the polling failure, but a
combination of several factors, possibly exacerbating each other.
Cost of the
election and campaign
Accurate expenditure details are not available for
Australian federal elections because parties are not required to report their
electoral expenditure. Annual returns to the AEC listing donors over the
disclosure threshold ($13,800 for the 2019 federal election) and total party
income and expenditure were released by the AEC in February 2020 for the
2018–19 financial year, which includes the May 2019 election.
Amendments to the CEA contained in the Electoral
Legislation Amendment (Electoral Funding and Disclosure Reform) Act 2018,
which came into effect before the election, changed the election funding
provisions to require parties and candidates to submit a claim for any public
funding over $10,000. The AEC has not published the details of the claims made
by the parties, only whether the claim was accepted in whole, or accepted in
part and refused in part, and the amount paid.[119]
As such, the changes have not provided substantial additional public
information about campaign expenditures. The total amount of public funding
paid was $69,647,101.79, which includes $584,640 in automatic payments and
$69,062,461.79 in accepted claims.[120]
A detailed breakdown of the per candidate and party amounts of public funding
is available in Appendix D.
In the absence of any actual figures on expenditure, a
number of commentators have provided figures which appear to be either
estimates or leaks. While it is not clear where the figures come from, one
media article has claimed that Clive Palmer spent $53 million on ads for the
campaign, the Greens spent $320,000 and Jacqui Lambie spent $50,000.[121]
Analysis published in The Guardian estimated that in the final three
weeks of the election Clive Palmer spent $15 million, the Coalition $6.3
million, Labor $7 million and the ACTU $3 million.[122]
GetUp reported that it spent $3.5 million on its election campaign.[123]
The Liberal Party reportedly spent $1.5 million on its unsuccessful campaign to
retain the division of Warringah.[124]
Another media article claims that Labor spent $31.9m on its
campaign.[125]
The article notes that Labor’s spending was based on its expected election
funding at the level it was polling prior to the election, and the resulting
lower than anticipated primary vote had resulted in a $1 million deficit for
the campaign. Similar estimates of the total Coalition spending do not appear
to have been published.
Other reports claim that Clive Palmer’s UAP spent $60m on
election advertising, including $8 million on advertising in the final week of
the campaign.[126]
Mr Palmer himself estimated that the spend was $65 to $70 million.[127]
It was estimated that Mr Palmer was the sixth-largest advertising spender in Australia
between June 2018 and May 2019, outspending Coles, Toyota and McDonalds, with
no other political party in the top 50 spenders.[128]
Mr Palmer’s spending was cited in submissions to the JSCEM inquiry into the
2019 federal election as a reason to introduce expenditure caps for federal
elections.[129]
The AEC reported that the total cost of the election was
$372.5 million, which included $69.6 million in public election funding. The
break-down of the costs is reproduced in Table 10 below.[130]
Table 10: Costs of the 2019 federal election
| Item |
Cost ($) |
| Employee expenses |
103 330 537 |
| Labour hire |
38 334 000 |
| Property, office supplies and services (inc. venue/equip
hire, security, stationery) |
38 104 760 |
| Election cardboard and supplies (inc. electoral forms,
envelopes, ballot papers, screens) |
21 672 260 |
| Contracted services (excluding labour hire) |
36 102 260 |
| Travel |
2 491 455 |
| Advertising, printing and media services |
22 509 500 |
| ICT costs |
1 167 533 |
| Mailing and freight services |
31 970 699 |
| Other expenses |
7 142 707 |
| Sub total |
302 825 920 |
| Public funding (a) |
69 647 102 |
| Total expenses |
372 473 022 |
Source: AEC Electoral
Pocketbook 2019, p 38.
Early voting
The continuing rise in early voting is no longer surprising,
having followed a relatively predictable trend over the last decade from the
introduction of pre-poll ordinary votes for the 2010 federal election.[131]
While pre-poll declaration votes and postal votes have remained relatively
stable over recent elections, the proportion of votes cast as pre-poll ordinary
votes has continued to climb at an essentially linear rate, single-handedly
driving the increase in early voting. For the 2019 federal election the total
number of early votes (pre-poll ordinary, pre-poll declaration, and postal) was
6.16 million votes, or 40.8 per cent of total votes.
Figure 12: Type of vote, federal elections 2004–
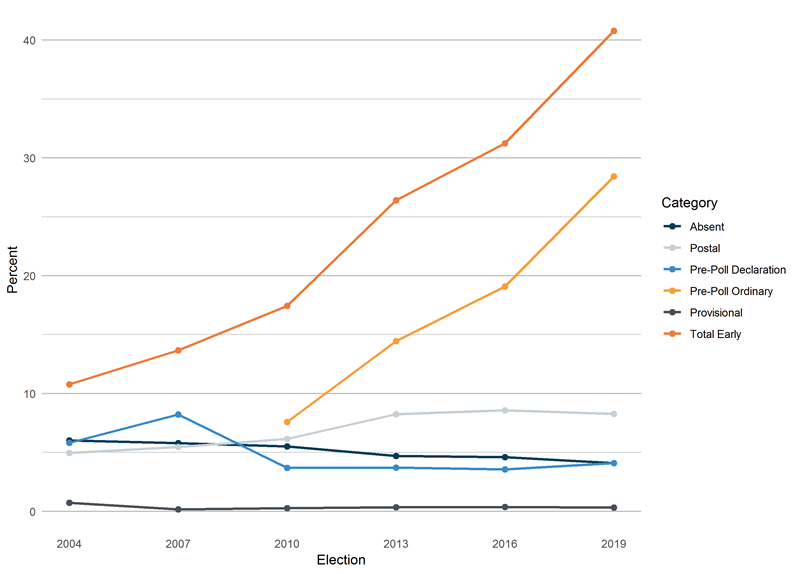
Note: Postal votes, pre-poll ordinary and pre-poll declaration
votes are early votes.
Source: Compiled by the Parliamentary Library from AEC election
results data.
In its report on the 2016 federal election, the JSCEM
recommended that pre-poll voting be restricted to no more than two weeks prior
to the election.[132]
The CEA allows pre-poll voting to commence five days after the declaration
of nominations, which, for the 2019 federal election, resulted in a three-week
pre-poll voting period (in 2013 and 2016 early voting commenced on the Tuesday
three weeks before the election, resulting in a pre-poll period that was one
day shorter). Similar calls for restricting the pre-poll voting period
(specifically for pre-poll ordinary votes, but not for postal votes) have been
made in relation to the JSCEM’s inquiry into the 2019 federal election.[133]
It is difficult to determine what effect restricting the
amount of time available for pre-poll voting would have on the number of early
votes cast in future elections. While pre-poll voting runs for between 18 and
25 days,[134]
fewer people tend to cast their pre-poll vote early in the period. Since 2010,
around half of all pre-poll voters have cast their vote in the five days before
the election, with around ten per cent of pre-poll voters voting in the first
week of the pre-poll period.[135]
If pre-poll voting had been restricted to two weeks for the 2019 election, and
none of the roughly 660,000 people who voted in that first week of the 2019 pre-poll
period voted later in the period, the number of pre-poll votes in 2019 would
still have exceeded the total number of pre-polls in 2016 by more than 1.1
million votes.
Figure 13: Pre-poll ordinary votes received by day,
federal elections 2010–
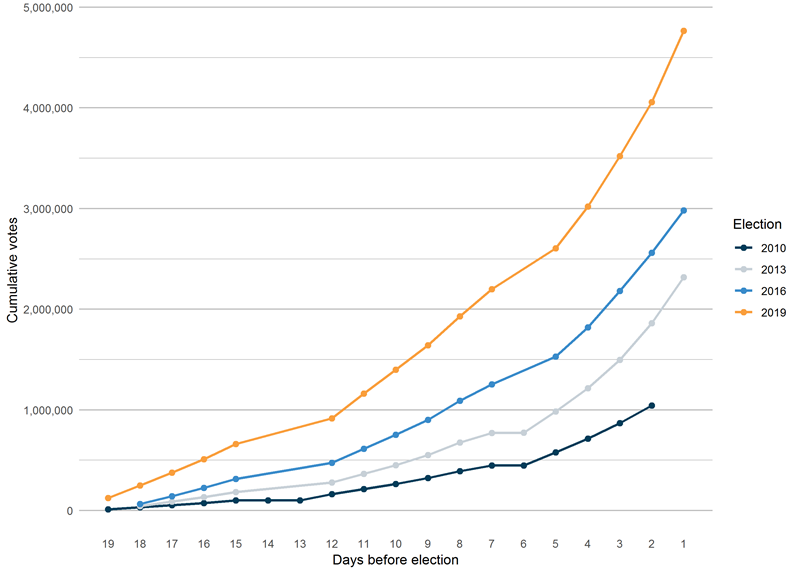
Source: Compiled by the Parliamentary Library from AEC data.
The significance of pre-poll voting, however, is not just in
the number of early votes, but also relates to the impact of the three-week
period on campaigning. The continued rise in early voting would at this point
not be a surprise for political parties. Parties and candidates increasingly plan
their campaigns around the expectation that many voters will only see the
campaigning they do and policies they release in the first few weeks of election
periods, rather than the traditional model of a build-up over the election
period to an intensive phase and launch in the last week before the election.
Parties realise that any policies they intend to announce to
convince voters to vote for them must be released early in the campaign in
order to affect the largest number of voters, and that there is ‘no point
making a campaign announcement in the final week of the campaign when perhaps
30 per cent of the electorate has already voted’.[136]
However, it is also true that the majority of early votes are cast in the last
week of the campaign, so in recent elections the traditional party campaign
launch a week or two out from election day has still had the potential to swing
a substantial proportion of the early voting population (the campaign launches
are discussed on page 21, above).
One practical issue that the early voting period raises for
candidates and parties is their ability to attend early voting centres in
electorates and hand out campaign material such as how-to-vote cards. Smaller
parties and independents may find attending early voting centres for three
weeks to be particularly challenging. Fewer people handing out how-to-vote
material may also affect the formality of votes cast in early voting centres,
particularly in areas where there are higher proportions of voters who do not
speak English fluently or large numbers of candidates on the ballot paper (both
are factors associated with higher levels of informality according to AEC research).[137]
For the 2019 election at least, according to Parliamentary Library analysis pre-poll
ordinary voting tended to have a slightly lower level of informality compared
to election-day voting, suggesting that any effect on informality of access to
how-to-vote material is not yet apparent in respect of the 2019 election.[138]
While the continued increase in the
early voting rate has been the subject of considerable commentary, less noticed
is the apparent peak of postal voting, with a slight decrease in the proportion
of votes cast as postal votes in 2019 (albeit with a small rise in the absolute
number of postal votes).
In addition, the source of postal vote applications (PVAs)
has changed considerably over recent elections.[139]
Political parties regularly send PVA forms to supporters and other electors,
which are then generally returned to the party and forwarded on to the AEC.
This practice has drawn criticism over the years, but it has been a
longstanding feature of Australian federal elections.[140]
Postal votes may also be applied for by filling in a form and returning it to
the AEC, or applying online directly with the AEC.[141]
At the 2010 federal election roughly one-third of postal
vote applications came via the Liberal Party, one-third via the ALP, and
one-third directly to the AEC. By 2019, the vast majority of applications
(almost three quarters of all applications) came directly to the AEC. While the
Liberal Party remains the largest party source for PVAs, it now constitutes a
declining proportion of total applications, down from around 30 per cent of all
applications in 2010 to around 15 per cent in 2019 (Figure 14 below).
Political parties have resisted any diminution of their
involvement in the postal voting process,[142]
however the additional time involved in PVAs being sent to parties and then
being forwarded to the AEC has meant that a number of PVAs have not been
received in time for postal votes to be sent to voters.[143]
Postal vote campaigns are also expensive for parties to run compared to other
forms of campaigning, with parties reporting that the postal costs went up 40
per cent between 2013 and 2017.[144]
As fewer voters apply for postal votes through parties, it is possible that
parties may in time decide that the benefit of running these campaigns is no
longer justifiable from a cost perspective.
Figure 14: Source of postal vote applications, federal elections
2010–
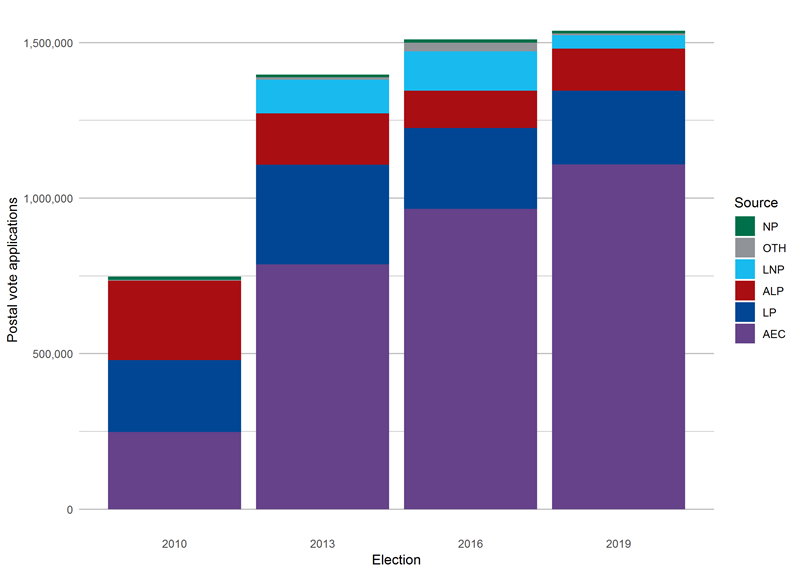
Note: AEC includes online and paper postal vote applications
plus general postal voters; not all postal vote applications result in a postal
vote—according to the AEC
around 10 per cent of the people who applied for a postal vote ended up voting
in person.
Source: Compiled by the Parliamentary Library from AEC data
Electoral
participation
The story of electoral participation in recent federal
elections is a distinctly positive one; however it is concealed to an extent by
the complexity of the data. Turnout—how many people voted—and formality—how
many people voted correctly—are the main indicators of participation.
Turnout
Turnout in Australian elections is traditionally calculated
as the total number of votes (formal and informal) as a proportion of the
enrolled population. The turnout for the 2019 federal election was 91.9 per
cent, which is a slight improvement on the 2016 rate but below the rate for
2010 and 2013.
The introduction of direct enrolment and online enrolment in
2012, however, has significantly increased the proportion of the population
enrolled going into the 2019 election. The enrolment rate of 96.8 per cent for
the 2019 federal election was hailed by the AEC as the ‘best electoral roll in
history’.[145]
So, although the turnout rate for 2019 was lower than that of 2013, the
underlying enrolment rate was significantly higher.
Table 11: Enrolment and turnout rates, federal elections 2010–
| Election |
Votes |
Eligible
population |
Enrolled
population |
Enrolment rate |
Turnout |
VEP turnout(a) |
| 2010 |
13 131 667 |
15 499 743 |
14 088 260 |
90.90 |
93.21 |
84.72 |
| 2013 |
13 726 070 |
15 925 415 |
14 712 799 |
92.40 |
93.29 |
86.19 |
| 2016 |
14 262 016 |
16 493 096 |
15 676 659 |
95.00 |
90.98 |
86.47 |
| 2019 |
15 088 616 |
16 960 337 |
16 424 248 |
96.80 |
91.87 |
88.96 |
(a) Turnout as a proportion of the voting eligible population
(VEP)
Source: Compiled by the Parliamentary Library from AEC election
results data.
The two factors of enrolment and turnout can be combined by
considering turnout as a proportion of the eligible population (those who have
enrolled and those who are eligible to enrol but have not yet done so) to get a
more complete view of participation. This is referred to as ‘VEP (Voting
Eligible Population) turnout’.
When examined in terms of VEP turnout (Table 11, above), electoral participation has been steadily increasing since 2010 (the earliest
election for which the AEC publishes the estimated eligible population). Even
the 2016 federal election, which had the lowest turnout since the introduction
of compulsory voting, showed a slight increase in VEP turnout compared to the
previous elections due to enrolment rate increases.
The increase in VEP turnout shows that an increasing number
of Australians are participating in federal elections over time (Figure 15 below). A similar observation about increasing enrolment and decreasing
enrolled turnout has been made by the Victorian Electoral Commission in its
submission to the Victorian Parliament’s Electoral Matters Committee’s inquiry
into the 2018 Victorian state election.[146]
Figure 15: Enrolment and turnout
rates, federal elections 2010–
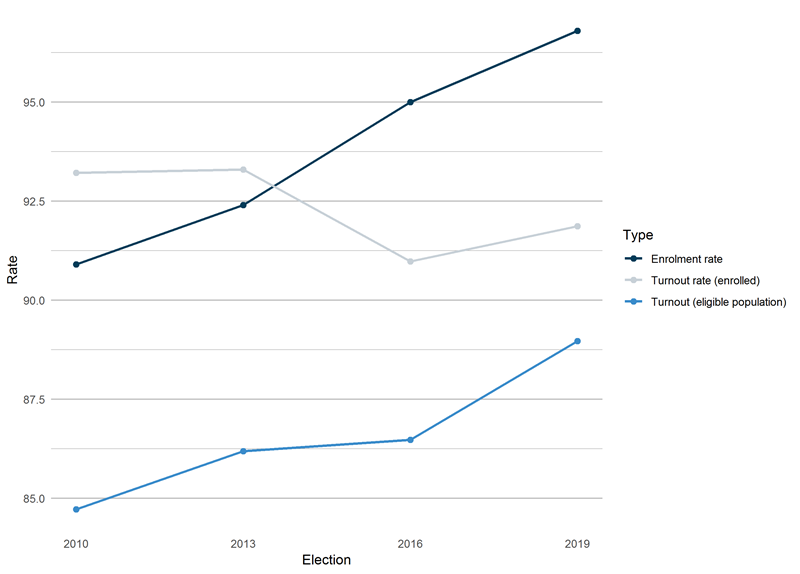
Source: Compiled by the Parliamentary Library from AEC election
results data.
Despite what is generally a good news story for participation,
enrolment rates differ markedly between jurisdictions, with the NT having
historically low enrolment rates. For the 2019 federal election, the NT VEP
turnout of 65.3 per cent means that roughly one-third of NT residents who
potentially could have voted in the election did not do so (Table 12 below). When the informality rate is factored in, only 62.2 per cent of the NT’s eligible
population cast a vote that could be counted. Low levels of participation has
also been observed in recent NT territory-level elections, with the electorate
of Arnhem recording a turnout of less than 50 per cent at the 2016 NT election.[147]|
Table 12: Informality, enrolment and turnout rates by
state, 2019 federal election
| State |
Informal rate |
Enrolment rate |
Turnout |
VEP turnout |
| NSW |
7.01 |
98.30 |
92.09 |
90.48 |
| VIC |
4.66 |
96.70 |
92.60 |
89.56 |
| QLD |
4.95 |
95.50 |
91.22 |
87.12 |
| WA |
5.44 |
96.00 |
90.08 |
86.47 |
| SA |
4.81 |
97.00 |
93.06 |
90.31 |
| TAS |
4.39 |
97.30 |
94.27 |
91.69 |
| ACT |
3.49 |
99.20 |
93.13 |
92.35 |
| NT |
4.69 |
83.80 |
77.95 |
65.30 |
Source: Compiled by the Parliamentary Library from AEC election
results data.
Informality
Of the states and territories, NSW had the highest
informality rate (the proportion of votes that could not be counted because
they were filled in incorrectly or not at all) for House of Representative
votes, with eight of the ten top divisions for informality located in NSW. More
generally, however, the divisions that had informality rates of 10 per cent or
higher were outliers (Figure 16 below).
Figure 16: Distribution of divisional
informality rate, 2019 federal election
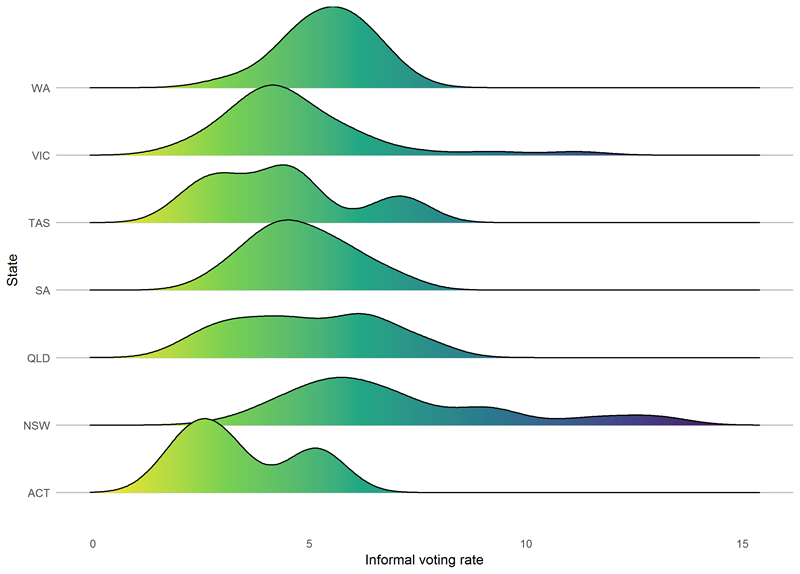
Note: This chart shows what how many of the divisions in each
state swung had what informality rate. NT has too few electorates for a
distribution to be calculated.
Source: Compiled by the Parliamentary Library from AEC election
results data.
The majority of the high informality divisions in NSW were
in Western Sydney, centred around Fowler, Blaxland and Watson. Mallee in
Victoria and Lyne in NSW, both regional divisions that returned Nationals
members, were notable in having the largest increase in informality since the
2016 federal election.
In its analysis of informal voting at the 2016 federal
election the AEC discussed possible causes of informal voting:
– Higher levels of informality are likely to be associated
with higher levels of social exclusion or relative disadvantage.
– A change in the number of candidates between elections is a
significant predictor of changes in informal voting.
– Voter confusion about the differences between state and
federal electoral systems may be contributing to some categories of informal
ballots (particularly for HoR ballots with incomplete numbering or where ticks
and crosses have been used as the first preference).
– As some informal votes are cast intentionally rather than
representing an error on the part of the voter, voters’ attitudes to and
opinions of the electoral system or politics in general will also likely
influence informality.[148]
In respect of these possible causes, the 2019 NSW state
election (which uses optional preferential voting) was held only two months
before the federal election—timing which may have contributed to the informal
voting level in NSW at the federal election. Additionally, the number of
nominations in WA also increased substantially, from 86 in 2016 to 132 in 2019
for the same number of seats.
There was also considerable overlap between the seats across
the country with the highest levels of informality in 2016 and those in 2019,
suggesting that the underlying causes of informality did not change
substantially from one election to the other.
Figure 17: Informality rate in Greater Sydney divisions
(NSW), 2019 federal election
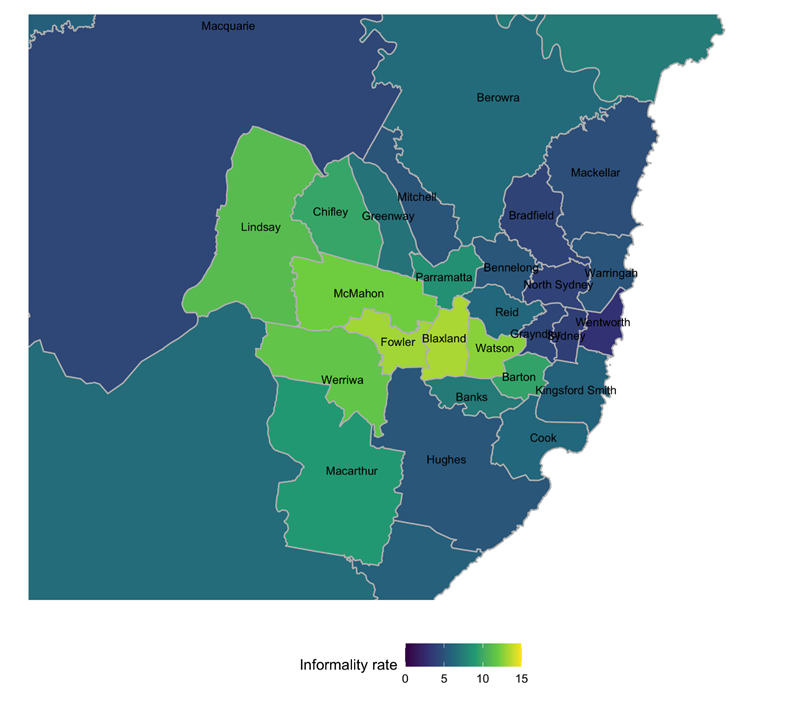
Source: Compiled by the Parliamentary Library from AEC election
results data.
Gender
Of the 458 candidates who nominated for the
Senate, 38 per cent were women (compared to 36 per cent in 2016). In the House
of Representatives 32 per cent of the 1,056 candidates were women (compared to
31 per cent in 2016). The candidate gender split of each of the larger parties
in the House of Representatives and the Senate is set out in Table 13 below (the Liberal, Nationals, and Country Liberal parties
are represented together as the Coalition).
Table 13: Candidate gender by
party, 2019 federal election
| House of Representatives |
Male |
Female |
Unspecified |
Male
(%) |
Female
(%) |
Unspecified
(%) |
| Coalition |
116 |
46 |
0 |
71.6 |
28.4 |
0.0 |
| Australian Labor Party |
85 |
66 |
0 |
56.3 |
43.7 |
0.0 |
| The Greens |
88 |
62 |
1 |
58.3 |
41.1 |
0.7 |
| United Australia Party |
123 |
28 |
0 |
81.5 |
18.5 |
0.0 |
| Pauline Hanson’s One Nation |
40 |
19 |
0 |
67.8 |
32.2 |
0.0 |
| FRASER ANNING’S CNP |
40 |
8 |
0 |
83.3 |
16.7 |
0.0 |
| Derryn Hinch’s Justice Party |
4 |
4 |
0 |
50.0 |
50.0 |
0.0 |
| Katter's Australian Party (KAP) |
6 |
1 |
0 |
85.7 |
14.3 |
0.0 |
| Centre Alliance |
0 |
3 |
0 |
0.0 |
100.0 |
0.0 |
| Others |
212 |
104 |
0 |
67.1 |
32.9 |
0.0 |
| Total |
714 |
341 |
1 |
67.6 |
32.3 |
0.1 |
| Senate |
|
|
|
|
|
|
| Australian Labor Party |
17 |
21 |
0 |
44.7 |
55.3 |
0.0 |
| Coalition |
21 |
17 |
0 |
55.3 |
44.7 |
0.0 |
| The Greens |
6 |
29 |
0 |
17.1 |
82.9 |
0.0 |
| FRASER ANNING’S CNP |
18 |
4 |
0 |
81.8 |
18.2 |
0.0 |
| Pauline Hanson’s One Nation |
9 |
3 |
0 |
75.0 |
25.0 |
0.0 |
| Jacqui Lambie Network |
2 |
1 |
0 |
66.7 |
33.3 |
0.0 |
| Katter's Australian Party (KAP) |
2 |
1 |
0 |
66.7 |
33.3 |
0.0 |
| Centre Alliance |
1 |
1 |
0 |
50.0 |
50.0 |
0.0 |
| Derryn Hinch’s Justice Party |
1 |
1 |
0 |
50.0 |
50.0 |
0.0 |
| Others |
203 |
100 |
0 |
67.0 |
33.0 |
0.0 |
| Total |
280 |
178 |
0 |
61.1 |
38.9 |
0.0 |
Source: Compiled by the Parliamentary Library from AEC election
results data.
Conclusion
The main outcome of the 2019 federal election was to
essentially retain the status quo. The Government was (unexpectedly) returned
with a slightly improved position in the House of Representatives and without
control of the Senate, although with an easier path to the passage of
legislation through the upper house. The section 44 crisis that permeated the
previous parliamentary term appears to have had limited impact on the election
itself, with the requirement to complete candidate nomination forms presumably
having led to more thorough vetting of candidates.
The election is likely to be remembered for Labor’s failure
to win despite expectations arising from the opinion polls; the unprecedented
failure of these polls; and the campaign spend of Clive Palmer’s UAP. While the
true cause of the opinion polling failure will likely remain a mystery, it may
lead to a greater transparency in polling processes which could bring Australia
closer to the standards set by similar democracies such as the UK. The
formation of the Australian Polling Council is a positive step, however it
remains to be seen exactly what changes will occur in the Australian political
polling environment (and how quickly they will occur).
The reported $60 million campaign spend of the UAP has led
to calls for campaign expenditure caps in federal elections. The political
finance scheme at the federal level is much more lightly regulated than the current
schemes in almost all Australian states and territories, three of which (NSW,
SA, and the ACT) currently have political party campaign expenditure caps for
state and territory elections .[149]
The Government has not proposed any legislation to introduce caps; Leader of
the ALP Opposition Anthony Albanese has indicated that he would introduce expenditure
caps in the light of UAP spending in 2019. [150]
Appendix A: Parties
contesting the 2019 federal election
| Abbreviation |
Name |
| ABFA |
Australian Better Families |
| AFN |
Australia First Party |
| AJP |
Animal Justice Party |
| ALP |
Australian Labor Party |
| ASP |
Shooters, Fishers and Farmers |
| AUC |
Australian Christians |
| AUD |
Australian Democrats |
| AUP |
Australian Progressives |
| AWP |
Australian Workers Party |
| CDP |
Christian Democratic Party (Fred Nile
Group) |
| CEC |
Citizens Electoral Council |
| CLP |
Country Liberals (NT) |
| CPP |
Child Protection Party |
| DHJP |
Derryn Hinch's Justice Party |
| DLP |
Labour DLP |
| FACN |
FRASER ANNING'S CONSERVATIVE NATIONAL PARTY |
| FLUX |
VOTEFLUX.ORG | Upgrade Democracy! |
| FUT |
Science Party |
| GAP |
The Great Australian Party |
| GRN |
The Greens |
| IMO |
Involuntary Medication Objectors
(Vaccination/Fluoride) Party |
| IND |
Independent |
| KAP |
Katter's Australian Party (KAP) |
| LAOL |
Love Australia or Leave |
| LDP |
Liberal Democrats |
| LNP |
Liberal National Party of Queensland |
| LP |
Liberal |
| NCP |
Non-Custodial Parents Party (Equal
Parenting) |
| NP |
The Nationals |
| NP |
National Party |
| ON |
Pauline Hanson's One Nation |
| REAS |
Reason Australia |
| RUA |
Rise Up Australia Party |
| SAL |
Socialist Alliance |
| SEP |
Socialist Equality Party |
| SPP |
Sustainable Australia |
| UAP |
United Australia Party |
| VNS |
Victorian Socialists |
| WAP |
WESTERN AUSTRALIA PARTY |
| XEN |
Centre Alliance |
Source: AEC
Appendix B:
Section 44 disqualifications
| Disqualified name |
Party |
Date resigned |
Date disqualified |
Reason |
Electorate |
Replacement |
Replacement party |
Method of replacement |
Replacement date |
| Bob Day |
FF |
1/11/2016 |
5/04/2017 |
44 (v) |
SA |
Lucy Gichuhi |
LIB |
Recount |
19/04/2017 |
| Rodney Culleton |
PHON |
NA |
3/02/2017 |
44 (ii) |
WA |
Panagiotis Georgiou |
PHON |
Recount |
10/03/2017 |
| Scott Ludlam |
GRN |
14/07/2017 |
27/10/2017 |
44 (i) |
WA |
Jordon Steele-John |
GRN |
Recount |
10/11/2017 |
| Larissa Waters |
GRN |
18/07/2017 |
27/10/2017 |
44 (i) |
Qld |
Andrew Bartlett |
GRN |
Recount |
10/11/2017 |
| Barnaby Joyce |
NAT |
NA |
27/10/2017 |
44 (i) |
New England |
- |
- |
By-election |
2/12/2017 |
| Malcolm Roberts |
PHON |
NA |
27/10/2017 |
44 (i) |
Qld |
Fraser Anning |
KAP |
Recount |
10/11/2017 |
| Fiona Nash |
NAT |
NA |
27/10/2017 |
44 (i) |
NSW |
Jim Molan |
LIB |
Recount |
22/12/2017 |
| Stephen Parry |
LIB |
2/11/2017 |
8/12/2017 |
44 (i) |
Tas. |
Richard Colbeck |
LIB |
Recount |
9/02/2018 |
| John Alexander |
LIB |
11/11/2017 |
11/11/2017 |
44 (i) |
Bennelong |
- |
- |
By-election |
16/12/2017 |
| Jacqui Lambie |
JLN |
14/11/2017 |
8/12/2017 |
44 (i) |
Tas. |
Steve Martin |
NAT |
Recount |
9/02/2018 |
| Skye Kakoschke-Moore |
XEN |
22/11/2017 |
13/02/2018 |
44 (i) |
SA |
Tim Storer |
IND |
Recount |
16/02/2018 |
| David Feeney |
ALP |
1/02/2018 |
1/02/2018 |
44 (i) |
Batman |
Ged Kearney |
ALP |
By-election |
17/03/2017 |
| Katy Gallagher |
ALP |
NA |
9/05/2018 |
44 (i) |
ACT |
David Smith |
ALP |
Recount |
23/05/2018 |
| Justine Keay |
ALP |
10/05/2018 |
NA |
44 (i) |
Braddon |
- |
|
By-election |
28/07/2018 |
| Susan Lamb |
ALP |
10/05/2018 |
NA |
44 (i) |
Longman |
- |
|
By-election |
28/07/2018 |
| Josh Wilson |
ALP |
10/05/2018 |
NA |
44 (i) |
Fremantle |
- |
|
By-election |
28/07/2018 |
| Rebecca Sharkie |
XEN |
11/05/2018 |
NA |
44 (i) |
Mayo |
- |
|
By-election |
28/07/2018 |
Source: Compiled by the Parliamentary Library.
Appendix C: Final
opinion poll results prior to the 2019 federal election
| Source |
Date |
n |
Primary |
TPP |
| |
|
|
Coalition |
Greens |
Labor |
Liberal |
Nationals |
One Nation |
Others |
Coalition |
Labor |
| Essential |
14/05/2019 |
1 201 |
38.5 |
9.1 |
36.2 |
36.2 |
3.6 |
6.6 |
9.6 |
48.5 |
51.5 |
| Morgan Face |
14/05/2019 |
1 265 |
38.5 |
10 |
35.5 |
- |
- |
4 |
8.5 |
48 |
52 |
| Ipsos |
15/05/2019 |
1 842 |
39 |
13 |
33 |
- |
- |
4 |
8 |
49 |
51 |
| YouGov-Galaxy |
15/05/2019 |
1 004 |
39 |
9 |
37 |
- |
- |
3 |
9 |
49 |
51 |
| Newspoll |
17/05/2019 |
3 038 |
38 |
9 |
37 |
- |
- |
3 |
8 |
48.5 |
51.5 |
| Election Results |
18/05/2019 |
|
41.44 |
10.4 |
33.34 |
36.93 |
4.51 |
3.08 |
8.31 |
51.53 |
48.47 |
Source: Compiled by the Parliamentary Library from various
sources.
Appendix D: Public
election funding paid
Public election funding was paid for the 2019 federal
election at the rate of $2.75642 per first preference vote for parties and
candidates who received at least four per cent of the first preference vote.
Parties and candidates who qualified for public funding received an initial
payment of $10,080 and were permitted to submit an interim and/or final claim,
based on election spending, up to a maximum set by their per-vote amount. With
a small number of exceptions, parties and candidates successfully claimed
around the full amount to which they were entitled.
| Party / Candidate Name |
Votes |
Initial Payment
($) |
Interim ($) |
Final ($) |
Total ($) |
| Adam Blakester |
13 804 |
10 080.00 |
0.00 |
27 963.82 |
38 043.82 |
| Alex Dyson |
10 797 |
10 080.00 |
|
|
10 080.00 |
| Alice Thompson |
11 975 |
10 080.00 |
0.00 |
22 923.10 |
33 003.10 |
| Andrew Bock |
4 581 |
10 080.00 |
0.00 |
2 545.24 |
12 625.24 |
| Andrew Wilkie |
33 761 |
10 080.00 |
0.00 |
82 965.32 |
93 045.32 |
| Animal Justice Party |
4 393 |
10 080.00 |
0.00 |
2 027.11 |
12 107.11 |
| Arthur Chesterfield-Evans |
4 295 |
10 080.00 |
0.00 |
1 757.02 |
11 837.02 |
| Australia First Party (NSW) |
4 094 |
10 080.00 |
|
|
10 080.00 |
| Australian Greens |
415 894 |
10 080.00 |
1 079 317.67 |
56 806.19 |
1 146 203.86 |
| Australian Labor Party (ALP) |
8 954 603 |
10 080.00 |
23 440 130.69 |
1 233 829.89 |
24 684 040.58 |
| Centre Alliance |
43 849 |
10 080.00 |
0.00 |
110 767.84 |
120 847.84 |
| Christian Democratic Party (Fred Nile Group) |
28 252 |
10 080.00 |
0.00 |
67 782.51 |
77 862.51 |
| Country Liberals (Northern Territory) |
77 350 |
10 080.00 |
0.00 |
203 096.60 |
213 176.60 |
| Craig Brakey |
7 619 |
10 080.00 |
0.00 |
10 917.96 |
20 997.96 |
| Damien Cole |
5 131 |
10 080.00 |
0.00 |
4 061.00 |
14 141.00 |
| Derryn Hinch's Justice Party |
8 905 |
10 080.00 |
0.00 |
14 462.18 |
24 542.18 |
| Fiona Leviny |
5 240 |
10 080.00 |
0.00 |
4 361.44 |
14 441.44 |
| Grant Schultz |
7 585 |
10 080.00 |
0.00 |
10 824.26 |
20 904.26 |
| Hamish MacFarlane |
2 123 |
10 080.00 |
|
|
10 080.00 |
| Helen Haines |
32 664 |
10 080.00 |
0.00 |
79 941.98 |
90 021.98 |
| Huw Kingston |
6 068 |
10 080.00 |
0.00 |
6 643.41 |
16 723.41 |
| Innes Larkin |
5 165 |
10 080.00 |
0.00 |
4 154.74 |
14 234.74 |
| Jacqui Lambie Network |
31 383 |
10 080.00 |
41 909.65 |
2 885.77 |
54 875.42 |
| Jamie Christie |
7 683 |
10 080.00 |
0.00 |
11 094.35 |
21 174.35 |
| Jarrod Bingham |
8 363 |
10 080.00 |
0.00 |
7 764.47 |
17 844.47 |
| Jason Modica |
8 795 |
10 080.00 |
0.00 |
14 159.02 |
24 239.02 |
| Jeremy Miller |
5 169 |
10 080.00 |
|
|
10 080.00 |
| Julia Banks |
13 367 |
10 080.00 |
0.00 |
26 759.45 |
36 839.45 |
| Katter's Australian Party |
63 854 |
10 080.00 |
157 606.54 |
8 295.08 |
175 981.62 |
| Kerryn Phelps |
29 109 |
10 080.00 |
0.00 |
70 144.40 |
80 224.40 |
| Kevin Mack |
19 926 |
10 080.00 |
0.00 |
44 836.06 |
54 916.06 |
| Liberal Democratic Party |
22 598 |
10 080.00 |
0.00 |
52 200.00 |
62 280.00 |
| Liberal Party of Australia |
10 705 090 |
10 080.00 |
26 599 996.30 |
959 533.79 |
27 569 610.09 |
| Louise Stewart |
6 902 |
10 080.00 |
8 494.81 |
447.10 |
19 021.91 |
| Nathan Herbert |
5 473 |
10 080.00 |
0.00 |
5 003.59 |
15 083.59 |
| National Party of Australia - N.S.W. |
472 855 |
10 080.00 |
2 432 199.87 |
128 010.52 |
2 570 290.39 |
| National Party of Australia - Victoria |
138 715 |
10 080.00 |
610 663.54 |
700 674.39 |
1 321 417.93 |
| Oliver Yates |
8 890 |
10 080.00 |
0.00 |
14 420.84 |
24 500.84 |
| Pauline Hanson's One Nation |
1 077 825 |
10 080.00 |
1 883 207.10 |
947 479.35 |
2 840 766.45 |
| Queensland Greens |
571 036 |
10 080.00 |
1 485 510.46 |
78 184.76 |
1 573 775.22 |
| Ray Kingston |
8 621 |
10 080.00 |
0.00 |
13 679.48 |
23 759.48 |
| Reason Australia |
8 895 |
10 080.00 |
0.00 |
3 027.54 |
13 107.54 |
| Robert Oakeshott |
25 847 |
10 080.00 |
0.00 |
61 154.33 |
71 234.33 |
| Senate Group - Anthony Pesec and Gary Kent |
12 604 |
10 080.00 |
0.00 |
24 656.62 |
34 736.62 |
| Shooters, Fishers and Farmers Party |
30 513 |
10 080.00 |
70 313.13 |
3 700.69 |
84 093.82 |
| Simone Karandrews |
3 849 |
10 080.00 |
|
|
10 080.00 |
| Sue Fraser-Adams |
2 684 |
10 080.00 |
|
|
10 080.00 |
| The Australian Greens – Victoria |
833 005 |
10 080.00 |
2 171 397.69 |
114 284.09 |
2 295 761.78 |
| The Greens (WA) Inc |
333 747 |
10 080.00 |
864 240.40 |
45 486.34 |
919 806.74 |
| The Greens NSW |
805 028 |
10 080.00 |
0.00 |
2 118 372.89 |
2 128 452.89 |
| The National Party of Australia (WA) Inc |
18 673 |
10 080.00 |
0.00 |
41 382.79 |
51 462.79 |
| Tim Bohm |
4 062 |
10 080.00 |
0.00 |
1 114.87 |
11 194.87 |
| Timothy Jerome |
4 220 |
10 080.00 |
0.00 |
1 550.32 |
11 630.32 |
| United Australia Party |
235 988 |
10 080.00 |
0.00 |
640 302.92 |
650 382.92 |
| Van Tran |
5 306 |
10 080.00 |
0.00 |
4 543.34 |
14 623.34 |
| Victorian Socialists |
12 453 |
10 080.00 |
23 028.45 |
1 212.02 |
34 320.47 |
| Will Landers |
6 730 |
10 080.00 |
|
|
10 080.00 |
| Zali Steggall |
40 034 |
10 080.00 |
0.00 |
100 253.70 |
110 333.70 |
| Total |
|
584 640.00 |
60 868 016.30 |
8 194 446.49 |
69 647 102.79 |
Note: Votes in the above table include the total votes for each
individual party’s candidates where the party was a member of a group on the
Senate ballot paper, however maximum public funding amounts for Senate groups
are calculated on the basis of all of the votes for each of the candidates in
the group, and the respective parties make their own decision as to how much of
the total group funding each party receives. As such, in some cases the
received public funding equals more than the vote-based entitlement would
indicate.
Source: Parliamentary Library calculations based on AEC
election results.
[1]. C Knaus,
‘Scott
Ludlam resigns from Australian Senate after finding out he has New Zealand
citizenship’, The Guardian, 14 July 2017.
[2]. Prior to
this, in January 2017, the President of the Senate had notified the WA Governor
that Mr Culleton’s Senate seat was vacant as a result of Federal Court
bankruptcy findings against Mr Culleton in December 2016: S Parry (President of
the Senate), ‘Qualifications
of Senators’, Senate, Debates, 7 February 2017, p. 2.
[3]. Mr Day
had resigned from the Senate in November 2016: B Day, Senator
Bob Day resignation, media release, 1 November 2016.
[4]. Bob
Day’s replacement Lucy Gichuhi left Family First to join the Liberals; Malcolm
Roberts’ replacement Fraser Anning left One Nation to sit first as an
independent, then as a Katter’s Australian Party senator, and then once again
as an independent; Jacqui Lambie’s replacement Steve Martin left the Jacqui
Lambie Network to sit as a Nationals senator; and Skye Kakoschke-Moore’s
replacement, Tim Storer, left the Centre Alliance to sit as an independent.
[5]. K Hogan,
‘Statement by
Kevin Hogan’, Kevin Hogan MP website, accessed 25 June 2020.
[6]. Australian
Constitution, section 40. See also N Horne, ‘Hung
Parliament 2018 – continued’, Flagpost, Parliament Library blog, 6 November
2018.
[7]. J Banks,
‘Statements
on Indulgence: Member for Chisholm’, House of Representatives, Debates,
27 November 2018, pp. 11571–2.
[8]. P Karp
and G Hutchens, ‘Barnaby
Joyce quits as Australia's deputy prime minister and Nationals leader’, The
Guardian, 23 February 2018.
[9]. The
Liberal primary vote situation is complicated by the fact that it has run as a
combined party with the National Party in Queensland since 2010; S Barber, Federal
election results 1901-2016-Reissue #2, Research paper series, 2019–19,
Parliamentary Library, Canberra, 5 July 2018.
[10]. The
division of Denison was renamed to Clark in 2017.
[11]. M
Koslowski, ‘”School
fete on steroids” creates history’, The Age, 21 May 2019, p. 12.
[12]. Tony
Abbott was first elected to Warringah at a by-election on 26 May 1994, was
re-elected at the 1996 general election and went on to serve eight full terms.
He was Prime Minister from 18 August 2013 to 15 August 2015.
[13]. The AEC
does also calculate two-party preferred totals, which are counted to Labor or
the Coalition regardless of the TCP candidates in the contest, however unlike
TCP preferences does not indicate which candidates those preferences came from.
[14]. D Muller,
The
new Senate voting system and the 2016 election, Research paper series,
2017–18, Parliamentary Library, Canberra, 25 January 2018.
[15]. Senator
Bernardi, the sole senator for the Australian Conservatives, was not up for
election however dissolved his party prior to the election to sit in the Senate
as an independent.
[16]. Australia,
Senate, Journals,
39, 10 February 2020.
[17]. Section
13 of the Australian Constitution requires the election for Senate
vacancies within one year before the position becomes vacant. The terms for the
senators elected for short terms in 2016 expired on 1 July 2019.
[18]. L Tingle,
‘Election
date preferences are quickly exhausted’, Australian Financial Review,
17 November 2018, p. 47.
[19]. R
Ferguson and P Riordan, ‘Morrison
vows to avoid Howard slips’, The Australian, 3 April 2019, p. 18.
[20]. R Lundie,
‘So
when is the next election?’: Australian elections timetable as at 1 September
2016, Research Paper Series, 2016–17, Parliamentary Library, Canberra,
2016.
[21]. A
Remeikis, ‘Morrison
dismisses concerns over taxpayer-funded ads as election date delayed’, The
Guardian, 7 April 2019.
[22]. T Rogers
(Electoral Commissioner), Evidence
to Finance and Public Administration Legislation Committee Estimates hearing,
4 April 2019.
[23]. A Hawke,
‘Issue of writs
for election of members of the House of Representatives and of senators to
represent the Australian Capital Territory and the Northern Territory’, 11
April 2019.
[24]. The writ
is a direction to the Electoral Commissioner to hold an election and nominates
the dates when key events for the election must happen.
[25]. Commonwealth
Electoral Act (1918)
[26]. Australian
Electoral Commission (AEC), ‘AEC returns writs
for 2019 federal election’, AEC media release, 21 June 2019.
[27]. T Rogers
(Electoral Commissioner), Evidence
to Finance and Public Administration Legislation Committee Estimates hearing,
9 April 2019.
[28]. A
Workman, ‘Easter
Sunday election blackout’, The Australian, 10 April 2019, p. 2.
[29]. T Rogers,
Notification of
determination, 31 August 2017.
[30]. Redistribution
of Queensland in electoral divisions, March 2018.
[31]. Redistribution
of Victoria into electoral divisions, July 2018; T Rogers, Determination of
names and boundaries of federal electoral divisions in Victoria, 13
July 2018.
[32]. Redistribution
of the Australian Capital Territory into electoral divisions, July
2018; T Rogers, Determination
of names and boundaries of federal electoral divisions in the Australian
Capital Territory, 13 July 2018.
[33]. Redistribution
of South Australia into electoral divisions, July 2018; T Rogers, Determination of
names and boundaries of federal electoral divisions in South Australia,
20 July 2018.
[34]. Redistribution
of the Northern Territory into electoral divisions, February 2017; D
Cowdroy, Determination
of names and boundaries of federal electoral divisions in the Northern
Territory, 7 February 2017.
[35]. Redistribution
of Tasmania into electoral divisions, November 2017; D Cowdroy, Determination of
names and boundaries of federal electoral divisions in Tasmania, 14
November 2017.
[36]. AEC, National
seat status.
[37]. See, for
example, R Viellaris, D Atkins, F Whiting, D Houghton, S Wardill and L
Hunder-Nolan, ‘The
verdict’, Courier Mail, 18 May 2019, p. 56.
[38]. P Durkin,
‘Vic
Libs brace for backlash’, AFR Weekend, 18 May 2019, p. 9; M Ludlow,
‘Labor
hopes for swag of Qld seats fade’, AFR Weekend, 18 May 2019, p. 13.
[39]. P Coorey,
‘Larger
than life: Hawke’s final gift to the Labor party’, AFR Weekend, 18
May 2019, p. 6.
[40]. M Ludlow,
‘Unity
the core message of Labor’s launch’, Australian Financial Review, 6
May 2019, p. 5.
[41]. T
Bramston, ‘Forget
the party: it’s all about me’, The Australian, 14 May 2019, p. 4.
[42]. S Maiden,
‘Have
promise, will travel: the true cost of election jetsetting’, The New
Daily, 5 May 2019; it is not clear from the report whether the agreement
applied to all parties or only the major parties
[43]. M Koziol
and E Bagshaw, ‘Politicians
charged taxpayers millions for election travel’, Sun Herald, 1
August 2019, p. 1.
[44]. M
Grattan, ‘View
from the hill: budget tax-upmanship as we head towards polling day’, The
Conversation, 2 April 2019.
[45]. The
Budget was not able to be passed through Parliament prior to the election and a
supply bill was passed as an interim measure.
[46]. S Morrison,
‘It’s
a choice between jobs and strong economy or higher taxes’, Courier Mail,
12 April 2019, p. 29.
[47]. B
Shorten, ‘ALP
is the “fair go” team’, Courier Mail, 18 May 2019, p. 54.
[48]. The
negative gearing policy had been taken to the 2016 election and the franking
credits policy was introduced in March 2018. C Emerson and J Weatherill, Review
of Labor’s 2019 federal election campaign, ALP. November 2019
[49]. G
Hutchins, L Scarr, A Hennessy and P Wearne, ‘Election
issues by the dozen’, West Australian, 18 May 2019, p. 86.
[50]. B
Shorten, ‘ALP
is the “fair go” team’, Courier Mail, 18 May 2019, p. 54.
[51]. M McKenna
and J Owens, ‘Adani
is hurting us in rural Queensland, Labor concedes’, The Australian,
17 April 2019, p. 1.
[52]. G Brown,
‘CFMEU
waning on Adani approval’, The Australian, 22 April 2019, p. 1.
[53]. P
Riordan, ‘Di
Natale dials up climate heat on ALP’, The Australian, 15 April 2019,
p. 4; R Wuth, ‘Adani
protest tour sets off’, Hobart Mercury, 17 April 2019, p. 12.
[54]. ‘Adani
protest rally signs off with island serenade’, Courier Mail, 6 May
2019, p. 12.
[55]. E
Bagshaw, ‘Brown’s
Green convoy hurt Labor: Di Natale’, The Age, 7 October 2019, p. 5.
[56]. G Brown,
‘Labor
climate policy “put the fear of God in people and alienated blue-collar base”’,
The Australian, 15 October 2019, p. 6.
[57]. Emerson
and Weatherill, op cit.
[58]. B Preiss
and R Harris, ‘Battle for Liberal hearts and minds in Menzies’, Sunday
Age, 15 March 2020, p. 25.
[59]. S
Hutchinson and K Loussikian, ‘Hold
that thought on preselection’, The Age, 19 March 2020, p. 4.
[60]. D Muller,
‘Online
political communication—does this post need to be authorised?’, FlagPost,
Parliamentary Library Blog, 23 April 2019.
[61]. N
Evershed and C Knaus, ‘Lies,
Trump enthusiasts and car parks: the Australian election campaign waged by
Facebook ads’, The Guardian, 1 May 2019.
[62]. T Rogers
(Electoral Commissioner, AEC), Evidence
to Joint Standing Committee on Electoral Matters Inquiry Conduct of the 2019
federal election and matters related thereto, 6 December 2019.
[63]. AEC, Submission
to Joint Standing Committee on Electoral Matters Inquiry Conduct of the 2019
federal election and matters related thereto, 2019.
[64]. Ibid, p.
34.
[65]. Ibid.
[66]. A Bogle,
‘Clive
Palmer’s ad deluge shows Google and Facebook need to step up transparency,
experts say’, ABC News, 22 May 2019.
[67]. A Johnson
(Acting Chief Legal Officer, AEC), Evidence
to Joint Standing Committee on Electoral Matters Inquiry Conduct of the 2019
federal election and matters related thereto, 6 December 2019.
[68]. M
Garlick, ‘Working
to safeguard elections in Australia’, Facebook Newsroom, blog, 4
April 2019.
[69]. N
Evershed and C Knaus, ‘Lies,
Trump enthusiasts and car parks: the Australian election campaign waged by
Facebook ads’, The Guardian, 1 May 2019.
[70]. K Murphy,
’”It
felt like a big tide”: how the death tax lie infected Australia’s election
campaign’, The Guardian, 8 June 2019.
[71]. S
Holderhead, ‘Grave
fears on death tax’, Daily Telegraph, 21 July 2018, p. 17.
[72]. J
Frydenberg (Treasurer), Death
taxes - you don't say, Bill!, media release, 24 January 2019.
[73]. K Murphy,
’”It
felt like a big tide”: how the death tax lie infected Australia’s election
campaign’, The Guardian, 8 June 2019.
[74]. Ibid.
[75]. K Cox, ‘Political
ads can lie if they want, Facebook confirms’, Ars Technica, 11
October 2019.
[76]. N Clegg, ‘Facebook,
elections and political speech’, Facebook Newsroom, 24 September
2019.
[77]. E Glazer,
‘Facebook
won’t limit political ads’, Weekend Australian, 11 January 2020, p.
28.
[78]. A Bogle,
‘Clive
Palmer’s ad deluge shows Google and Facebook need to step up transparency,
experts say’, ABC News, 22 May 2019.
[79]. C Pash, ‘Cash
splash: A record-breaking federal election ad spend approaches’, AdNews,
19 March 2019.
[80]. F Hunter
& N Gladstone, ‘As
voters tune out, ‘old fashioned’ ad campaigns are still in favour’, Sydney
Morning Herald, 30 April 2019.
[81]. JSCEM, Excluded:
the impact of section 44 on Australian democracy, Canberra, May 2018,
p. 60.
[82]. Electoral
Legislation Amendment (Modernisation and Other Measures) Act 2019
[83]. P Karp, ‘Electoral
commission accused of failing to investigate Palmer candidates’, The
Guardian, 2 May 2019.
[84]. M
Dreyfus, ‘Not
“going after” Josh’, Australian Jewish News, 15 December 2017, p.
15.
[85]. Alley
v Gillespie [2018]
HCA 11.
[86]. Australia,
Parliament, Court
of Disputed Returns —Election petitions—Michael Robert Staindl v. Joshua
Anthony Frydenberg in respect of the election of a member for the House of
Representatives for the Division of Kooyong, Parl. Paper, 1 August
2019.
[87]. ‘Frydenberg
defended’, Australian Jewish News, 20 September 2019, p. 7; R
Baxendale, ‘Bid
to save Treasurer all about seats: challenger’, The Australian, 20
August 2019, p. 7.
[88]. Staindl v
Frydenberg [2020]
FCAFC 41.
[89]. Australia,
Parliament, Court
of Disputed Returns —Election petitions—Oliver Tennant Yates v. Joshua Anthony
Frydenberg in respect of the election of a member for the House of
Representatives for the Division of Kooyong, Parl. Paper, 1 August
2019; Australia, Parliament,
Court of Disputed Returns —Election petitions—Naomi Leslie Hall v. Gladys Liu
in respect of the election of a member for the House of Representatives for the
Division of Chisholm, Parl. Paper, 1 August 2019.
[90]. Australia,
Parliament, Court
of Disputed Returns —Election petitions—Copy of the order of the High Court of
Australia remitting the election petitions: Oliver Tennant Yates v Joshua
Anthony Frydenberg & Anor, and Vanessa Claire Garbett (formerly Naomi
Leslie Hall) v Gladys Liu & Anor, Parl. Paper, 19 September 2019.
[91]. P Karp, ‘Josh
Frydenberg and Gladys Liu election challenges should be thrown out, AEC says’,
The Guardian, 8 October 2019.
[92]. Garbett v
Liu [2019]
FCAFC 241.
[93]. Garbett v
Liu (No 2) [2020]
FCAFC 14.
[94]. Palmer
v Australian Electoral Commission [2019] HCA 24
[95]. Ibid.
[96]. YouGov
acquired Galaxy Research in late 2017 and discontinued its own political
polling series.
[97]. D Muller,
Double,
double toil and trouble: the 2016 federal election, Research Paper
Series, 2016–17, Parliamentary Library, Canberra, 2017, p. 11.
[98]. Ibid.
[99]. K Bonham,
‘The
miracle is over: the 2019 Australia federal election poll fail’, Dr Kevin
Bonham’s blog, 21 May 2019.
[100]. R Tiffen,
‘How
the polls mapped a road to Liberal Victory’, Canberra Times, 14
September 2019, p. 29.
[101]. B Schmidt,
‘The
mathematics does not lie: why polling got the Australian election wrong’, The
Guardian, 20 May 2019; M Koziol, ‘Pollster
trashed out-of-step research’, Sunday Age, 9 June 2019, p. 6.
[102]. N
Bonyhady, ‘Calls
for transparency, national standards after polls miss result’, Sydney
Morning Herald, 24 May 2019, p. 4.
[103]. P Lewis, ‘As
pollsters, we are rightly in the firing line after the Australian election.
What happened?’, The Guardian, 21 May 2019; M Goot, ‘Did
late deciders confound the polls?’ Inside Story, 19 September 2019.
[104]. Lewis, op.
cit.
[105]. RP Scully,
‘How
did pollsters get the Australian election results so wrong?’, New
Scientist, 20 May 2019.
[106]. AMSRO, ‘Inquiry into the
performance of the opinion polls at the 2019 federal election’, AMSRO
website.
[107]. W Bowe, ‘Essential
Research leadership polling’, The Poll Bludger, 2 July 2019.
[108]. T Maguire,
‘We’re
pressing pause on our political polling’, Sydney Morning Herald, 24
May 2019, p. 22.
[109]. YouGov, YouGov
supports establishing Australian Polling Council, YouGov website, 19
September 2019.
[110]. AMSRO, op
cit.
[111]. AMSRO, Discussion
paper: Disclosure standards for election and political polling in Australia,
Inquiry into the performance of the opinion polls at the 2019 Australian
federal election, May 2020.
[112]. M Goot, ‘Who
controls opinion polling in Australia, what else do we need to know about the
polls, and why it matters’, Inside Story, 15 May 2019.
[113]. K Bonham,
‘Field
guide to opinion pollsters: 46th Parliament edition’, Kevin Bonham’s
Blog, 25 December 2019.
[114]. Ibid.
[115]. A
Beaumont, ‘Newspoll
probably wrong since Morrison became PM; polling has been less accurate at
recent elections’, The Conversation, 23 May 2019.
[116]. A
Beaumont, ‘Newspoll
probably wrong since Morrison became PM; polling has been less accurate at
recent elections’, The Conversation, 23 May 2019.
[117]. YouGov, op
cit.
[118]. YouGov, YouGov,
Essential and UComms to form Australian Polling Council, media release,
21 April 2020.
[119]. AEC, ‘Transparency
Register’.
[120]. AEC, 2019
federal election: election funding payments finalised, media release,
12 December 2019.
[121]. R Denniss,
‘The
maw of averages’, The Saturday Paper, 6 July 2019, p. 7.
[122]. K Murphy, ‘Clive
Palmer outspends McDonald’s, Toyota and Coles to advertise his political party’,
The Guardian, 16 August 2019.
[123]. A Tillett,
‘GetUp
to go easy on Labor's pro-coal MPs’, Australian Financial Review, 17
October 2019, p. 7.
[124]. K
Loussikian and S Hutchinson, ‘Abbott
falls on his sword for Liberals’, Sydney Morning Herald, 29 November
2019, p. 2.
[125]. S Maiden, ‘A
$31.8 million election bill leaves Labor in the red’, The New Daily,
6 October 2019.
[126]. P Karp, ‘Clive
Palmer $60m election spend shows need for cap, advocates say’, The
Guardian, 23 September 2019.
[127]. S Maiden,
‘$65
million and counting, Clive Palmer labels Labor a sore loser on election spend’,
The New Daily, 20 October 2019.
[128]. ‘Clive
Palmer outspends McDonald’s, Toyota and Coles to advertise his political
party’, op cit.
[129]. Ibid.
[130]. AEC, 2019
Electoral Pocketbook, 2020.
[131]. Pre-poll
ordinary votes are early votes cast in person by a voter at a pre-poll voting
centre in their own electorate. Pre-poll declaration votes are early votes that
are cast at a polling place outside the voters’ home electorate.
[132]. Joint
Standing Committee on Electoral Matters, Report
on the conduct of the 2016 federal election and matters related thereto,
Canberra, November 2018.
[133]. P Karp, ‘Calls
to cut pre-poll voting amid claims it is eroding “integrity” of elections’,
The Guardian, 3 October 2019.
[134]. Section
200D of the Commonwealth Electoral Act 1918 specifies that early voting
commences five days after the close of nominations, so the length of the early
voting period is dictated by the date of polling day relative to the date of
the close of nominations.
[135]. Almost 14
per cent of the pre-poll voters in 2019 voted in the first week, which was
higher than the average for 2010 to 2019 of 10.5 per cent in the first week,
however the first week of early voting was one day longer than previous
elections, which may account for this difference.
[136]. R Smith, I
Brightwell, R Buckland, M Drum, J Harbord, A McIver, S Mills, C Morgan, M
Radcliffe and R Wen, Implications
of changes to voting channels in Australia, Electoral Regulation
Research Network, December 2018, p. 68.
[137]. AEC, Informal
voting: 2016 House of Representatives elections, 2016.
[138]. On average
the informal voting level for pre-poll votes was around 1 percentage point
lower than for election-day votes and in only seven divisions, most of which
had a fairly low level of informality, was the informal voting rate for
pre-poll votes higher than for election-day votes.
[139]. Not all
postal vote applications will result in a postal vote being cast as voters may
apply for a postal vote but may actually cast their vote by another method.
[140]. H
Davidson, ‘Political
parties’ postal vote mailouts spark concerns voters could be misled’, The
Guardian, 17 April 2019.
[141]. In each of
these cases the actual postal vote is sent directly to the elector by the
AEC—it is only the application form that may be mediated by political parties.
[142]. N Kelly, Directions
in Australian electoral reform, ANU E Press, Canberra, 2012.
[143]. AEC, Submission
to the Joint Standing Committee on Electoral Matters, op cit., p. 17.
[144]. R Smith et
al , Implications
of changes to voting channels in Australia, op. cit.
[145]. AEC, ‘The best
electoral roll in history’, AEC media release, 23 April 2019.
[146]. Victorian
Electoral Commission, ‘Submission
to the Electoral Matters Committee’, EMC Submission No 92, 30 August 2019.
[147]. ‘Voter
apathy rife in the NT’, Northern Territory News, 22 August 2019, p.
7.
[148]. AEC, Informal
voting: 2016 House of Representatives elections, 2016, p. 4; at the
time of publication the AEC had not released similar analysis for the 2019
federal election.
[149]. Queensland is
also considering implementing expenditure caps for state elections. D Muller, ‘Election
funding and disclosure in Australian states and territories: a quick guide’,
Research paper series, 2018–19, Parliamentary Library, Canberra, 28
November 2018; S Parnell, ‘Labor’s
$1m election limit for unions, GetUp’, The Australian, 30 October
2019, p. 8.
[150].M Wray, ‘Palmer
cash not welcome’, Courier Mail, 24 February 2020, p. 10.
For copyright reasons some linked items are only available to members of Parliament.
© Commonwealth of Australia

Creative Commons
With the exception of the Commonwealth Coat of Arms, and to the extent that copyright subsists in a third party, this publication, its logo and front page design are licensed under a Creative Commons Attribution-NonCommercial-NoDerivs 3.0 Australia licence.
In essence, you are free to copy and communicate this work in its current form for all non-commercial purposes, as long as you attribute the work to the author and abide by the other licence terms. The work cannot be adapted or modified in any way. Content from this publication should be attributed in the following way: Author(s), Title of publication, Series Name and No, Publisher, Date.
To the extent that copyright subsists in third party quotes it remains with the original owner and permission may be required to reuse the material.
Inquiries regarding the licence and any use of the publication are welcome to webmanager@aph.gov.au.
This work has been prepared to support the work of the Australian Parliament using information available at the time of production. The views expressed do not reflect an official position of the Parliamentary Library, nor do they constitute professional legal opinion.
Any concerns or complaints should be directed to the Parliamentary Librarian. Parliamentary Library staff are available to discuss the contents of publications with Senators and Members and their staff. To access this service, clients may contact the author or the Library‘s Central Entry Point for referral.