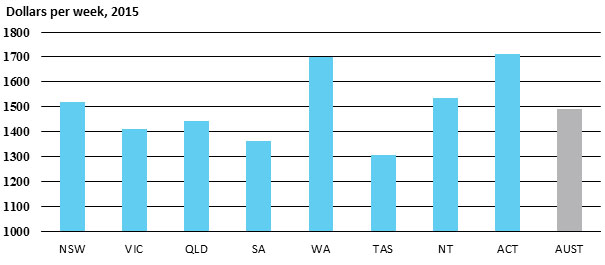
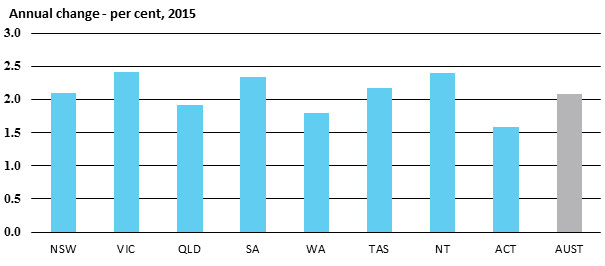
2.1 Average weekly ordinary time earnings
| |
2011 |
2012 |
2013 |
2014 |
2015 |
| AWOTE (a) (b) – $ per week |
|
|
|
|
|
| New South Wales |
1 322.3 |
1 377.1 |
1 414.5 |
1 475.7 |
1 519.7 |
| Victoria |
1 273.8 |
1 314.3 |
1 363.8 |
1 388.4 |
1 410.7 |
| Queensland |
1 287.2 |
1 346.3 |
1 422.8 |
1 447.9 |
1 443.8 |
| South Australia |
1 202.7 |
1 253.1 |
1 300.6 |
1 352.8 |
1 362.1 |
| Western Australia |
1 499.0 |
1 553.7 |
1 632.4 |
1 657.2 |
1 700.0 |
| Tasmania |
1 162.9 |
1 211.8 |
1 267.3 |
1 256.8 |
1 303.9 |
| Northern Territory |
1 334.1 |
1 413.0 |
1 449.1 |
1 435.6 |
1 533.3 |
| Australian Capital Territory |
1 521.6 |
1 619.6 |
1 687.0 |
1 682.8 |
1 711.3 |
| Australia |
1 317.4 |
1 372.6 |
1 429.0 |
1 465.6 |
1 491.8 |
| |
|
|
|
|
|
|
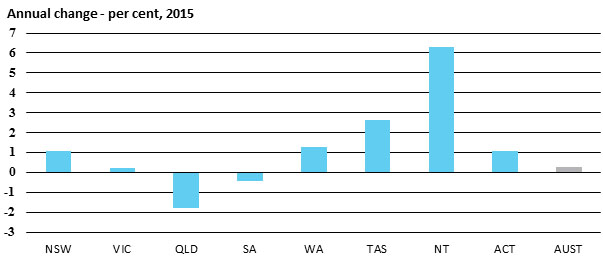
Annual change – per cent
|
|
|
|
|
|
| New South Wales |
3.7 |
4.1 |
2.7 |
4.3 |
3.0 |
| Victoria |
3.4 |
3.2 |
3.8 |
1.8 |
1.6 |
| Queensland |
3.4 |
4.6 |
5.7 |
1.8 |
-0.3 |
| South Australia |
4.3 |
4.2 |
3.8 |
4.0 |
0.7 |
| Western Australia |
8.0 |
3.6 |
5.1 |
1.5 |
2.6 |
| Tasmania |
5.5 |
4.2 |
4.6 |
-0.8 |
3.7 |
| Northern Territory |
7.0 |
5.9 |
2.6 |
-0.9 |
6.8 |
| Australian Capital Territory |
3.9 |
6.4 |
4.2 |
-0.2 |
1.7 |
| Australia |
4.3 |
4.2 |
4.1 |
2.6 |
1.8 |
(a)
Annual average of bi-annual data.
(b) Average weekly ordinary time earnings for full-time adult employees.
Care should be taken when comparing average weekly earnings of states over time
due to compositional changes
Source: ABS, Average Weekly Earnings, Nov 2015, cat. no. 6302.0
2.2 Real average weekly ordinary
time earnings
| |
2011 |
2012 |
2013 |
2014 |
2015 |
| Real AWOTE (a) (b) – $ per week |
|
|
|
|
| New South Wales |
1 442.1 |
1 473.0 |
1 475.8 |
1 503.8 |
1 519.7 |
| Victoria |
1 388.2 |
1 409.3 |
1 427.4 |
1 419.5 |
1 422.9 |
| Queensland |
1 401.4 |
1 443.6 |
1 492.4 |
1 478.2 |
1 451.8 |
| South Australia |
1 311.7 |
1 343.7 |
1 365.5 |
1 386.0 |
1 379.9 |
| Western Australia |
1 635.7 |
1 665.6 |
1 705.7 |
1 685.2 |
1 706.3 |
| Tasmania |
1 268.0 |
1 306.1 |
1 341.3 |
1 302.5 |
1 336.9 |
| Northern Territory |
1 456.1 |
1 512.5 |
1 493.2 |
1 438.2 |
1 529.0 |
| Australian Capital Territory |
1 659.1 |
1 739.7 |
1 775.1 |
1 735.6 |
1 753.8 |
| Australia |
1 436.8 |
1 471.1 |
1 494.9 |
1 495.9 |
1 500.1 |
| |
|
|
|
|
|
| Annual change – per cent |
|
|
|
|
|
| New South Wales |
0.2 |
2.1 |
0.2 |
1.9 |
1.1 |
| Victoria |
0.0 |
1.5 |
1.3 |
-0.6 |
0.2 |
| Queensland |
0.2 |
3.0 |
3.4 |
-1.0 |
-1.8 |
| South Australia |
0.5 |
2.4 |
1.6 |
1.5 |
-0.4 |
| Western Australia |
5.1 |
1.8 |
2.4 |
-1.2 |
1.3 |
| Tasmania |
2.2 |
3.0 |
2.7 |
-2.9 |
2.6 |
| Northern Territory |
4.1 |
3.9 |
-1.3 |
-3.7 |
6.3 |
| Australian Capital Territory |
0.5 |
4.9 |
2.0 |
-2.2 |
1.0 |
| Australia |
1.0 |
2.4 |
1.6 |
0.1 |
0.3 |
(a) Annual average.
(b) Average weekly ordinary time earnings for full-time adult employees
expressed in average 2013–14 dollars; converted to real terms using the
Consumer Price Index.
Care should be taken when comparing average weekly earnings of states over time
due to compositional changes
Sources: ABS, Average Weekly Earnings, Nov 2015, cat. no. 6302.0; ABS, Consumer
Price Index, Dec 2015, cat. no. 6401.0
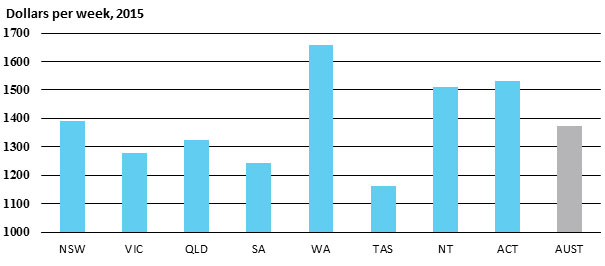
2.3 Male total average weekly earnings
| |
2011 |
2012 |
2013 |
2014 |
2015 |
| MTAWE (a) (b) – $ per week |
|
|
|
|
|
| New South Wales |
1 210.3 |
1 285.0 |
1 313.6 |
1 348.0 |
1 388.8 |
| Victoria |
1 192.9 |
1 222.1 |
1 281.3 |
1 277.1 |
1 278.1 |
| Queensland |
1 255.3 |
1 299.6 |
1 354.8 |
1 352.9 |
1 323.7 |
| South Australia |
1 121.0 |
1 177.8 |
1 227.7 |
1 280.4 |
1 241.0 |
| Western Australia |
1 515.1 |
1 585.0 |
1 641.4 |
1 662.0 |
1 657.8 |
| Tasmania |
1 025.9 |
1 081.4 |
1 115.3 |
1 132.1 |
1 163.2 |
| Northern Territory |
1 352.2 |
1 439.1 |
1 450.7 |
1 436.4 |
1 508.5 |
| Australian Capital Territory |
1 431.5 |
1 561.6 |
1 545.9 |
1 511.5 |
1 530.4 |
| Australia |
1 245.8 |
1 304.7 |
1 352.3 |
1 368.1 |
1 372.2 |
| |
|
|
|
|
|
| Annual change – per cent |
|
|
|
|
|
| New South Wales |
3.0 |
6.2 |
2.2 |
2.6 |
3.0 |
| Victoria |
2.4 |
2.4 |
4.8 |
-0.3 |
0.1 |
| Queensland |
2.9 |
3.5 |
4.3 |
-0.1 |
-2.2 |
| South Australia |
4.6 |
5.1 |
4.2 |
4.3 |
-3.1 |
| Western Australia |
9.7 |
4.6 |
3.6 |
1.3 |
-0.3 |
| Tasmania |
5.7 |
5.4 |
3.1 |
1.5 |
2.8 |
| Northern Territory |
11.2 |
6.4 |
0.8 |
-1.0 |
5.0 |
| Australian Capital Territory |
3.4 |
9.1 |
-1.0 |
-2.2 |
1.3 |
| Australia |
4.1 |
4.7 |
3.6 |
1.2 |
0.3 |
(a) Annual average of bi-annual data.
(b) Total average weekly earnings for all male employees.
Source: ABS, Average Weekly Earnings, November 2015, cat. no. 6302.0
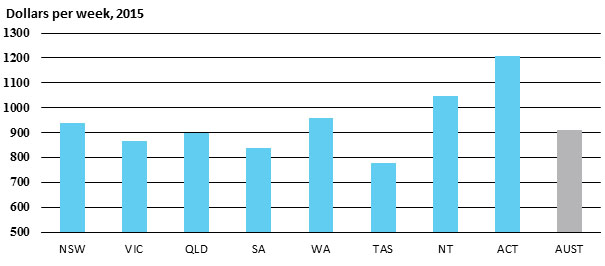
2.4 Female total average weekly earnings
| |
2011 |
2012 |
2013 |
2014 |
2015 |
| FTAWE (a) (b) – $ per week |
|
|
|
|
|
| New South Wales |
827.5 |
852.2 |
899.8 |
905.0 |
940.1 |
| Victoria |
778.5 |
801.5 |
823.8 |
843.0 |
867.3 |
| Queensland |
795.0 |
812.1 |
814.5 |
854.9 |
897.5 |
| South Australia |
721.9 |
757.4 |
793.2 |
856.6 |
836.5 |
| Western Australia |
792.7 |
840.8 |
903.4 |
943.6 |
959.7 |
| Tasmania |
716.0 |
754.9 |
765.2 |
771.4 |
778.1 |
| Northern Territory |
941.9 |
986.0 |
1 008.5 |
1 006.6 |
1 048.5 |
| Australian Capital Territory |
1 111.7 |
1 188.4 |
1 171.1 |
1 160.5 |
1 206.1 |
| Australia |
802.0 |
831.0 |
861.3 |
884.6 |
911.3 |
| |
|
|
|
|
|
| Annual change – per cent |
|
|
|
|
|
| New South Wales |
2.9 |
3.0 |
5.6 |
0.6 |
3.9 |
| Victoria |
3.6 |
3.0 |
2.8 |
2.3 |
2.9 |
| Queensland |
2.8 |
2.2 |
0.3 |
5.0 |
5.0 |
| South Australia |
1.7 |
4.9 |
4.7 |
8.0 |
-2.3 |
| Western Australia |
6.6 |
6.1 |
7.4 |
4.5 |
1.7 |
| Tasmania |
5.7 |
5.4 |
1.4 |
0.8 |
0.9 |
| Northern Territory |
5.8 |
4.7 |
2.3 |
-0.2 |
4.2 |
| Australian Capital Territory |
6.4 |
6.9 |
-1.5 |
-0.9 |
3.9 |
| Australia |
3.5 |
3.6 |
3.6 |
2.7 |
3.0 |
(a) Annual average of bi-annual data.
(b) Total average weekly earnings for all female employees.
Source: ABS, Average Weekly Earnings, November
2015, cat. no. 6302.0
2.5 Wage price index
| |
2011 |
2012 |
2013 |
2014 |
2015 |
| Wage price index (a) (b) |
|
|
|
|
|
| New South Wales |
110.5 |
114.0 |
116.8 |
119.6 |
122.1 |
| Victoria |
110.0 |
113.9 |
116.7 |
120.0 |
122.9 |
| Queensland |
111.0 |
114.4 |
117.3 |
120.3 |
122.6 |
| South Australia |
109.8 |
113.2 |
117.2 |
120.2 |
123.0 |
| Western Australia |
111.2 |
116.0 |
119.5 |
122.3 |
124.5 |
| Tasmania |
110.5 |
114.2 |
116.7 |
119.6 |
122.2 |
| Northern Territory |
111.5 |
115.1 |
117.8 |
121.1 |
124.0 |
| Australian Capital Territory |
110.1 |
114.8 |
117.5 |
119.5 |
121.4 |
| Australia |
110.5 |
114.3 |
117.2 |
120.2 |
122.7 |
| |
|
|
|
|
|
| Annual change – per cent |
|
|
|
|
|
| New South Wales |
3.8 |
3.2 |
2.5 |
2.4 |
2.1 |
| Victoria |
3.6 |
3.5 |
2.5 |
2.8 |
2.4 |
| Queensland |
3.6 |
3.1 |
2.5 |
2.6 |
1.9 |
| South Australia |
3.3 |
3.1 |
3.5 |
2.6 |
2.3 |
| Western Australia |
3.9 |
4.3 |
3.0 |
2.3 |
1.8 |
| Tasmania |
3.6 |
3.3 |
2.2 |
2.5 |
2.2 |
| Northern Territory |
4.2 |
3.2 |
2.3 |
2.8 |
2.4 |
| Australian Capital Territory |
2.9 |
4.3 |
2.4 |
1.7 |
1.6 |
| Australia |
3.7 |
3.4 |
2.5 |
2.6 |
2.1 |
(a) Index value at December
(b) Total hourly rate of pay index excluding bonuses, all sectors. Base:
2008–09 = 100.0.
Source: ABS, Wage Price Index, December 2015, cat. no. 6345.0
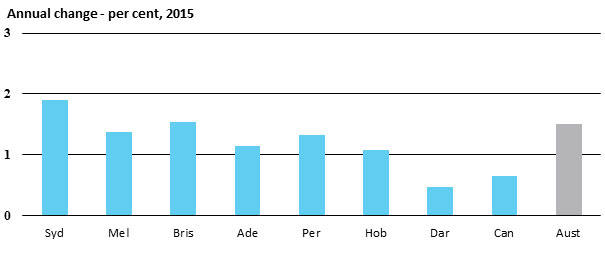
2.6 Consumer price index
| |
2011 |
2012 |
2013 |
2014 |
2015 |
| Consumer price index (a) |
|
|
|
|
|
| Sydney |
99.3 |
101.2 |
103.8 |
106.3 |
108.3 |
| Melbourne |
99.4 |
101.0 |
103.5 |
105.9 |
107.4 |
| Brisbane |
99.5 |
101.0 |
103.2 |
106.1 |
107.7 |
| Adelaide |
99.3 |
101.0 |
103.1 |
105.7 |
106.9 |
| Perth |
99.2 |
101.0 |
103.6 |
106.5 |
107.9 |
| Hobart |
99.3 |
100.5 |
102.3 |
104.5 |
105.6 |
| Darwin |
99.2 |
101.2 |
105.1 |
108.1 |
108.6 |
| Canberra |
99.3 |
100.8 |
102.9 |
105.0 |
105.7 |
Weighted average eight
capital cities |
99.3 |
101.0 |
103.5 |
106.1 |
107.7 |
| |
|
|
|
|
|
| Annual change – per cent (b) |
|
|
|
|
| Sydney |
3.5 |
2.0 |
2.5 |
2.4 |
1.9 |
| Melbourne |
3.4 |
1.6 |
2.5 |
2.4 |
1.4 |
| Brisbane |
3.2 |
1.5 |
2.2 |
2.7 |
1.5 |
| Adelaide |
3.8 |
1.7 |
2.1 |
2.5 |
1.1 |
| Perth |
2.8 |
1.8 |
2.6 |
2.8 |
1.3 |
| Hobart |
3.2 |
1.2 |
1.8 |
2.1 |
1.1 |
| Darwin |
2.8 |
2.0 |
3.9 |
2.9 |
0.5 |
| Canberra |
3.5 |
1.5 |
2.1 |
2.0 |
0.6 |
Weighted average eight
capital cities |
3.3 |
1.8 |
2.4 |
2.5 |
1.5 |
(a) Annual average of quarterly data;
base year for CPI is 2011-12
(b) Change in the annual averages of table above.
Source: ABS, Consumer Price Index, December 2015, cat. no. 6401.0
For copyright reasons some linked items are only available to members of Parliament.
© Commonwealth of Australia

Creative Commons
With the exception of the Commonwealth Coat of Arms, and to the extent that copyright subsists in a third party, this publication, its logo and front page design are licensed under a Creative Commons Attribution-NonCommercial-NoDerivs 3.0 Australia licence.
In essence, you are free to copy and communicate this work in its current form for all non-commercial purposes, as long as you attribute the work to the author and abide by the other licence terms. The work cannot be adapted or modified in any way. Content from this publication should be attributed in the following way: Author(s), Title of publication, Series Name and No, Publisher, Date.
To the extent that copyright subsists in third party quotes it remains with the original owner and permission may be required to reuse the material.
Inquiries regarding the licence and any use of the publication are welcome to webmanager@aph.gov.au.
This work has been prepared to support the work of the Australian Parliament using information available at the time of production. The views expressed do not reflect an official position of the Parliamentary Library, nor do they constitute professional legal opinion.
Any concerns or complaints should be directed to the Parliamentary Librarian. Parliamentary Library staff are available to discuss the contents of publications with Senators and Members and their staff. To access this service, clients may contact the author or the Library‘s Central Entry Point for referral.