3.1 Real gross
state product

|
|
2009-10
|
2010-11
|
2011-12
|
2012-13
|
2013-14
|
|
Gross
state product, chain volume measures (a) – $ million
|
|
|
|
|
New
South Wales
|
446 963
|
457 796
|
469 354
|
477 694
|
487 637
|
|
Victoria
|
316 606
|
322 361
|
331 213
|
338 168
|
343 819
|
|
Queensland
|
264 319
|
267 199
|
279 838
|
288 378
|
295 142
|
|
South
Australia
|
89 638
|
91 818
|
93 162
|
94 006
|
95 199
|
|
Western
Australia
|
205 959
|
215 701
|
232 162
|
242 841
|
256 188
|
|
Tasmania
|
24 476
|
24 526
|
24 671
|
24 610
|
24 905
|
|
Northern
Territory
|
17 977
|
18 316
|
19 086
|
19 913
|
21 205
|
|
Australian
Capital Territory
|
32 498
|
33 526
|
34 508
|
35 333
|
35 566
|
|
Australia
|
1 397 902
|
1 430 354
|
1 483 675
|
1 520 944
|
1 559 662
|
|
|
|
|
|
|
|
|
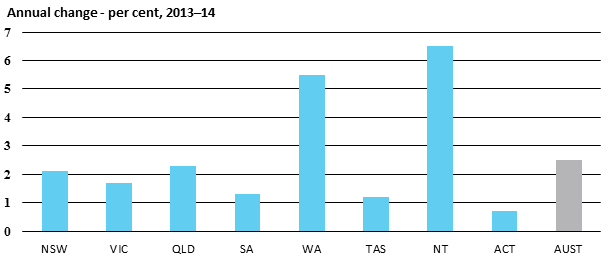
Annual
change – per cent
|
|
|
|
|
|
|
New
South Wales
|
1.8
|
2.4
|
2.5
|
1.8
|
2.1
|
|
Victoria
|
1.7
|
1.8
|
2.7
|
2.1
|
1.7
|
|
Queensland
|
1.4
|
1.1
|
4.7
|
3.1
|
2.3
|
|
South
Australia
|
1.1
|
2.4
|
1.5
|
0.9
|
1.3
|
|
Western
Australia
|
4.1
|
4.7
|
7.6
|
4.6
|
5.5
|
|
Tasmania
|
0.2
|
0.2
|
0.6
|
-0.2
|
1.2
|
|
Northern
Territory
|
1.0
|
1.9
|
4.2
|
4.3
|
6.5
|
|
Australian
Capital Territory
|
3.1
|
3.2
|
2.9
|
2.4
|
0.7
|
|
Australia
|
2.0
|
2.3
|
3.7
|
2.5
|
2.5
|
|
|
|
|
|
|
|
|
(a)
Reference year for chain volume measures is 2012–13.
|
|
|
|
|
Source:
ABS, Australian national
accounts: state accounts, cat. no. 5220.0, 2013–14
|
|
|
3.2 Real gross
state product per capita

|
|
2009-10
|
2010-11
|
2011-12
|
2012-13
|
2013-14
|
|
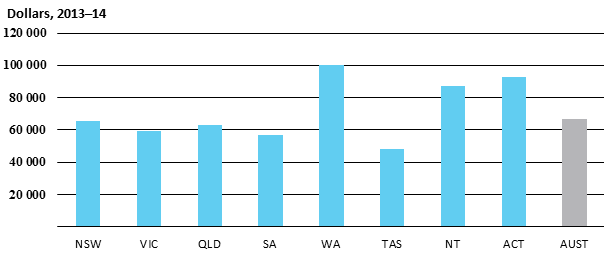
Gross
state product per capita, chain volume measures (a)
|
|
|
|
|
New
South Wales
|
62 939
|
63 761
|
64 635
|
64 932
|
65 320
|
|
Victoria
|
58 422
|
58 657
|
59 329
|
59 531
|
59 394
|
|
Queensland
|
60 520
|
60 222
|
61 930
|
62 570
|
62 954
|
|
South
Australia
|
55 381
|
56 244
|
56 566
|
56 555
|
56 761
|
|
Western
Australia
|
90 981
|
93 012
|
97 074
|
97 939
|
100 455
|
|
Tasmania
|
48 328
|
48 069
|
48 190
|
48 023
|
48 453
|
|
Northern
Territory
|
78 920
|
79 533
|
82 018
|
83 216
|
87 187
|
|
Australian
Capital Territory
|
90 813
|
91 893
|
92 987
|
93 492
|
92 615
|
|
Australia
|
63 940
|
64 519
|
65 891
|
66 366
|
66 907
|
|
|
|
|
|
|
|
|
Annual
change – per cent
|
|
|
|
|
|
|
New
South Wales
|
0.4
|
1.3
|
1.4
|
0.5
|
0.6
|
|
Victoria
|
-0.3
|
0.4
|
1.1
|
0.3
|
-0.2
|
|
Queensland
|
-0.7
|
-0.5
|
2.8
|
1.0
|
0.6
|
|
South
Australia
|
-0.2
|
1.6
|
0.6
|
0.0
|
0.4
|
|
Western
Australia
|
1.6
|
2.2
|
4.4
|
0.9
|
2.6
|
|
Tasmania
|
-0.7
|
-0.5
|
0.3
|
-0.3
|
0.9
|
|
Northern
Territory
|
-1.3
|
0.8
|
3.1
|
1.5
|
4.8
|
|
Australian
Capital Territory
|
1.2
|
1.2
|
1.2
|
0.5
|
-0.9
|
|
Australia
|
0.1
|
0.9
|
2.1
|
0.7
|
0.8
|
|
|
|
|
|
|
|
|
(a)
Reference year for chain volume measures is 2012–13.
|
|
|
|
|
Source:
ABS, Australian national
accounts: state accounts, cat. no. 5220.0, 2013–14.
|
|
|
3.3 Labour productivity

|
|
2009-10
|
2010-11
|
2011-12
|
2012-13
|
2013-14
|
|
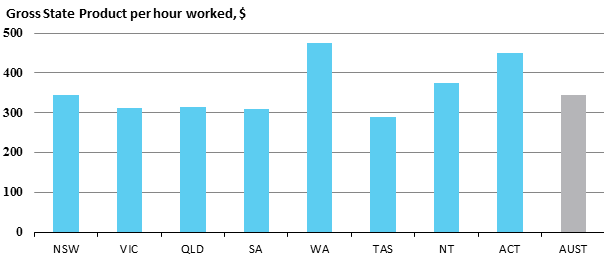
Gross
State Product per hour worked, $
|
|
|
|
|
|
New
South Wales
|
331.9
|
331.8
|
344.4
|
345.2
|
343.7
|
|
Victoria
|
301.7
|
295.3
|
311.9
|
317.9
|
311.4
|
|
Queensland
|
296.4
|
296.7
|
308.1
|
321.4
|
314.2
|
|
South
Australia
|
298.6
|
295.9
|
307.7
|
311.7
|
309.6
|
|
Western
Australia
|
439.3
|
438.4
|
454.0
|
462.9
|
475.2
|
|
Tasmania
|
278.8
|
274.3
|
287.6
|
292.8
|
289.5
|
|
Northern
Territory
|
355.8
|
353.2
|
366.6
|
372.3
|
374.0
|
|
Australian
Capital Territory
|
416.1
|
419.6
|
438.8
|
449.2
|
448.6
|
|
Australia
|
327.1
|
325.4
|
340.0
|
346.7
|
344.3
|
|
|
|
|
|
|
|
|
Annual
change – per cent
|
|
|
|
|
|
|
New
South Wales
|
2.2%
|
0.0%
|
3.8%
|
0.2%
|
-0.4%
|
|
Victoria
|
-0.8%
|
-2.1%
|
5.6%
|
1.9%
|
-2.1%
|
|
Queensland
|
1.9%
|
0.1%
|
3.9%
|
4.3%
|
-2.2%
|
|
South
Australia
|
2.6%
|
-0.9%
|
4.0%
|
1.3%
|
-0.7%
|
|
Western
Australia
|
6.6%
|
-0.2%
|
3.6%
|
2.0%
|
2.7%
|
|
Tasmania
|
4.2%
|
-1.6%
|
4.9%
|
1.8%
|
-1.2%
|
|
Northern
Territory
|
-1.6%
|
-0.7%
|
3.8%
|
1.6%
|
0.5%
|
|
Australian
Capital Territory
|
1.7%
|
0.8%
|
4.6%
|
2.4%
|
-0.1%
|
|
Australia
|
2.0%
|
-0.5%
|
4.5%
|
2.0%
|
-0.7%
|
|
|
|
|
|
|
|
|
(a)
Gross state product (chain volume measures) per hour worked, all sectors
(i.e. market and non-market sectors)
|
Source:
ABS, Australian
national accounts: state accounts, cat. no.
5220.0, 2014–15; ABS, Labour force,
detailed,
cat. no. 6291.0.55.001, August 2015
|
For copyright reasons some linked items are only available to members of Parliament.
© Commonwealth of Australia

Creative Commons
With the exception of the Commonwealth Coat of Arms, and to the extent that copyright subsists in a third party, this publication, its logo and front page design are licensed under a Creative Commons Attribution-NonCommercial-NoDerivs 3.0 Australia licence.
In essence, you are free to copy and communicate this work in its current form for all non-commercial purposes, as long as you attribute the work to the author and abide by the other licence terms. The work cannot be adapted or modified in any way. Content from this publication should be attributed in the following way: Author(s), Title of publication, Series Name and No, Publisher, Date.
To the extent that copyright subsists in third party quotes it remains with the original owner and permission may be required to reuse the material.
Inquiries regarding the licence and any use of the publication are welcome to webmanager@aph.gov.au.
This work has been prepared to support the work of the Australian Parliament using information available at the time of production. The views expressed do not reflect an official position of the Parliamentary Library, nor do they constitute professional legal opinion.
Any concerns or complaints should be directed to the Parliamentary Librarian. Parliamentary Library staff are available to discuss the contents of publications with Senators and Members and their staff. To access this service, clients may contact the author or the Library‘s Central Entry Point for referral.