| |
2008-09
|
2009-10
|
2010-11
|
2011-12
|
2012-13
|
| Value (a) – $ million |
|
|
|
|
|
| New South Wales |
52 744
|
52 287
|
50 667
|
53 813
|
53 290
|
| Victoria |
38 613
|
43 008
|
43 829
|
43 697
|
45 536
|
| Queensland |
36 541
|
34 727
|
27 944
|
28 447
|
30 025
|
| South Australia |
11 015
|
10 276
|
9 079
|
8 978
|
9 157
|
| Western Australia |
21 185
|
22 150
|
18 702
|
20 929
|
25 246
|
| Tasmania |
2 608
|
2 341
|
2 006
|
1 963
|
1 925
|
| Northern Territory |
1 474
|
1 356
|
1 090
|
1 238
|
1 403
|
| Australian Capital Territory |
3 220
|
3 101
|
2 825
|
2 802
|
3 009
|
| Australia |
167 398
|
169 245
|
156 142
|
161 867
|
169 591
|
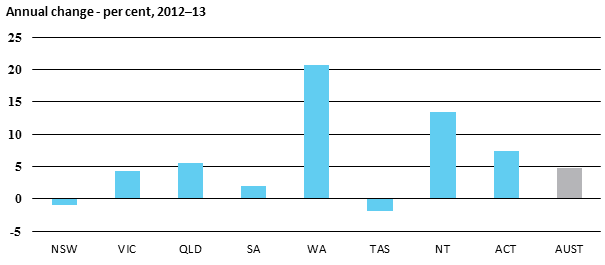
| Annual change – per cent |
|
|
|
|
| New South Wales |
2.1
|
-0.9
|
-3.1
|
6.2
|
-1.0
|
| Victoria |
-2.4
|
11.4
|
1.9
|
-0.3
|
4.2
|
| Queensland |
-6.1
|
-5.0
|
-19.5
|
1.8
|
5.5
|
| South Australia |
3.7
|
-6.7
|
-11.6
|
-1.1
|
2.0
|
| Western Australia |
-2.8
|
4.6
|
-15.6
|
11.9
|
20.6
|
| Tasmania |
-1.1
|
-10.2
|
-14.3
|
-2.2
|
-1.9
|
| Northern Territory |
17.8
|
-8.0
|
-19.6
|
13.6
|
13.4
|
| Australian Capital Territory |
19.4
|
-3.7
|
-8.9
|
-0.8
|
7.4
|
| Australia |
-1.0
|
1.1
|
-7.7
|
3.7
|
4.8
|
| |
|
|
|
|
|
(a) Lending commitments by all types of lenders for the construction and purchase of owner occupied dwellings,
these figures include refinancing across lending institution, but excludes alterations and additions. |
| Source: ABS, Housing Finance, Cat. no. 5609.0, June 2014 |
| |
2008-09
|
2009-10
|
2010-11
|
2011-12
|
2012-13
|
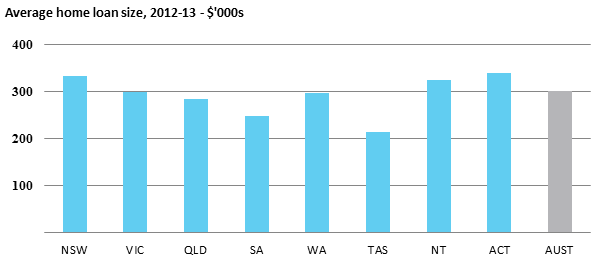
| Average size of new owner-occupied home loan (a) – $'000 |
|
|
|
| New South Wales |
296.9
|
326.6
|
343.5
|
329.4
|
334.3
|
| Victoria |
257.9
|
285.0
|
303.7
|
300.6
|
300.4
|
| Queensland |
274.7
|
287.6
|
289.2
|
284.4
|
284.4
|
| South Australia |
224.9
|
238.4
|
251.3
|
244.7
|
247.6
|
| Western Australia |
274.6
|
300.2
|
291.5
|
276.7
|
297.4
|
| Tasmania |
191.5
|
211.2
|
214.9
|
218.8
|
214.3
|
| Northern Territory |
274.4
|
298.3
|
304.9
|
309.8
|
326.0
|
| Australian Capital Territory |
287.9
|
308.9
|
330.4
|
328.7
|
339.3
|
| Australia |
271.3
|
294.7
|
306.0
|
298.4
|
302.5
|
| Annual change – per cent |
|
|
|
|
| New South Wales |
7.4
|
10.0
|
5.2
|
-4.1
|
1.5
|
| Victoria |
9.2
|
10.5
|
6.6
|
-1.0
|
-0.1
|
| Queensland |
9.9
|
4.7
|
0.6
|
-1.7
|
0.0
|
| South Australia |
11.0
|
6.0
|
5.4
|
-2.6
|
1.2
|
| Western Australia |
12.6
|
9.3
|
-2.9
|
-5.1
|
7.5
|
| Tasmania |
12.6
|
10.3
|
1.8
|
1.8
|
-2.0
|
| Northern Territory |
21.6
|
8.7
|
2.2
|
1.6
|
5.2
|
| Australian Capital Territory |
9.6
|
7.3
|
7.0
|
-0.5
|
3.2
|
| Australia |
9.6
|
8.6
|
3.8
|
-2.5
|
1.4
|
| |
|
|
|
|
|
| (a) Includes refinancing, but excludes alterations and additions and refinancing. Comprises construction of new dwellings and purchase of new and established dwellings |
| Source: ABS, Housing Finance, Cat. no. 5609.0, June 2014 |
| |
2008-09
|
2009-10
|
2010-11
|
2011-12
|
2012-13
|
| Average monthly repayment on new loans – $ |
|
|
|
| New South Wales |
1 922
|
2 039
|
2 363
|
2 387
|
2 353
|
| Victoria |
1 813
|
1 918
|
2 277
|
2 211
|
2 112
|
| Queensland |
1 882
|
1 905
|
2 112
|
2 058
|
1 963
|
| South Australia |
1 524
|
1 537
|
1 768
|
1 757
|
1 718
|
| Western Australia |
1 963
|
2 038
|
2 192
|
2 116
|
2 126
|
| Tasmania |
1 356
|
1 375
|
1 522
|
1 471
|
1 458
|
| Northern Territory |
1 906
|
1 927
|
2 131
|
2 224
|
2 221
|
| Australian Capital Territory |
1 912
|
1 939
|
2 151
|
2 188
|
2 314
|
| Australia |
1 847
|
1 926
|
2 205
|
2 174
|
2 116
|
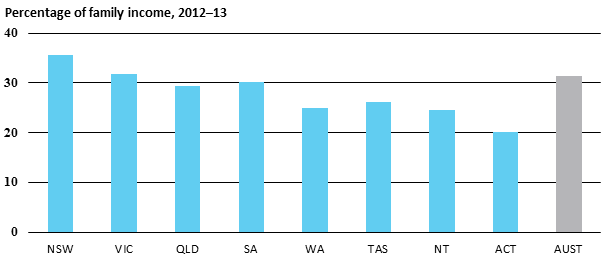
| Loan repayments (a) – percentage of family income |
|
|
|
| New South Wales |
34.3
|
34.3
|
38.3
|
37.2
|
35.6
|
| Victoria |
31.2
|
31.3
|
35.7
|
33.0
|
31.8
|
| Queensland |
33.3
|
31.5
|
33.3
|
30.9
|
29.3
|
| South Australia |
31.7
|
31.1
|
34.5
|
33.1
|
30.2
|
| Western Australia |
28.5
|
27.5
|
27.0
|
23.6
|
24.9
|
| Tasmania |
30.6
|
28.2
|
29.2
|
26.8
|
26.2
|
| Northern Territory |
24.1
|
23.0
|
23.6
|
22.3
|
24.6
|
| Australian Capital Territory |
18.7
|
17.7
|
18.7
|
18.0
|
20.2
|
| Australia |
32.2
|
31.7
|
34.7
|
32.6
|
31.3
|
| |
|
|
|
|
|
| (a) Annual average of proportion of family income devoted to meeting loan repayments. |
|
| Source: Real Estate Institute of Australia, Home Loan Affordability Report, June 2014. Note: REIA updated the methodology for these statistics in September 2013. For the latest data see: http://library.parl.net/~/media/library/statistics/Housing_data.xlsx |
| |
2008-09
|
2009-10
|
2010-11
|
2011-12
|
2012-13
|
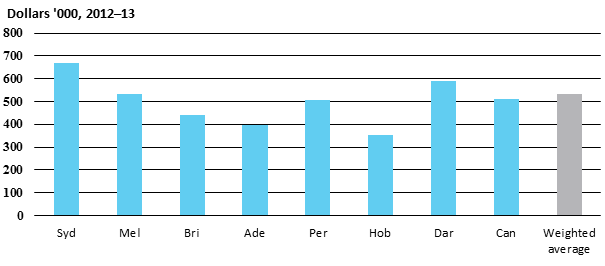
| Median price of houses sold – $'000 (a) |
|
|
|
|
| Sydney |
535.4
|
601.1
|
642.9
|
638.7
|
668.5
|
| Melbourne |
427.1
|
520.0
|
553.6
|
528.8
|
533.4
|
| Brisbane |
406.5
|
448.0
|
443.1
|
426.8
|
438.5
|
| Adelaide |
360.0
|
394.8
|
405.4
|
389.3
|
396.0
|
| Perth |
433.8
|
487.5
|
486.3
|
473.8
|
505.0
|
| Hobart |
323.4
|
366.1
|
373.4
|
358.3
|
353.1
|
| Darwin |
445.8
|
535.3
|
544.2
|
535.8
|
587.6
|
| Canberra |
444.7
|
494.1
|
526.0
|
509.4
|
508.8
|
Weighted average eight
capital cities |
460.6
|
513.7
|
537.4
|
515.2
|
531.2
|
| Annual change – per cent |
|
|
|
|
|
| Sydney |
-2.8
|
12.3
|
7.0
|
-0.7
|
4.7
|
| Melbourne |
-4.1
|
21.7
|
6.5
|
-4.5
|
0.9
|
| Brisbane |
-0.3
|
10.2
|
-1.1
|
-3.7
|
2.8
|
| Adelaide |
1.8
|
9.7
|
2.7
|
-4.0
|
1.7
|
| Perth |
-6.3
|
12.4
|
-0.3
|
-2.6
|
6.6
|
| Hobart |
-1.0
|
13.2
|
2.0
|
-4.1
|
-1.4
|
| Darwin |
7.7
|
20.1
|
1.7
|
-1.5
|
9.7
|
| Canberra |
-4.1
|
11.1
|
6.5
|
-3.1
|
-0.1
|
Weighted average eight
capital cities |
0.3
|
11.5
|
4.6
|
-4.1
|
3.1
|
| |
|
|
|
|
|
| (a) Moving annual average as of June of the financial year |
| Source: Real Estate Institute of Australia, Market Facts, multiple issues; and data provided by REIA to the Parliamentary Library |
| Note: REIA has recently revised some of their housing data. For the latest statistics see: http://library.parl.net/~/media/library/statistics/Housing_data.xlsx |
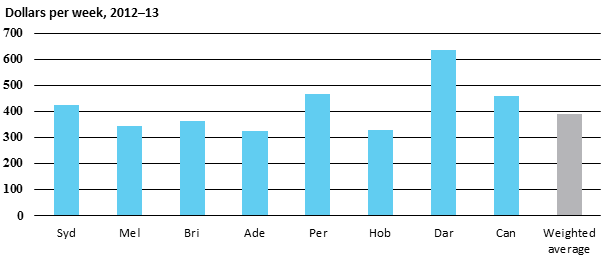
| |
2008-09
|
2009-10
|
2010-11
|
2011-12
|
2012-13
|
| Median rent for three bedroom houses let – $ per week |
|
|
|
| Sydney |
350
|
373
|
398
|
415
|
423
|
| Melbourne |
303
|
323
|
335
|
340
|
345
|
| Brisbane |
336
|
344
|
350
|
353
|
361
|
| Adelaide |
285
|
299
|
315
|
321
|
323
|
| Perth |
363
|
374
|
383
|
421
|
468
|
| Hobart |
306
|
320
|
338
|
335
|
326
|
| Darwin |
531
|
552
|
542
|
547
|
635
|
| Canberra |
401
|
423
|
448
|
460
|
458
|
Weighted average eight
capital cities |
332
|
350
|
365
|
378
|
389
|
| Annual change – per cent |
|
|
|
|
|
| Sydney |
11.4
|
6.6
|
6.7
|
4.4
|
1.8
|
| Melbourne |
12.3
|
6.3
|
3.9
|
1.5
|
1.5
|
| Brisbane |
8.0
|
2.2
|
1.8
|
0.7
|
2.5
|
| Adelaide |
8.1
|
4.8
|
5.4
|
2.0
|
0.4
|
| Perth |
10.3
|
3.1
|
2.3
|
10.1
|
11.0
|
| Hobart |
7.8
|
4.7
|
5.5
|
-0.7
|
-2.6
|
| Darwin |
12.4
|
4.0
|
-1.9
|
0.9
|
16.2
|
| Canberra |
8.1
|
5.3
|
5.9
|
2.8
|
-0.5
|
Weighted average eight
capital cities |
10.6
|
5.2
|
4.5
|
3.5
|
2.9
|
| |
|
|
|
|
|
(a) Data for Melbourne in both the June and September 2008 quarters was not available.
Therefore, values have been imputed, by taking an average of the remaining quarters within a given financial year. |
Source: Real Estate Institute of Australia, Market Facts, April 2014.
Note: REIA has recently revised some of their housing data.
For the latest statistics see:http://library.parl.net/~/media/library/statistics/Housing_data.xlsx |
For copyright reasons some linked items are only available to members of Parliament.
© Commonwealth of Australia
Creative Commons
In essence, you are free to copy and communicate this work in its current form for all non-commercial purposes, as long as you attribute the work to the author and abide by the other licence terms. The work cannot be adapted or modified in any way. Content from this publication should be attributed in the following way: Author(s), Title of publication, Series Name and No, Publisher, Date.
To the extent that copyright subsists in third party quotes it remains with the original owner and permission may be required to reuse the material.
Inquiries regarding the licence and any use of the publication are welcome to webmanager@aph.gov.au.
This work has been prepared to support the work of the Australian Parliament using information available at the time of production. The views expressed do not reflect an official position of the Parliamentary Library, nor do they constitute professional legal opinion.
Any concerns or complaints should be directed to the Parliamentary Librarian. Parliamentary Library staff are available to discuss the contents of publications with Senators and Members and their staff. To access this service, clients may contact the author or the Library‘s Central Entry Point for referral.