Budget Review October 2022–23 Index
Gregory O’Brien
In Australia, and in countries around the world, government
economic support packages in response to the COVID-19 pandemic have led to
large increases in government debt. This continues the trend of increasing debt
since the Global Financial Crisis (GFC). Since the beginning of the pandemic, Australian
Government gross debt has increased from $534.4 billion in March 2019 to $894.9 billion as of 28 October 2022. The
October 2022–23 Budget forecasts further increases in gross debt to $1.159
trillion (43.1% of GDP) by the end of the 2025–26 financial year (Budget strategy
and outlook: budget paper no. 1: 2022–23,
p. 218). While these are the highest levels of debt on issue by the Australian
Government since the 1950s, they remain well below both Australian
historical peaks reached following the Second World War (p. 8) and
current government debt levels held by governments in other developed
countries.
Key terms are outlined below, followed by an overview of
Australian Government debt figures in the Budget based around 3 frequently
asked questions: how do current levels of Australian Government debt compare to
the past; how they compare internationally; and who owns Australian Government
debt. A final section highlights where to find more detailed discussions of
debt in the Budget.
Australian Government debt issuance and key terms
Australian Government debt is a key component of the
Australian Government Budget. Government spending is funded either through
receipts—primarily taxes—or through borrowing. In the Budget, the difference
between receipts and payments is referred to as the cash balance, which has
been in deficit (payments have exceeded receipts) since 2007–08. The Budget
estimates that the underlying cash balance will be $36.9 billion (1.5% of GDP)
in deficit in 2022–23 and will remain in deficit throughout the next decade
through to 2032–33 (Budget paper
no. 1, pp. 74; 81). These deficits have led to a steady increase in the
level of Australian Government debt, which is forecast to continue rising over
the next decade.
The Australian Office of
Financial Management (AOFM) manages Australian Government debt issuance.
The AOFM issues 3 types of debt securities, collectively known as Australian
Government Securities (AGS):
Treasury Bonds: medium to long-term debt securities
that pay interest at a fixed annual rate every 6 months. These are the largest
type of AGS, representing 92.8% of AGS on issue as of 28 October 2022.
Treasury Indexed Bonds: medium to long-term debt
securities that include adjustments for inflation. These represented 4.2% of
AGS on issue as of 28 October 2022.
Treasury Notes: short-term debt securities with
maturations up to one year. These represented 3% of AGS on issue as of 28
October 2022.
The total face value of AGS on issue at a given point in
time, which represents the total amount that will need to be repaid when all
extant AGS mature, is used as a measure of gross debt in the Budget. The AOFM publishes a weekly figure for total
AGS on issue, broken down into the 3 types described above, as well as more
detailed information in its data hub.
While gross debt is a good representation of the total
magnitude of outstanding debt, it may not be the best measure for analysing
debt sustainability depending on the financial assets available to service or
pay off this debt. For this reason, the Budget also provides figures for
Australian Government net debt, defined as ‘the sum of interest-bearing
liabilities less the sum of selected financial assets (cash and deposits,
advances paid and investments, loans and placements)’ (Budget paper
no. 1, p. 223). These financial assets are primarily held in government
investment funds, such as the Future Fund.
Whether gross debt or net debt is a better measure of
government indebtedness will depend on the context of the analysis. The
difference between these measures is described in more detail when looking at
international comparisons of government debt, below.
Trends in Australian Government Debt
The
Budget provides historical data for a range of budget aggregates back to
1970–71 in the Historical Australian Government Data statement of Budget paper
no. 1 (Statement 11). When
comparing levels of debt across long periods of time, it is useful to convert
the dollar values of debt into a relative measure, usually the ratio to GDP, to
control for the impacts of price changes across the economy. Figure 1 shows
gross debt, represented by the total face-value of AGS outstanding, as a ratio
to GDP over the last 50 years and including Budget estimates through to 2025–26.
It also shows the interest payments on this debt for the same period, also as a
ratio to GDP.
Figure 1 Australian
Government total AGS on issue (gross debt) and interest paid
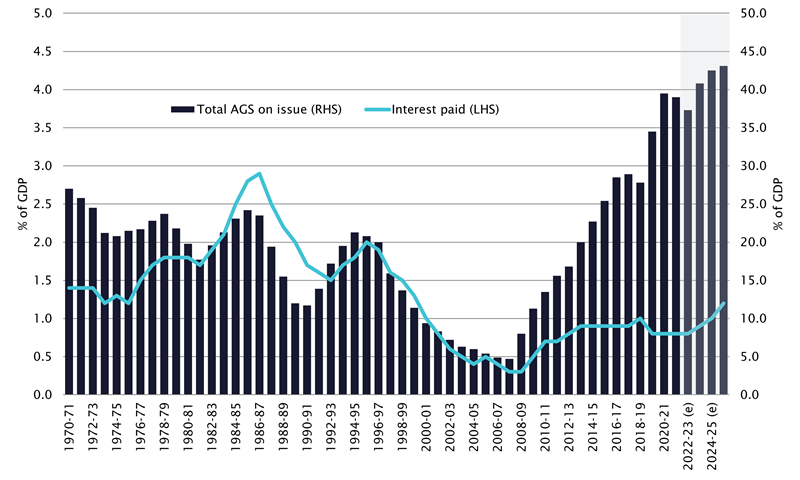
Source: Budget paper
no. 1, p. 382.
Figure 1 shows that Australian Government debt fluctuated
around 20% of GDP from the early 1970s to the mid-1990s with one period of sustained
decreases in the late 1980s. Government debt then trended down between the
mid-1990s until the GFC in 2007–08, as the Howard Government prioritised debt
repayment and budget surpluses. From 2008–09 in the wake of the GFC and
associated government economic support packages, government debt has steadily
increased as a ratio to GDP. The October 2022–23 Budget forecasts government
debt to GDP to fall in 2021–22 and 2022–23 as nominal GDP growth increases at a
higher rate than gross debt, but increase again from 2023–24 (Budget paper
no. 1, p. 382). In dollar terms, gross debt is forecast to increase to reach
a trillion dollars in 2023–24, reaching a peak over the forward estimates of
$1.186 trillion in April 2026 (Budget paper
no. 1, p. 218). While current and forecast debt to GDP ratios are high
relative to recent history, they are still well
below the peak reached following the Second World War of over 120% of GDP (p. 8).
The increase in the level of Australian Government debt following
the GFC had not seen a commensurate rise in the amount of interest paid because
interest rates on Australian Government debt fell over the period, largely
offsetting the increase in the level of debt. Interest rates on
Australian Government debt have risen steeply throughout 2022, however.
This increase has been common to many countries globally in response to
inflationary pressures and tightening of monetary policy by central banks. This
increase in interest rates has led to an increase in the estimates for Australian
Government interest payments as a proportion of GDP, which are estimated to
increase from 0.8% of GDP in 2022–23 to 1.2% of GDP in 2025–26. The Budget
provides a discussion of the impact of higher interest rates on the budget in
Box 3.4 on pages 84–85 of Budget
paper no. 1.
International comparison of General Government debt
Despite increases in Australian Government gross and net
debt since the GFC, levels of both remain relatively low when compared to other
countries. The International Monetary Fund (IMF) publishes data on General
Government sector gross and net debt across countries. The IMF approach
includes all levels of government (Australia Government, state and local
governments), which allows more meaningful comparison across countries with
different structures of government. Figure 2 shows IMF estimates of gross debt
and net debt for 2022 across several advanced countries from the IMF’s Fiscal
Monitor October 2022 publication.
Figure 2 IMF General Government gross and net debt
(% of GDP) estimates, 2022
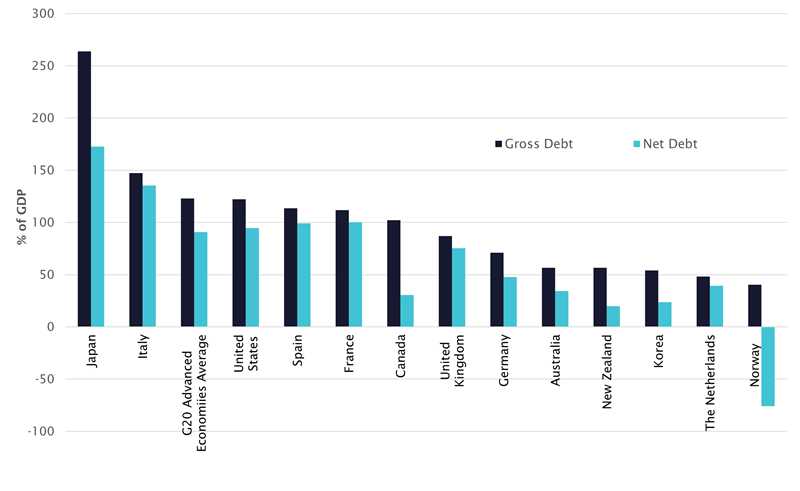
Source: International Monetary Fund (IMF), Fiscal
Monitor: Helping People Bounce Back (Washington, DC: IMF, October 2022),
Tables A7 and A8.
Figure 2 shows the important difference between gross debt
and net debt when comparing across countries. Countries with significant
financial assets, such as Canada (held by public pension plans) and Norway
(held in a sovereign wealth fund) have much lower levels of net debt than gross
debt once these financial assets are incorporated. This is also relevant to a
lesser extent for Australia, where the $242 billion in the Future Fund and other smaller
government investment funds have contributed to a
widening gap between gross debt and net debt over time (p. 1).
There is variation across countries in the degree to which
these financial assets are held to meet future specified expenditure purposes,
and some debate as to whether it is appropriate to consider these assets as
offsetting government debt. Gross debt is a more consistent measure across
countries, as there is less variation due to different social security regimes.
As Figure 2 shows, despite the increase in both Australian
Government net debt and gross debt since 2007–08, the level of government debt
compared to international peers remains relatively low. The Australian General Government
gross debt to GDP ratio is less than half that of the United States, and less
than a quarter that of Japan. Both gross debt to GDP and net debt to GDP ratios
are lower than any G7 members, and closer to mid-sized economies including
Korea and New Zealand.
Holdings of Australian Government Securities
Australian Government debt is owned by a range of Australian
and international investors. The AOFM provides information on the share of AGS
on issue owned by non-residents on a market-value basis. Under the Guarantee of State and
Territory Borrowing Appropriation Act 2009, the AOFM was tasked with
establishing a Public
Register of Government Borrowings. As the AOFM has no powers to compel
financial intermediaries to disclose the beneficial owners of AGS they
administer, the register has limited information on the countries of residence
of foreign owners of AGS.
The Reserve Bank of Australia (RBA) started purchasing
significant amounts of AGS on the secondary market as
part of its monetary policy response to the COVID-19 pandemic in order to
lower yields on government bonds and maintain liquidity in bond markets. This
led to the RBA holding a growing share of the total AGS on issue. The RBA
ceased purchasing AGS on 10 February 2022, and in its May 2022 Statement
on Monetary Policy decided that:
[…] the Board will not reinvest the proceeds of maturing
government bonds and expects the Bank’s balance sheet to decline significantly
over the next couple of years as the Term Funding Facility comes to an end. The
Board is not currently planning on selling the government bonds that the Bank
has purchased during the pandemic. (p. 3)
This decision means that RBA ownership of AGS should slowly
recede as the existing AGS owned by the RBA mature. As total outstanding AGS is
not forecast to decline, these maturing bonds will need to be absorbed by the
resident and non-resident markets for AGS. Given the duration of these bonds,
this process is likely to slowly occur over the next decade.
Figure 3 below shows estimates for the ownership of AGS by non-residents,
the RBA and other domestic owners. The chart shows resident holdings of AGS
have steadily increased over the last decade and non-resident holdings have
fallen as a proportion of the total while RBA holdings have increased over the last
2 financial years. The reduction in the proportion of AGS held by non-residents
reduces the risk of interest rate volatility associated with capital flight,
when non-resident investors sell overseas assets and repatriate the money,
often in response to market volatility.
Figure 3 Estimated resident, Reserve Bank Australia
and non-resident holdings of AGS
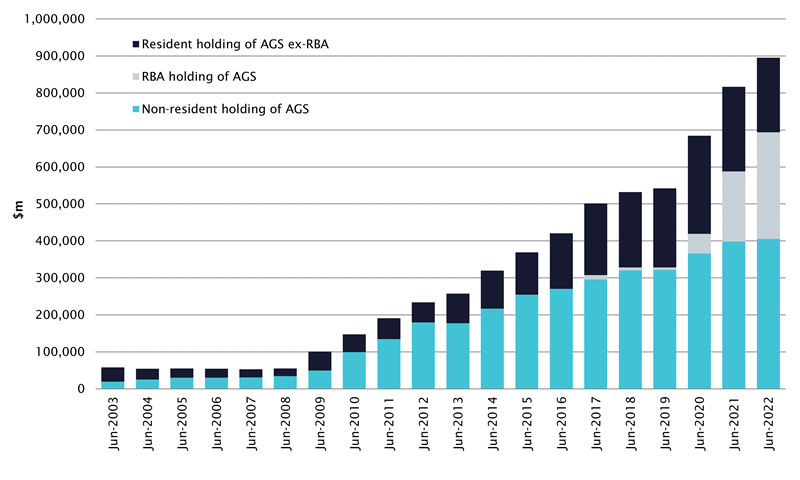
Source: Parliamentary Library calculations based on Australian
Office of Financial Management, Non-resident
holdings of AGS, and Reserve Bank of Australia, Holdings of Australian
Government Securities and Semis.
Where to find additional discussion of debt in the October 2022–23 Budget
While this article provides a broad overview of the debt
figures contained in the Budget, more detailed discussion is provided on
several debt-related topics in Budget paper no. 1:
- Budget paper
no. 1 – Statement 3: Fiscal Strategy and Outlook provides the medium-term
(through to 2032–33) projections for the underlying cash balance (p. 81), gross
debt (p. 97) and net debt (p. 100), and how these projections have changed
since the Pre-election Economic and Fiscal Outlook 2022 (PEFO).
- Statement 3 includes a discussion of how changes in
productivity growth, government debt yields and NDIS costs since PEFO have impacted
medium-term projections for the underlying cash balance and gross debt (Box
3.2, p. 82).
- Statement 3 also provides a discussion on the impact of
higher interest rates on the budget, including their impact on government
interest payment projections (Box 3.4, pp. 84–85).
- Statement 7: Debt Statement provides detailed figures on
Australian Government debt parameters over the forward estimates (to 2025–26).
- a complete breakdown of Treasury Bonds on issue is provided in
Table 7.4, p. 220.
- yield curve assumptions (interest rate assumptions for Treasury
Bonds of different maturities) used in the Budget and how they have changed
since the March 2022–23 Budget are provided on page 225.
- Statement 8: Forecasting Performance and Sensitivity Analysis
discusses how changes in underlying assumptions impact key budget forecasts. The
sensitivity analysis for movements in yields (pp. 246–248) shows how
alternative assumptions of 10-year bond yields would lead to different
assumptions for the path of gross debt levels.
All online articles accessed October 2022
For copyright reasons some linked items are only available to members of Parliament.
© Commonwealth of Australia

Creative Commons
With the exception of the Commonwealth Coat of Arms, and to the extent that copyright subsists in a third party, this publication, its logo and front page design are licensed under a Creative Commons Attribution-NonCommercial-NoDerivs 3.0 Australia licence.
In essence, you are free to copy and communicate this work in its current form for all non-commercial purposes, as long as you attribute the work to the author and abide by the other licence terms. The work cannot be adapted or modified in any way. Content from this publication should be attributed in the following way: Author(s), Title of publication, Series Name and No, Publisher, Date.
To the extent that copyright subsists in third party quotes it remains with the original owner and permission may be required to reuse the material.
Inquiries regarding the licence and any use of the publication are welcome to webmanager@aph.gov.au.
This work has been prepared to support the work of the Australian Parliament using information available at the time of production. The views expressed do not reflect an official position of the Parliamentary Library, nor do they constitute professional legal opinion.
Any concerns or complaints should be directed to the Parliamentary Librarian. Parliamentary Library staff are available to discuss the contents of publications with Senators and Members and their staff. To access this service, clients may contact the author or the Library‘s Central Enquiry Point for referral.