Budget Review 2020–21 Index
Phillip Hawkins
The bushfires and COVID-19 pandemic in 2020 have had a
substantial impact on the Commonwealth Government’s fiscal position, with the
Budget projected to remain in deficit for at least the next decade and government
debt increasing substantially (albeit from relatively low starting points).
These impacts to the Budget are being driven by a worsening
economy, which fell into recession in 2019–20 primarily as a result of the
COVID-19 pandemic and responses to it, including the shutting of businesses and
closing of state and international borders. The pandemic has also reduced
government tax receipts, including personal income tax receipts and company tax
receipts which have been impacted by lower employment, average incomes and
reduced corporate profitability. Further, the Australian Government has
significantly increased payments through policy decisions such as providing
economic stimulus and additional income support to households.
This brief summarises the key fiscal data and discusses the
Government’s medium term fiscal strategy. It provides historical time-series data
over a period of 20 to 30 years to place the current fiscal position
into historical context. Longer term historical data and charts are available
from the Historical Tables spreadsheet.
Underlying cash balance
The surplus or deficit is measured by the underlying cash
balance (UCB), which is a measure of the difference between the receipts of
the Australian Government (including tax and non-tax receipts) and the payments
the Government makes on a cash accounting basis. The fiscal balance is
broadly the equivalent measure on an accrual basis, measuring the difference
between revenues and expenses (including net capital expenditures).
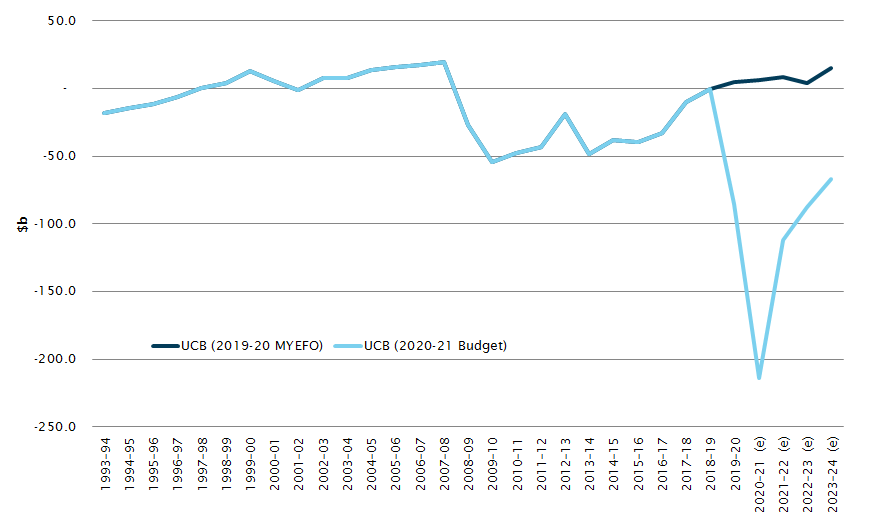
Figure 1: underlying cash
balance
Sources: J Frydenberg
(Treasurer) and M Cormann (Minister for Finance), Mid-year economic and fiscal outlook 2019–20; Australian Government, Budget strategy and outlook: budget paper no. 1:
2020-21, statement 11.
The Mid-year
Economic and Fiscal Outlook 2019–20 (MYEFO) released in December 2019,
before the start of the COVID-19 pandemic, estimated that the Budget would be
in surplus in 2019–20 and over each year of the forward estimates. According to
the 2020–21
Budget, however, the budget deficit was $85.3 billion in 2019–20 and
is anticipated to remain in deficit across each year of the forward estimates
(see Figure 1).
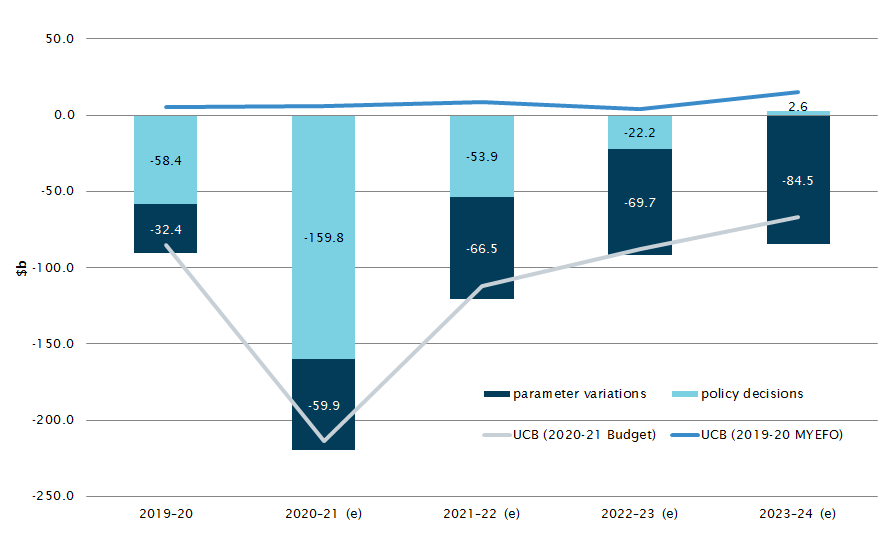
Figure 2: parameter variations
and policy decisions
Sources: J Frydenberg
(Treasurer), Economic and Fiscal Update July 2020; Australian Government, Budget strategy and outlook: budget paper no. 1:
2020-21, statement 11.
Figure 2 shows the change in the UCB as a result of
both parameter variations and policy decisions. Parameter variations
occur because of changes in the economy, or in the composition and size of the
population, as well as the flow on effects on revenue and demand for Government
payments and services. Policy decisions are explicit policy decisions
taken by the Government.
- Parameter variations since MYEFO reduced the UCB by $32.4 billion
in 2019–20 and are expected to reduce the UCB by $59.9 billion in 2021–22
and $280.6 billion in total across the forward estimates period.
- Policy decisions made by the Government since MYEFO
reduced the UCB by $58.4 billion in 2019–20 and are expected to increase
the Budget deficit by $159.8 billion in 2020–21, with the combined impact
of policy decisions across the forward estimates reducing the UCB by a
cumulative $233.2 billion.
Many of the significant and most costly policy decisions
made by the Government are economic stimulus measures that are designed to be
temporary to support the economy across 2019–20 and
2020–21. These significant expansionary fiscal policy decisions are expected to
be removed over the forward estimates period to the extent that the policy
decisions in 2023–24 are forecast to reduce the deficit by $2.6 billion.
As outlined in Table 1,
among the largest policy decisions taken by the Government since the MYEFO are:
- the introduction of the JobKeeper payment, which cost the budget
$20.6 billion in 2019–20 and, combined with subsequent changes announced
on 7 August 2020, is estimated to cost the budget $80.7 billion in
2020–21. The Government
says that JobKeeper will end in March 2021, so this measure has no
financial impact after 2020–21
- temporary business cash flow boost payments for employers,
which cost the budget $14.9 billion in 2019–20 and are expected to cost
the budget $17.0 billion in 2020–21. The last quarter this support applies
for is the December 2020, so this measure has no financial impact after 2020–21
- the coronavirus supplement for income support recipients (such
as JobSeeker, Parenting Payment, Youth Allowance and Austudy), which cost $5.9 billion
in 2019–20 and is estimated to cost the budget $12.1 billion in 2020–21.
This measure will end on 31 December 2020 and has no financial impact after 2020-21
and
- bringing forward planned personal income tax cuts to 2020–21,
which is expected to cost the budget $6.9 billion in 2020–21 and $16.9 billion
in 2021–22. This measure is expected to have a positive financial impact of
$5.7 billion in 2022–23 and $0.3 billion in 2023–24.
Table 1: selected large temporary
economic support measures: $ billion
| Measure |
2019–20 |
2020–21 |
2021–22 |
2022–23 |
2023–24 |
| Payments measures: economic |
|
|
|
|
|
| JobKeeper payment |
–20.6 |
–80.7 |
- |
- |
- |
| Business cash flow boost |
–14.9 |
–17.0 |
- |
- |
- |
| Coronavirus supplement |
–5.9 |
–12.2 |
- |
- |
- |
| Economic support payments |
–5.6 |
–6.2 |
- |
- |
- |
| Receipts measures |
|
|
|
|
|
| Bringing forward personal income
tax cuts |
- |
–6.9 |
–16.9 |
5.7 |
0.3 |
| Temporary full expensing of
business capital expenditures |
- |
–1.5 |
–11.4 |
–18.1 |
4.3 |
| Increasing and extending the
instant asset write-off |
- |
–2.4 |
–0.8 |
1.5 |
0.8 |
| Backing business investment |
- |
–1.5 |
–5.2 |
0.2 |
3.3 |
Source: Australian Government,
Budget measures: budget paper no. 2: 2020–21.
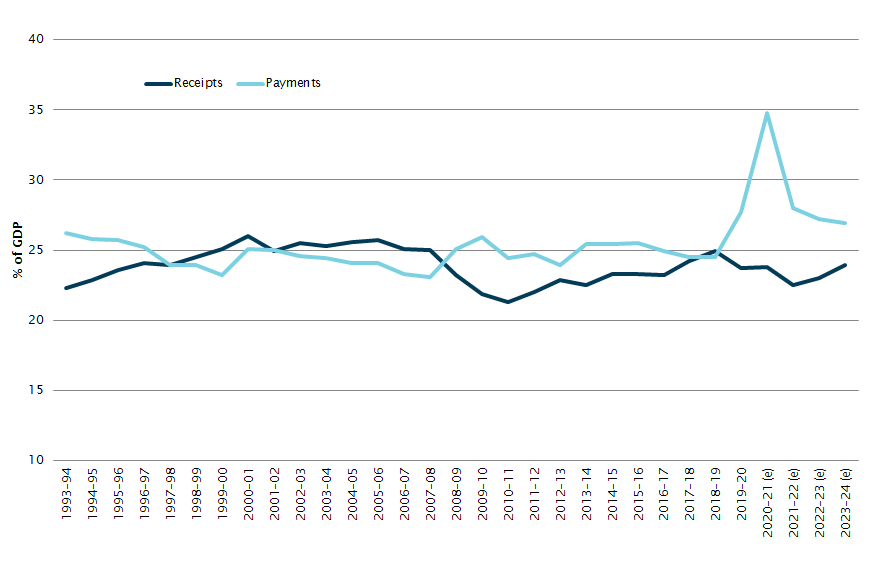
Payments and receipts
Figure 3 shows that the increase in the Budget deficit
in 2019–20 and over the forward estimates is primarily being driven by a
substantial increase in Government payments, and consistent with the Government’s
strategy in response to COVID-19, a substantial part of this increase is
anticipated to be temporary. Receipts are expected to be lower across the
forward estimates, but are relatively less affected over this period than
payments.
- Payments rose sharply from 24.5 per cent of GDP
in 2018–19 to 27.7 per cent in 2019–20. They are expected to rise to a
historically high level of 34.8 per cent of GDP in 2021–22.
Reflecting that economic support due to the COVID-19 pandemic is anticipated to
be temporary in nature, after 2020–21 payments are estimated to decrease to
26.9 per cent of GDP in 2023–24.
- This
increase in payments in the short term is being driven by increasing demand for
income support payments (such as increased JobSeeker claimants as unemployment
rises) coupled with temporary increases to the rate of these existing payments,
as well as new temporary support payments such as JobKeeper and the coronavirus
supplement.
- Receipts were 24.9 per cent of GDP in 2018–19,
but fell to 23.7 per cent of GDP in 2019–20. They are anticipated to
be 23.8 per cent of GDP in 2020–21 and to fall to 22.5 per cent
of GDP in 2021–22, before increasing to 23.9 per cent of GDP by the
end of the forward estimates period.
- While
receipts are falling as a proportion of the economy, they are not expected to
decline as far as a proportion of the economy as they did in the period
following the global financial crisis, when they declined to 21.3 per cent
of GDP in 2010–11.
Figure 3: payments and receipts
Source: Australian Government,
Budget strategy and outlook: budget paper no. 1:
2020–21, statement 11.
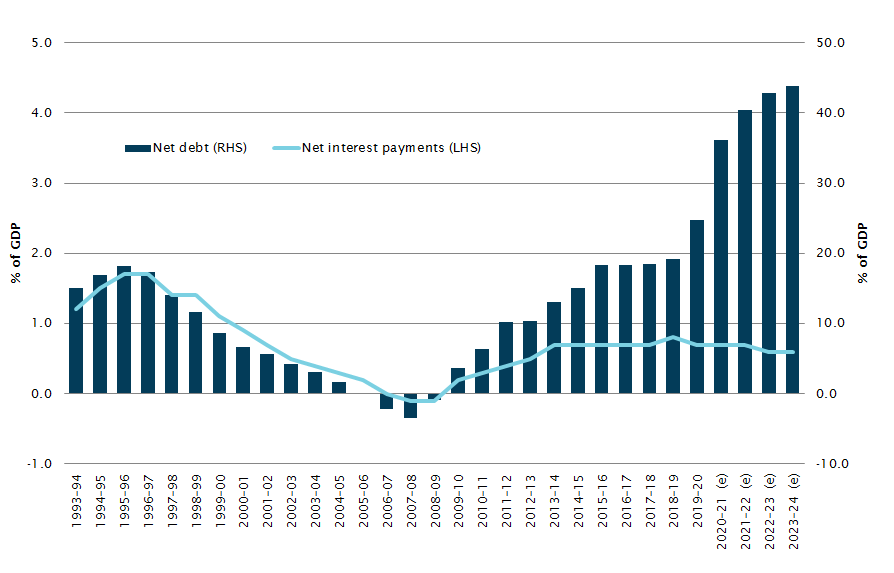
Net debt and interest payments
Australian Government general government sector
net debt is equal to the sum of deposits held, government securities, loans and
other borrowing, minus the sum of cash and deposits, advances paid, and
investments, loans and placements.
Figure 4 shows Australian Government net debt and net
interest costs as a proportion of the economy. The Government has increased its
borrowing and will continue to do so over the forward estimates period as a
result of substantially increased deficits:
- Net debt increased from$373.6 billion in 2018–19
(19.2 per cent of GDP) to $491.2 billion in
2019–20 (24.8 per cent of GDP) and is expected to increase to $703.2 billion
(36.1 per cent of GDP) in 2020–21. Net debt is expected to be $966.2 billion
(a peak as a proportion of GDP, at 43.8 per cent) in 2023–24.
-
Despite increases in net and gross debt, the amount of interest
paid on these debts is expected to stay relatively flat at around 0.8–0.9 per cent
of GDP, reflecting historically low interest rates.
- Gross debt measured as the total face value of Australian
Government securities on issue increased from $542.0 billion (27.8 per cent
of GDP) to $684.3 billion (34.5 per cent of GDP) in 2019–20. It is
expected to increase to $872.0 billion in 2020–21 (44.8 per cent
of GDP), and to $1,138.0 billion in 2023–24 (51.6 per cent of GDP).
Figure 4: net debt and net
interest payments
Source: Australian Government,
Budget strategy and outlook: budget paper no. 1:
2020–21, statement 11.
Medium-term fiscal outlook
In the 2019–20 Budget the Government set out a medium-term
strategy to achieve budget surpluses, on average, over the economic cycle and stated
an intention to eliminate the Commonwealth’s net debt by 2029–30.
However, as a result of the COVID-19 pandemic, the
Government has substantially revised its stated medium term fiscal strategy and
projections in the 2020–21 Budget.
- Medium term projections now outline budget deficits until at
least 2030‑31, with a deficit of 1.6 per cent of GDP projected
for 2030–31.
- Payments, which in the 2019–20 Budget were projected to fall
substantially to just over 23.6 per cent of GDP in the medium term,
are now projected to be a larger share of the economy at around 26.2 per cent
of GDP over the same period.
-
Receipts, which were anticipated to increase to just over 25.5 per cent
of GDP, are now anticipated to be lower over the medium term at around 24.5 per cent
of GDP.
- Net debt is projected to peak at 43.8 per cent of GDP
at 30 June 2024 and fall to 39.6 per cent of GDP by 2030–31.
All online articles accessed October 2020
For copyright reasons some linked items are only available to members of Parliament.
© Commonwealth of Australia

Creative Commons
With the exception of the Commonwealth Coat of Arms, and to the extent that copyright subsists in a third party, this publication, its logo and front page design are licensed under a Creative Commons Attribution-NonCommercial-NoDerivs 3.0 Australia licence.
In essence, you are free to copy and communicate this work in its current form for all non-commercial purposes, as long as you attribute the work to the author and abide by the other licence terms. The work cannot be adapted or modified in any way. Content from this publication should be attributed in the following way: Author(s), Title of publication, Series Name and No, Publisher, Date.
To the extent that copyright subsists in third party quotes it remains with the original owner and permission may be required to reuse the material.
Inquiries regarding the licence and any use of the publication are welcome to webmanager@aph.gov.au.
This work has been prepared to support the work of the Australian Parliament using information available at the time of production. The views expressed do not reflect an official position of the Parliamentary Library, nor do they constitute professional legal opinion.
Any concerns or complaints should be directed to the Parliamentary Librarian. Parliamentary Library staff are available to discuss the contents of publications with Senators and Members and their staff. To access this service, clients may contact the author or the Library‘s Central Enquiry Point for referral.