Economics Section
This brief provides an overview of the key
fiscal and economic numbers from the 2018–19 Budget.
A substantial improvement in the forecast economic and fiscal
position since the 2017–18 Mid-Year Economic and Fiscal
Outlook (MYEFO) is due largely to upward revisions to tax receipts driven by
employment and GDP growth.
The Government is now forecasting that the Budget will
return to an underlying cash balance surplus of $2.2 billion
(0.1 per cent of GDP) in 2019–20. This is one
year earlier than was forecast in the 2017–18 MYEFO. The
surplus is expected to grow to $16.6 billion (0.8 per cent of GDP) in 2020‑21
and build to at least 1 per cent of GDP over the medium term.
This improved fiscal position is primarily the result of
improvements in underlying economic parameters (parameter variations)—most
notably higher GDP and employment forecasts, which are expected to result in
higher taxation receipts and lower payments over the forward estimates period.
Additional policy decisions taken by the Government
in the 2018–19 Budget are expected to have a net negative
impact on the Budget over the forward estimates period, offsetting some of the
improvement in the underlying fiscal position as a result of parameter
variations.
Figure 1: impact of underlying parameter and policy
variations since the 2017–18 MYEFO
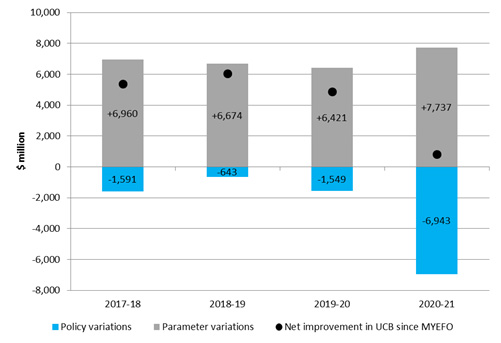
Note: UCB = underlying cash
balance
The Government’s medium-term fiscal
strategy (tax receipts <23.9%)
The Government’s medium-term fiscal strategy is to achieve
budget surpluses, on average, over the course of the economic cycle. The budget
repair strategy is designed to deliver budget surpluses building to at least 1
per cent of GDP as soon as possible, consistent with the medium-term fiscal
strategy.[1]
A new component of the Government’s medium-term strategy in
the 2018–19 Budget is a commitment to ‘maintaining a sustainable tax burden
consistent with the economic growth objective, including through maintaining
the tax-to-GDP ratio at or below 23.9 per cent of GDP’.[2]
Taxation receipts are expected to grow to 23.9 per cent of GDP by the end of
the forward estimates.
A number of commentators have questioned the economic
rationale for the adoption of this ratio; noting that, in combination with the
budget repair strategy, it gives the Government limited fiscal policy
flexibility. As a result of these self-imposed constraints on revenue, future
budget surpluses are likely to be small unless there are significant cuts to
expenditure.[3]
Views on
the economic estimates
As the improvement in the Australian government’s fiscal
position is heavily reliant on improvement in the underlying economic
parameters, this outcome is sensitive to considerable uncertainty.
A number of commentators have remarked upon the underlying
economic assumptions used in the Budget. EY and the Grattan Institute argue
that the forecasts are ‘optimistic’:
The economic growth forecasts underpinning the budget are on
the optimistic side. The budget projects a return to 3% trend growth, supported
by an ongoing recovery in business investment, stronger household spending and
a continuing public infrastructure spend.[4]
[and]
The budget forecasts for wages growth,
driving much of the planned increase in personal income tax collections, also
remain optimistic. Like the Reserve Bank, Treasurer
Scott Morrison is banking on strong growth in full-time employment translating
into higher wages. Wages growth is expected to accelerate from just over 2 per
cent a year today to 3.5 per cent by 2020–21.[5]
Deloitte highlight the uncertainties about the Budget’s
underlying assumptions:
The new plan may work, but it is vulnerable to economic and
budgetary conditions. If the economy takes a dive, then the Budget outlook
would dive alongside it. And the extended period of a
promised-but-never-materialised return to surplus may linger even longer.[6]
Global
risks
The Government acknowledges that there are also global risks
that may have a bearing on the Budget forecasts:
Globally, these risks are broadly balanced in the short term,
although they are tilted to the downside in the longer term. Key risks include
a faster-than-expected tightening of monetary policy, geopolitical tensions and
policy uncertainty in relation to trade protectionism. More broadly, a very
sharp adjustment in financial markets, which might occur from a range of
factors including elevated debt levels in a number of economies, would pose a
risk to both global and domestic activity.[7]
Headline Numbers
Economic
numbers
There are a few considerable changes to the Government’s
assumptions around major economic parameters since the 2017–18 MYEFO (see Table
1). These upwards revisions are predominately in the 2017–18 financial year,
which means that they have cumulative effects across the forward estimates
period. The changes are as follows:
- Real GDP growth for 2017–18 has been revised up to 2.75 per cent
from 2.5 per cent.
- Nominal GDP growth in 2017–18 has been revised up to 4.25 per
cent from 3.5 per cent (but revised down for 2018–19 by 0.25 per cent).
- Employment growth in 2017–18 has been revised upwards by 1 per
cent to 2.75 per cent.
Government forecasts of growth in the Wage Price Index are
unchanged.
Table 1: growth in key economic
parameters at 2018–19 Budget relative to 2017–18 MYEFO
| |
Outcomes |
Forecasts |
Projections |
|
2016–17 |
2017–18 |
2018–19 |
2019–20 |
2020–21 |
2021–22 |
| Real GDP |
2.1 |
2.75 |
3 |
3 |
3 |
3 |
| Change since MYEFO |
0.1 |
0.25 |
0 |
0 |
0 |
n/a |
| Nominal GDP |
5.9 |
4.25 |
3.75 |
4.75 |
4.5 |
4.5 |
| Change since MYEFO |
0.1 |
0.75 |
–0.25 |
0.25 |
–0.25 |
n/a |
| CPI |
1.9 |
2 |
2.25 |
2.5 |
2.5 |
2.5 |
| Change since MYEFO |
0 |
0 |
0 |
0 |
0 |
n/a |
| Wage Price Index |
1.9 |
2.25 |
2.75 |
3.25 |
3.5 |
3.5 |
| Change since MYEFO |
0 |
0 |
0 |
0 |
0 |
n/a |
| Employment |
1.9 |
2.75 |
1.5 |
1.5 |
1.25 |
1.25 |
| Change since MYEFO |
0 |
1 |
0 |
0.25 |
0 |
n/a |
| Unemployment |
5.6 |
5.5 |
5.25 |
5.25 |
5.25 |
5 |
| Change since MYEFO |
0 |
0 |
0 |
0 |
0 |
n/a |
Sources: Australian
Government, Mid-Year Economic and Fiscal Outlook 2017–18, p. 3; Australian Government, Budget strategy and outlook: budget paper no. 1:
2018–19, Statement 1, p. 1-10.
The Reserve Bank of Australia has forecast year-end real GDP
growth of 2.75 per cent for 2017–18, but it expects stronger growth of 3.5 per
cent in 2018–19 before falling to 3.0 per cent in 2019–20.[8]
Fiscal numbers
The underlying cash balance is forecast to fall to a
deficit of $14.5 billion (0.8 per cent of GDP) in 2018–19, and to return to a surplus
of $2.2 billion (0.1 per cent of GDP) in 2019–20 (see Table 2 and Figure 2).
Table 2: underlying cash balance
| |
Actual |
Estimates |
Projections |
|
| |
2017–18 |
2018–19 |
2019–20 |
2020–21 |
2021–22 |
Total |
| Underlying cash balance ($b) |
–18.2 |
–14.5 |
2.2 |
11.0 |
16.6 |
15.3 |
| Per cent of GDP |
–1.0 |
–0.8 |
0.1 |
0.5 |
0.8 |
|
Source: Australian
Government, Budget strategy and outlook: budget paper no. 1:
2018–19, Statement 3, p. 3-5.
Figure 2: underlying cash balance
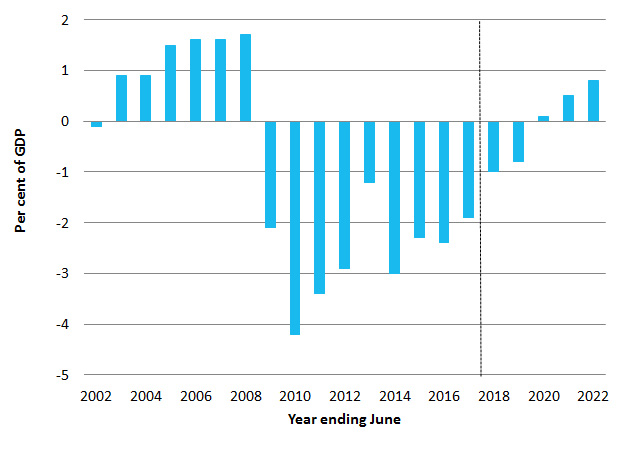
Source: Australian
Government, Budget strategy and outlook: budget paper no. 1:
2018–19, Statement 11, Historical
Australian Government Data, Table 1, p. 11-6.
The structural budget balance—which removes those
factors which have a temporary impact on revenues and expenditures—is estimated
to improve from a deficit of 1.25 per cent of GDP in 2018–19 to a series of
surpluses from 2020–21.
Total general government sector receipts are
estimated to be $473.7 billion (24.9 per cent of GDP) in 2018–19, rising to
$554.0 billion (25.5 per cent of GDP) in 2021–22 (see Table 3 and Figure 3).
Table 3: total general government sector receipts
| |
Actual |
Estimates |
Projections |
|
| |
2017–18 |
2018–19 |
2019–20 |
2020–21 |
2021–22 |
Total |
| Receipts
($ b) |
445.1 |
473.7 |
503.7 |
525.5 |
554.0 |
2 056.8 |
| Per
cent of GDP |
24.3 |
24.9 |
25.3 |
25.2 |
25.5 |
|
Source: Australian
Government, Budget strategy and outlook: budget paper no. 1:
2018–19, Statement 3, p. 3-10.
Figure 3: payments and receipts
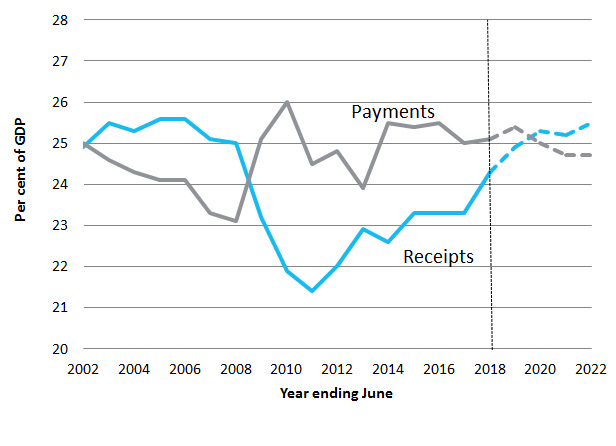
Source: Australian
Government, Budget strategy and outlook: budget paper no. 1:
2018–19, Statement 11: Historical
Australian Government Data, Table 1, p. 11-6.
Tax receipts are estimated to be $440.5 billion (23.1
per cent of GDP) in 2018–19 and $465.5 billion (23.3 per cent of GDP) in
2019–20, increasing to a projected $519.6 billion (23.9 per cent of GDP) by
2021–22. This projection is consistent with the updated medium-term fiscal
strategy, which includes the maintenance of a tax-to-GDP ratio at or below 23.9
per cent of GDP.
General government sector payments are estimated to
fall as a share of GDP, from 25.4 per cent of GDP in 2018–19 to 24.7 per cent
of GDP in 2021–22 (see Table 4 and Figure 3).
Table 4: general government sector
payments
| |
Actual |
Estimates |
|
Projections |
|
|
| |
2017–18 |
2018–19 |
2019–20 |
2020–21 |
2021–22 |
Total |
| Payments
($b) |
459.9 |
484.6 |
497.5 |
514.5 |
537.3 |
2 034.0 |
| Per
cent of GDP |
25.1 |
25.4 |
25.0 |
24.7 |
24.7 |
|
Source: Australian
Government, Budget strategy and outlook: budget paper no. 1:
2018–19, Statement 3, p. 3-10.
General government net capital investment is expected
to be $4.9 billion in 2018–19 (0.3 per cent of GDP), $4.8 billion higher than
net capital investment in 2017–18. This change is due to funding associated
with the implementation of the 2016 Defence White Paper.[9]
Over the four years to 2021–22, net capital investment in defence is projected
to total $25.3 billion. Net capital investment in almost all other functions is
projected to decline.[10]
General government sector net debt is estimated to
reach 18.4 per cent of GDP in 2018–19, before falling 14.7 per cent of GDP in
2021–22. It is projected to continue falling to 5.2 per cent of GDP by 2027–28
(see Table 5 and Figure 4).[11]
Table 5: net and gross debt
| |
Actual |
Estimates |
Projections |
| |
2017–18 |
2018–19 |
2019–20 |
2020–21 |
2021–22 |
|
| Net
debt ($b) |
341.0 |
349.9 |
344.0 |
334.3 |
319.3 |
|
| Per
cent of GDP |
18.6 |
18.4 |
17.3 |
16.1 |
14.7 |
|
| Gross
debt ($b) |
533.0 |
561.0 |
579.0 |
566.0 |
578.0 |
|
| Per
cent of GDP |
29.0 |
29.5 |
29.0 |
27.2 |
26.6 |
|
|
|
|
|
|
|
|
|
|
|
Source: Australian
Government, Budget strategy and outlook: budget paper no. 1:
2018–19, Statement 11, p. 11-12
and p. 11-14.
Figure 4: net debt
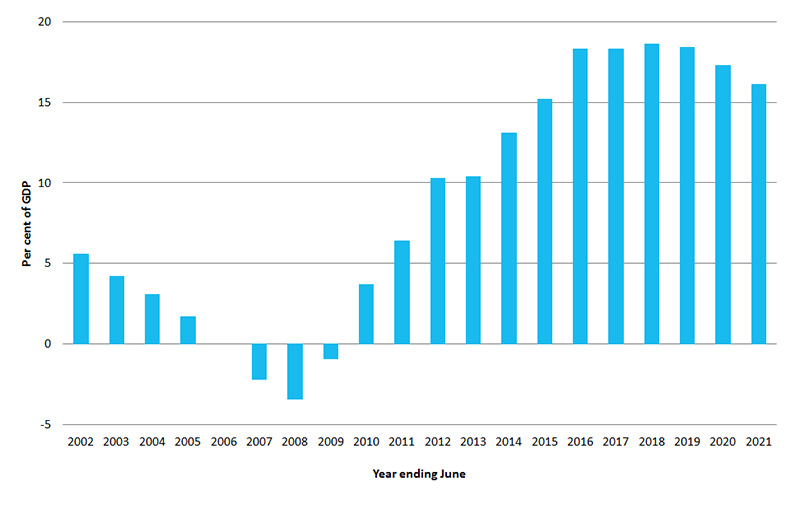
Source: Australian
Government, Budget strategy and outlook: budget paper no. 1:
2018–19, Statement 11: Historical
Australian Government Data, Table 4, p. 11-12.
Gross debt (the face value of CGS on issue) is
projected to rise from 29.4 per cent of GDP in 2018–19 to 26.6 per cent of GDP
by the end of the forward estimates, before falling to $532 billion by
2028–29 (see Table 5).[12]
General government sector net interest payments are
estimated to fall from $14.5 billion (0.8 per cent of GDP) in 2018–19 to $12.2
billion (0.6 per cent of GDP) in 2019–20, remaining at 0.6 per cent of GDP up
to 2021–22 (see Table 6).[13]
Net financial worth, an indicator of fiscal sustainability, has improved
over the forward estimates relative to 2017–18 MYEFO. It is estimated to be
25.4 per cent of GDP in 2018–19, improving marginally to 24.2 per cent of GDP
in 2019–20. Another component of the medium term fiscal strategy is ‘improving
net financial worth over time’. Government projections suggest that net
financial worth will be 7.5 per cent of GDP by 2028–29.[14]
Table 6: net financial worth and
net interest payments
| |
Actual |
Estimates |
Projections |
| |
2017–18 |
2018–19 |
2019–20 |
2020–21 |
2021–22 |
| Net
interest payments ($ billion) |
13.1 |
14.5 |
12.2 |
12.4 |
12.2 |
| Per
cent of GDP |
0.7 |
0.8 |
0.6 |
0.6 |
0.6 |
| Net
financial worth ($ billion) |
–466.3 |
–482.9 |
–482.1 |
–471.3 |
–453.9 |
| Per
cent of GDP |
–25.4 |
–25.4 |
–24.2 |
–22.6 |
–20.9 |
Source: Australian
Government, Budget strategy and outlook: budget paper no. 1:
2018–19, Statement 3, p. 3-16.
Key revenue and expense measures
Table 7 lists the major revenue measures—and Table 8, the
major expense measures—with a significant impact in the 2018–19 Budget.
Table 7: major policies—revenue
measures
| |
2017–18 ($m) |
2018–19 ($m) |
2019–20 ($m) |
2020–21 ($m) |
2021–22 ($m) |
Total ($m) |
| Personal
Income Tax Plan |
– |
–360 |
–4 120 |
–4 420 |
–4 500 |
–13 400 |
| Personal
Income Tax – retaining the
Medicare levy rate at 2 per cent |
– |
–400 |
–3 550 |
–4 250 |
–4 600 |
–12 800 |
| Black
Economy Package – Combatting
Illicit Tobacco |
– |
–15 |
3 251 |
148 |
193 |
3 577 |
| Better
targeting the Research and Development Tax Incentive |
– |
314 |
641 |
764 |
719 |
2 438 |
| Black
Economy Package – New and
enhanced ATO enforcement against the Black Economy |
– |
340 |
467 |
533 |
578 |
1 917 |
| Personal
Income Tax - ensuring individuals meet their tax obligations |
– |
180 |
258 |
277 |
277 |
991 |
| Protecting
Your Super Package – changes to
insurance in superannuation |
– |
– |
224 |
228 |
245 |
697 |
| A
firm stance on tax and superannuation debts |
– |
–149 |
–152 |
–156 |
–160 |
–617 |
| Black
Economy Package – further
expansion of taxable payments reporting |
– |
–4 |
47 |
264 |
299 |
606 |
| Superannuation
– better integrity over
deductions for personal contributions |
– |
89 |
109 |
110 |
120 |
427 |
Source: Australian
Government, Budget Measures: budget paper no. 2: 2018–19, Table 1, pp. 1–6.
Table 8: major policies—expense measures
| |
2017–18 ($m) |
2018–19 ($m) |
2019–20 ($m) |
2020–21 ($m) |
2021–22 ($m) |
Total ($m) |
| Supporting
Our Hospitals – National Health Agreement – public
hospital funding |
– |
–50 |
– |
–331 |
–597 |
–977 |
| Pharmaceutical
Benefits Scheme – new and amended listings |
–17 |
–175 |
–221 |
–255 |
–102 |
–770 |
| Great
Barrier Reef 2050 Partnership Program |
–444 |
–10 |
–5 |
–8 |
–11 |
–478 |
| Remote
Indigenous Housing in the Northern Territory |
– |
–110 |
–110 |
–110 |
–110 |
–440 |
| National
Research Infrastructure Investment Plan – implementation of Government response |
–199 |
–6 |
–26 |
–76 |
–87 |
–393 |
| Funding
to Boost Services in the Northern Territory |
–260 |
– |
– |
– |
– |
–260 |
| More
Choices for a Longer Life – finances for a longer life |
0 |
–21 |
–93 |
–75 |
–70 |
–259 |
| Managing
the Skilling Australians Fund – revised implementation arrangements |
–250 |
– |
– |
– |
– |
–250 |
| National
School Chaplaincy Programme – continuation |
– |
–62 |
–62 |
–62 |
–62 |
–247 |
| Building
Better Regions Fund – round three |
– |
–40 |
–108 |
–48 |
–10 |
–207 |
Source: Australian
Government, Budget Measures: budget paper no. 2: 2018–19, Table 2, pp. 47–68.
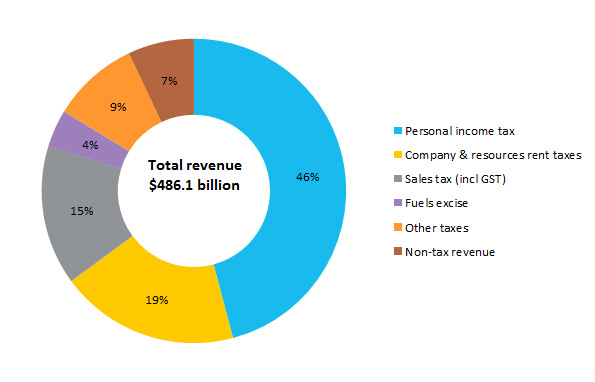
Revenue 2018–19
| |
$b |
Percentage |
| Personal
income tax |
222.9 |
45.9 |
| Company
& resource rent taxes |
92.6 |
19.0 |
| Sales
tax (incl. GST) |
72.1 |
14.8 |
| Fuels
excise |
19.5 |
4.0 |
| Other
taxes |
44.9 |
9.2 |
| Non-tax
revenue |
34.1 |
7.0 |
| Total |
486.1 |
100.0 |
|
Figure
5: revenue in 2018–19
Source: Australian Government, Budget strategy and outlook: budget paper no. 1:
2018–19, Budget overview, 8 May
2018, Statement 6, Appendix A, p. 6-50.
|
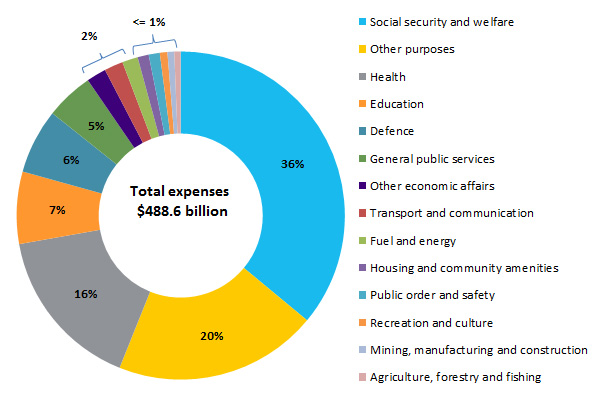
Government expenses by function 2018–19
| Function |
$b |
Percentage |
| Social
security and welfare |
176.0 |
36.0 |
| Health |
78.8 |
16.1 |
| Education |
34.7 |
7.1 |
| Defence |
31.2 |
6.4 |
| General
public services |
23.1 |
4.7 |
| All
other functions |
46.8 |
9.6 |
| Other
purposes |
98.0 |
20.0 |
| Total |
488.6 |
100.0 |
|
Figure 6: expenses by function
Source: Australian Government, Budget strategy and outlook: budget paper no. 1:
2018–19, Budget overview, 8 May
2018, Statement 5, Table 10, p. 5-21.
|
[1] Australian
Government, Budget
strategy and outlook: budget paper no. 1: 2018–19, Statement 3, p. 3-7.
[2].
Ibid.
[3].
D Richardson and B Browne, The
arbitrary 23.9 per cent tax revenue to GDP figure: from a convenient assumption
to a ‘speed limit’, Australia Institute, Briefing note, April 2018;
National Australia Bank (NAB), Federal
Budget 2018–19, May 2018.
[4].
EY, Federal
Budget 2018: Punting on growth, May 2018.
[5].
B Coates and D Wood (Grattan Institute), ‘Budget
2018: built on good fortune, relying on luck’, Inside Story, 9 May
2018.
[6].
Deloitte, The
intersection of politics and prudence: Australian Federal Budget 2018–19,
May 2018.
[7].
Australian Government, Budget
strategy and outlook: budget paper no. 1: 2018–19, Statement 1, p. 1-9.
[8].
Reserve Bank of Australia, Statement
on Monetary Policy, May 2018.
[9].
Australian Government, Budget
strategy and outlook: budget paper no. 1: 2018–19, Statement 6, p. 6-46.
[10].
Ibid., Table 20, p. 6-48.
[11].
Ibid., Statement 11, p. 11-12.
[12].
Ibid., Statement 3, p. 3-16.
[13].
Ibid.
[14].
Ibid., p. 3-17.
All online articles accessed May 2018
For copyright reasons some linked items are only available to members of Parliament.
© Commonwealth of Australia

Creative Commons
With the exception of the Commonwealth Coat of Arms, and to the extent that copyright subsists in a third party, this publication, its logo and front page design are licensed under a Creative Commons Attribution-NonCommercial-NoDerivs 3.0 Australia licence.
In essence, you are free to copy and communicate this work in its current form for all non-commercial purposes, as long as you attribute the work to the author and abide by the other licence terms. The work cannot be adapted or modified in any way. Content from this publication should be attributed in the following way: Author(s), Title of publication, Series Name and No, Publisher, Date.
To the extent that copyright subsists in third party quotes it remains with the original owner and permission may be required to reuse the material.
Inquiries regarding the licence and any use of the publication are welcome to webmanager@aph.gov.au.
This work has been prepared to support the work of the Australian Parliament using information available at the time of production. The views expressed do not reflect an official position of the Parliamentary Library, nor do they constitute professional legal opinion.
Any concerns or complaints should be directed to the Parliamentary Librarian. Parliamentary Library staff are available to discuss the contents of publications with Senators and Members and their staff. To access this service, clients may contact the author or the Library‘s Central Enquiry Point for referral.