Adrian Makeham-Kirchner and Dr Jonathon Deans
In his 2018–19 Budget speech, the Treasurer said that ‘our
$75 billion ten year rolling infrastructure plan will continue—strengthening
our economy, busting congestion in our cities, making rural roads safer and
getting our products to market’.[1]
Budget paper No 1 clarifies that this figure accounts for the period from
2018–19 until 2027–28.[2]
This announcement builds on statements made in the 2017–18 Budget in
which the Treasurer stated the Government had increased total funding and
financing to transportation infrastructure to $70 billion over the years
2013–14 to 2020–21[3]
and projected the delivery of $75 billion in infrastructure funding and
financing from 2017–18 to 2026–27.[4]
The Government states that of the $75 billion package in
2018-19, $24.5 billion is to be funded in 2018–19.[5]
This was clarified by ‘Treasury and Infrastructure department officials’ as
being $4.2 billion on new projects and $17.8 billion to fund existing projects
between 2018–19 and 2021–22.[6]
The actual amount of funding allocated to infrastructure has
been subject to criticism. For example, the Opposition spokesperson for
infrastructure said that, in 2018–19, ‘every project announced in the Budget
will be funded from previous allocations, putting the lie to weeks of
pre-budget hyperbole in which the Government pretended it planned to lift
investment after years of cuts.’[7] Also, Infrastructure
Partnerships Australia (IPA) said ‘Tonight’s Federal Budget sees infrastructure
funding reduced by $2 billion over the forward estimates, meaning less cash for
projects and more congestion for commuters’.[8] Similar issues were
raised in relation to the claims made in the 2017–18 Budget with the Opposition
spokesperson questioning the total and claiming that spending was declining.[9]
This Brief outlines some of the funding mechanisms for
infrastructure; in particular, payments to the states and the use of new
funding mechanisms and challenges that hinder the reconciliation of the
different claims on infrastructure spending.
Payments to the states and territories
Traditionally, the primary mechanism for Commonwealth
support for infrastructure—especially transport infrastructure—has been the
outlay of grants to other sectors, primarily the states and territories. The
Commonwealth makes grants to the states under the Intergovernmental
Agreement on Federal Financial Relations, National
Partnership Agreements,
and Implementation Plans and Project Agreements.[10]
These payments are summarised annually in Budget Paper No. 3, Federal Financial
Relations. The federal financial relations document also summarises untied
local road payments to local governments.
The payments to and through the states are dispersed based
on certain programs, which for 2018–19 includes:
- The Infrastructure Investment Program: covering Black Spot
Projects, the Bridges Renewal Program, Developing Northern Australia—including
Improving Cattle Supply Chains and Northern Australia Roads, the Heavy Vehicle
Safety and Productivity Program, the Major Projects Business Case Fund, the
National Rail Program—including a rail and road component, Roads of Strategic
Importance, Roads to Recovery and the Urban Congestion Initiative.
- The Infrastructure Growth Package: covering the Asset Recycling
Initiative, ‘new investments’, Interstate Road Transport and the Western Sydney
Infrastructure Plan.
- A range of other infrastructure, including for example the
Launceston City Deal–Tamar River, Murray-Darling Basin Regional Economic
Diversification Program, Supporting Drought-Affected Communities Program,
Western Sydney City Deal and WiFi and Mobile Coverage on Trains.
Local road funding to local government is part of the total
financial assistance grants made available to local governments. It is an untied
grant, and is paid in addition to the infrastructure programs outlined.
The Parliamentary Library has mapped the payments made for
these types of infrastructure transfers from the 2013–14 Budget to the 2018–19
Budget.[11]
Over the period from 2014–15 to 2017–18 the payments total $29.5
billion, and over the period from 2018–19 to 2021–22 the expected payments
total $24.3 billion, for a total of $53.8 billion.[12]
The pattern of payments in each of the federal financial relations budget documents,
including the estimated final payment reported for each completed year, are
summarised in Figure 1. It is apparent that the trend in nominal payments is
downwards from 2016–17 until 2021–22. For example, the estimated outcome for 2017–18
is an annual payment of $7.9 billion, which declines to $5.4 billion for the
2021–22 financial year.[13] This reduction appears
to be what Infrastructure Partnerships Australia are referring to in their
commentary noted above, and highlighted by the Opposition spokesperson in media
commentary.[14]
Figure 1: Infrastructure
payments to other levels of Government
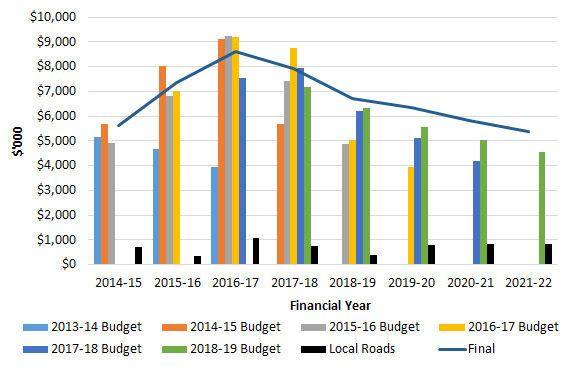
There is no obvious explanation for the reduction in funding,
with almost all components of the three program groups outlined above declining.
Funding mechanisms
Over time new funding mechanisms have been used by the Commonwealth
to support infrastructure projects, beyond traditional transfers to the states.[15]
These mechanisms include:
- Equity investments: akin to buying shares in a business,
the use of which provides direct control over a project’s delivery and
financing risks, and allows for potential future returns from profitable
investments. For example, the 2017–18 Budget included an equity commitment of
$8.4 billion in the Australian Rail Track Corporation Pty Ltd to deliver inland
rail.[16]
- Concessional loans: which provide a financing option to
projects based on a lower interest rate or longer time frame than might be
available in private markets. For example the 2017–18 Budget discussed a $2 billion
concessional loan for the WestConnex project.[17]
- Guarantees: where the Commonwealth accepts responsibility
for defined risk events that would provide an incentive for private investors
to invest. For example, the 2018–19 Budget outlines an indemnity given to the
Moorebank Intermodal Company Limited (MIC) ‘...to cover all costs and liabilities
that may be incurred by MIC in the event that the Commonwealth terminates the
Equity Funding Agreement between the Commonwealth and MIC’.[18]
- Creating funding pools: attributing a pool of resources
that can be drawn upon for a range of related purposes. For example, the 2017–18
Budget outlined the $5 billion Northern Australia Infrastructure Facility.[19]
It is also feasible that some major projects could receive support
by a combination of these mechanisms in hybrid form to manage more complex
risks and financing requirements.
The use of these mechanisms introduces comparability and
counting challenges.
It appears that the Treasurer’s $75 billion total in the 2018–19
Budget includes a combination of the payments to states and the gross value of
commitments using these new mechanisms, as was the case in relation to the 2017–18
infrastructure spending claims. For example, in 2017–18 the then Minister for
Infrastructure and Transport said, in response to criticisms, that ‘others
focus on one component of the infrastructure spend, Payments to Support
State Infrastructure Services. This is part of, but not the same thing as
total infrastructure spending’.[20] In his statement the
Minster confirmed that the total included ‘financing and equity’. It is likely
the same counting has occurred in 2018–19.
Other spending included with the claim may relate to
commitments which are not actually payments. For example, in 2018–19 the
Government identifies ‘quantifiable contingent liabilities’. These include $4.2
billion of commitments, including a $3.0 billion commitment made to the
Victorian East-West Link Project and a $1.2 billion commitment to the Perth
Freight Link Project.[21] The projects are
conditional on the relevant states committing equal funding. Both of these
projects were announced in the 2014-15 Infrastructure
Growth Package and have been in each Budget since 2014-15, with
the WA project getting an additional commitment in the 2015–16 Budget. However,
there has been no actual expenditure.
Projects in the total count
The Parliamentary Library has not been able to identify
project commitments in the Budget documents that equal the Government’s $75
billion total. The various documents published by the Government and the
Department of Infrastructure, Regional Development and Cities provide only
partial information:
- In Budget Paper 2, Part 2: Expense Measures identifies
$116 million in infrastructure spending in 2018–19, with an additional $246
million over the forward estimates.[22] In Budget Paper 3, Table
2.9 identifies $6.3 billion in infrastructure payments to the states in
2018–19, with an additional $15.1 billion over the forward estimates.[23]
- A Budget press release from the Minister for Infrastructure and
Transport identifies $5.0 billion in Commonwealth spending in 2018–19 on
projects with a total Commonwealth contribution of $35.4 billion.[24]
This list excludes a number of programs, such as the Black Spot Projects,
Bridges Renewal Program, and Roads to Recovery, as well as projects funded
through equity (such as Snowy Hydro and Western Sydney Airport) and special
funds (such as the Northern Australia Infrastructure Facility and the National
Water Infrastructure Lending Facility). Projects which do not receive funding
in 2018–19 are also excluded.
- A list of current major projects from the Department identifies
$9.7 billion in Commonwealth spending from 2018–19 onwards, with a total
contribution of $29.7 billion.[25] A number of initiatives
are excluded, including projects which do not receive funding in 2018–19.
- A 10 Year Infrastructure Investment Pipeline list from the
Department identifies $24.6 billion of Commonwealth spending.[26]
It appears that this list includes funding provided in the 2018–19 Budget and
is not completely additional to the list of major projects already underway. As
funding detail is not provided, it is not possible to determine how these lists
interact or the total amount of infrastructure investment.
The Parliamentary Library has been unable to locate any
public document which provides a transparent overview of total infrastructure
commitments. This difficulty is not new. In the 2017–18 Federal Budget the
Treasurer claimed $75 billion in infrastructure spending over 10 years.[27]
The Parliamentary Library was unable to corroborate this figure and the
Department later identified $78.7 billion in infrastructure spending over 10
years in Senate Estimates.[28] The Department may again
provide new information about infrastructure spending commitments in Estimates hearings
on the 2018-19 Budget.
A summary of the different presentations of total
infrastructure expenditure reported outside of the Budget documents is in Annex
A.
Concluding comments
The 2018–19 Budget Papers reveal $24.3 billion in transfer
payments to other governments for infrastructure. They exclude funding
information for the years 2022–23 to 2026–27. While there is a range of
projects discussed there is no information on the published record that
outlines how the $75 billion commitment is measured.
In 2016, Infrastructure Australia wrote ’infrastructure
spending is dispersed according to often overlapping purposes of different
funding pools... There is also a lack of transparency about how much is being
spent and what it is being spent on. The community cannot access basic
information regarding Australian Government spending on infrastructure.’[29]
This appears to remain the case in 2018–19, with spending split between
traditional payments to the states, various new financing mechanisms and the
use of contingent commitments that do not attach to actual payments.
ANNEX A: References to infrastructure expenditure in related documents
| Reference |
Source |
Timeframe reported |
| No timeframe |
2013–14 to 2021–22 |
2018–19 |
2018–19 onwards |
2018–19 to 2026–27 |
| $m |
$m |
$m |
$m |
$m |
| 10 Year Infrastructure Pipeline |
a |
— |
— |
— |
— |
24 582.6 |
| Map of Pipeline projects |
b |
24 181.6 |
— |
— |
— |
— |
| Current Major Projects |
c |
29 727.7* |
— |
— |
9 744.6 |
— |
| Budget 2018–19: Key Projects** |
d |
— |
35 425.6 |
5 035.17 |
— |
— |
| Busting Congestion. Connecting our
regions. Improving Safety*** |
e |
56 999 |
— |
— |
— |
— |
Notes:
* Reported as ‘total’, including concessional loans, equity
and commercial-in-confidence values
** The key projects exclude road maintenance funding, Black
Spot Projects, Bridges Renewal Program, Heavy Vehicle Safety and Productivity
Program, Roads to Recovery or Untied Local Grants
*** Includes ‘major projects underway’, ‘new national
initiatives’ and the funding amounts linked to the printed map.
Sources:
a. Department
of Infrastructure, Regional Development and Cities, Strengthening Australia’s cities and
regions: The Australian Government’s 10 Year Investment in Infrastructure, May 2018, p.4.
b. Department
of Infrastructure, Regional Development and Cities, Strengthening
Australia’s cities and regions: The Australian Government’s 10 Year Investment
in Infrastructure, May 2018, pp. 8–9.
c. Department
of Infrastructure, Regional Development and Cities, Strengthening
Australia’s cities and regions: The Australian Government’s 10 Year Investment
in Infrastructure, May 2018, p. 32.
d. M McCormack
(Deputy Prime Minister and Minister for Infrastructure and Transport), 2018–19 Budget—Infrastructure:
Busting Congestion, Connecting Our Regions, Improving Safety and Creating Jobs, media release, 8 May 2018.
e. Infographic
in Australian Government, Budget 2018–19: Stronger growth to create
more jobs, pp.
34–35.
[1] Australian Government, Budget
speech 2018–19.
[2] Australian Government, Budget
strategy and outlook: budget paper no.1: 2018–19, Statement 1, p. 1–18.
[3] Australian
Government, Budget strategy and outlook: budget paper no.1: 2017–18, Statement 1, p. 1–1.
[4] Ibid., p. 1–11.
[5] Australian Government, Budget
strategy and outlook: budget paper no.1: 2018–19, Statement 1, p. 1–18.
[6] P Karp, ‘Roads
get $4.5bn in Australia budget but rail spending forced to wait’, The Guardian, 8 May 2018.
[7] A Albanese (Shadow
Minister for Infrastructure, Transport, Cities and Regional Development), Infrastructure
con job laid bare in budget fine print, media release, 9 May 2018.
[8] Infrastructure
Partnerships Australia, Feds
warm infrastructure narrative has not been met by cold hard cash, media
release, May 2018.
[9] A Albanese (Shadow Minister for
Infrastructure, Transport, Cities and Regional Development), Turnbull avoids
truth about his big cuts to infrastructure investment, 10 May 2017.
[10] See, the Council on Federal Financial
Relations, http://www.federalfinancialrelations.gov.au/.
[11] Some minor one-off
payments such as ‘Supplementary funding to South Australia for local roads’ are
excluded. This measure accounts for $40 million over 2017–18 and 2018–19.
[12] Assuming the estimated
actual figure is representative of the actual expenditure in the year prior to
a Budget year, based on Australian Government, Federal financial relations:
budget paper no.3, for the years 2013–14 until 2018–19, typically Table 2.9.
[13] Australian Government, Federal
financial relations: budget paper no.3: 2018–19, Table 2.9, p 45.
[14] A Albanese (Shadow
Minister for Infrastructure, Transport, Cities and Regional Development), Transcript
of television interview: Sky News with Samantha Maiden: 10 May 2018:
by-elections, mayo preselection, citizenship, single parent families, boat
turnbacks, ALP National Conference, media release, 10 May 2018
[15] Australian Government, Budget
strategy and outlook: budget paper no.1: 2018–19, Statement 4, p. 4-13.
[16] Australian
Government, Budget strategy and outlook: budget paper no.1: 2017–18, Statement 4, p. 4–9.
[17] Australian
Government, Budget strategy and outlook: budget paper no.1: 2017–18, Statement 3, p. 3–13.
[18] Australian Government, Budget
strategy and outlook: budget paper no.1: 2018–19, Statement 9, pp.9–15.
[19] Australian
Government, Budget strategy and outlook: budget paper no.1: 2017–18, Statement 3, p. 3–13.
[20] P Fletcher (Minister for Urban
Infrastructure) and D Chester (Minister for Infrastructure and Transport), 2017–18 Budget papers reveal record
spending on infrastructure, media release, 11 May 2017.
[21] Australian Government, Budget
strategy and outlook: budget paper no.1: 2018–19, Statement 9, pp.9–8 and 9–33
to 9–34.
[22] Australian Government, Budget
strategy and outlook: budget paper no. 2: 2018–19, Part 2, pp. 136–149.
[23] Australian Government, Budget strategy
and outlook: budget paper no. 3: 2018–19, Part 2, p. 45.
[24] M McCormack (Deputy Prime
Minister and Minister for Infrastructure and Transport), 2018–19
Budget–Infrastructure: busting congestion, connecting our regions, improving safety
and creating jobs, ministerial budget statement, 2018.
[25] Australian Government, Strengthening
Australia’s cities and regions, p. 32.
[26] Australian Government, Strengthening
Australia’s cities and regions, p. 4.
[27] S Morrison (Treasurer), Budget
Speech 2017–18.
[28] Senate Rural and Regional
Affairs and Transport Legislation Committee, Answers to Questions on Notice,
Infrastructure and Regional Development Portfolio, Budget Estimates 2017–18, Question
26, accessed 16 May 2018.
[29] Infrastructure Australia,
Australian
Infrastructure Plan, 2016, p 23.
All online articles accessed May 2018
For copyright reasons some linked items are only available to members of Parliament.
© Commonwealth of Australia

Creative Commons
With the exception of the Commonwealth Coat of Arms, and to the extent that copyright subsists in a third party, this publication, its logo and front page design are licensed under a Creative Commons Attribution-NonCommercial-NoDerivs 3.0 Australia licence.
In essence, you are free to copy and communicate this work in its current form for all non-commercial purposes, as long as you attribute the work to the author and abide by the other licence terms. The work cannot be adapted or modified in any way. Content from this publication should be attributed in the following way: Author(s), Title of publication, Series Name and No, Publisher, Date.
To the extent that copyright subsists in third party quotes it remains with the original owner and permission may be required to reuse the material.
Inquiries regarding the licence and any use of the publication are welcome to webmanager@aph.gov.au.
This work has been prepared to support the work of the Australian Parliament using information available at the time of production. The views expressed do not reflect an official position of the Parliamentary Library, nor do they constitute professional legal opinion.
Any concerns or complaints should be directed to the Parliamentary Librarian. Parliamentary Library staff are available to discuss the contents of publications with Senators and Members and their staff. To access this service, clients may contact the author or the Library‘s Central Enquiry Point for referral.