Geoff Gilfillan, Statistics and Mapping
Key issue
Wage growth in the past decade has been much weaker than the previous decade and it has been forecast that wage growth will not keep pace with inflation in the short to medium term.
The gender wage gap has narrowed since 2014 due to stronger growth in wages for women compared with men. Gender wage gaps tend to be smaller for younger age groups and wider between the ages of 35 and 54 years.
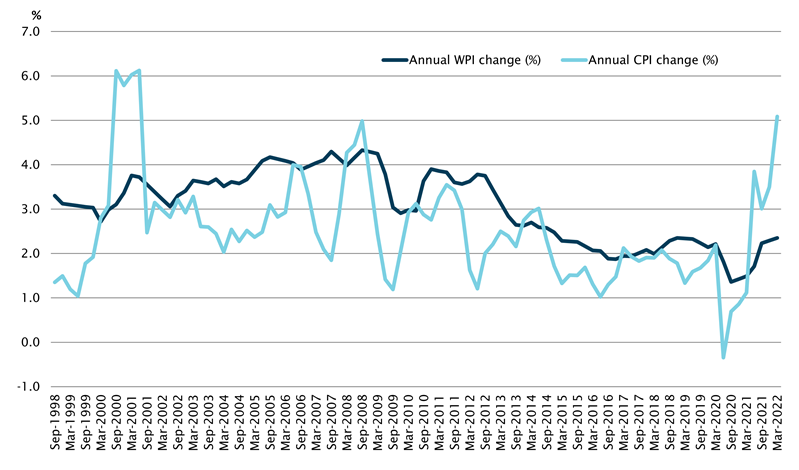
Australia experienced a
protracted slowing in the rate of wage growth as measured by the Australian
Bureau of Statistics (ABS) Wage Price Index (WPI), from 3.8% per annum (in
seasonally adjusted terms) in September 2012 to 1.4% per annum in September
2020.
While the rate of wage
growth has shown signs of a steady but modest recovery to 2.4% in March 2022, it
has been forecast that wage growth may not keep pace with the Consumer Price Index (CPI), which stood at 5.1% in
March 2022 (see Figure 1). The underlying inflation rate, which excludes more
volatile price changes, was sitting at 3.7% in March 2022.
This combination of elevated
inflation and modest wage growth is likely to contribute to a decline in real
wages in the short to medium term, impacting on standards of living for
Australian households. Treasury forecasts provided in Table 1.1 of Budget paper no.1 2022-23 show wage growth well below the rate of inflation in 2020-21
and 2021–22, but slightly outpacing the CPI in 2022–23.
Figure 1 Annual
change in Wage Price Index (WPI) and Consumer Price Index (CPI)
Source:
Australian Bureau of Statistics (ABS), Wage Price Index, Australia, Table 1 (seasonally adjusted data) (Canberra: ABS, 2022).
Several
factors contributed to the slowing in the rate of wage growth in the decade
to September 2020 including:
- excess capacity in the labour market indicated by persistent rates
of underemployment (despite a steady fall in the unemployment rate)
- a fall in inflationary expectations which contributed to a lowering
of wage demands
- restrictions imposed on the magnitude of wage increases in the
public sector
- protracted enterprise bargaining negotiations for agreements of large
enterprises in retail and hospitality, as well as government departments and
agencies, which acted as a freeze on wages for affected workers
- progressively declining rates of growth in labour productivity
- the shift in employee coverage from collective agreements to awards
- impact on employee bargaining power due to declining rates of union
membership and restrictions on use of industrial action.
Stagnating wage growth was
common among many OECD (Organisation for Economic Cooperation and Development) countries in the decade or so prior
to the impact of the COVID-19 pandemic in March 2020. Wage growth failed to
rise significantly in many countries despite steadily falling levels of unemployment
and moderate rates of labour productivity growth since the global financial crisis
of 2008.
More recently, in
September 2020 the Australian Government capped Australian Public Service employee wage rises to change
in the WPI of the private sector. While private sector wages were growing at a
lower rate than public sector wage rises in the decade prior to September 2020,
there has since been a shift to greater percentage increases in the private sector
WPI compared with the public sector.
Falling
rates of unemployment and underemployment more recently are contributing to
greater tightness in the labour market. A restriction on migration during the
pandemic has also slowed growth in the labour supply, exacerbating the
imbalance between demand for and supply of labour. Job vacancies are well above their pre-pandemic levels and there is
evidence of emerging or persistent skill shortages. A recent surge in the inflation rate may trigger an increase in inflationary expectations, which could be factored in to future wage demands. The combination of these factors could be expected to
drive stronger wage growth in the short to medium term.
ABS data from the Employee
Earnings and Hours survey indicates the shift from employee coverage by
collective agreements to awards in setting pay and conditions shows no sign of
slowing. Around 37% of employees (excluding owner managers of incorporated
enterprises) had their wages and conditions determined through collective
bargaining in May 2021- down from 43% in May 2010. In contrast the share of
employees covered by awards increased from 15% to 24%. Wages for employees covered by collective agreements
tend to be higher than for employees covered by awards.
Wage growth in the past decade
has been much weaker than in the previous decade. The WPI grew by an annual
average of 2.3% in the 10 years between March 2012 and March 2022 (using a Compound Annual Growth Rate (CAGR) formula) and by an annual average of 0.1% in real terms (when
adjusted for inflation). In the previous 10 years the WPI grew by an annual
average of 3.8% and by an annual average of 1.0% in real terms.
Industry wage growth over
the last decade has been led by service industries
Average annual growth in
wages more than halved in the decade to March 2022 compared with the previous
decade in male-dominated industries such as Mining (down from 4.5% to 2.0% in
original terms) and Construction (down from 4.3% to 2.1%). In contrast, the average
rate of growth in wages increased in female-dominated industries such as Education
and Training (up from 2.5% to 4.3% per annum) and Health Care and Social
Assistance (up from 2.6% to 3.9% per annum).
In the 12 months to March
2022, industry wage growth as measured by the WPI was strongest in Rental,
Hiring and Real Estate Services (at 3.1%). Manufacturing, Information, Media
and telecommunications, and Professional, Scientific and Technical Services, all
recorded wage growth of 2.7% in the 12 months to March 2022. Wage growth was
weakest in Electricity, Gas, Water and Waste Services at 1.5%, and Mining at 1.8%.
The recent result for Mining contrasts with the strong wage growth recorded in
the decade to March 2012.
Tasmania and the ACT have
the strongest wage growth of the states and territories
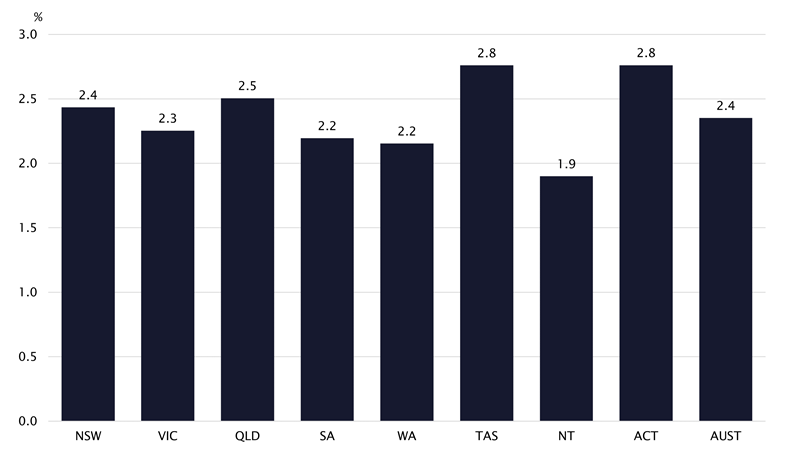
In terms of regional wage
growth performance, in the 12 months to March 2022 wage growth was strongest in
the ACT and Tasmania (both up 2.8%) and weakest
in the Northern Territory (up 1.9%).
Figure 2 Annual
change in WPI in states and territories, 12 months to March 2022
Source:
ABS, Wage Price Index, Australia, Table 2b (original estimates that
haven’t been seasonally adjusted or trended) (Canberra: ABS, 2022).
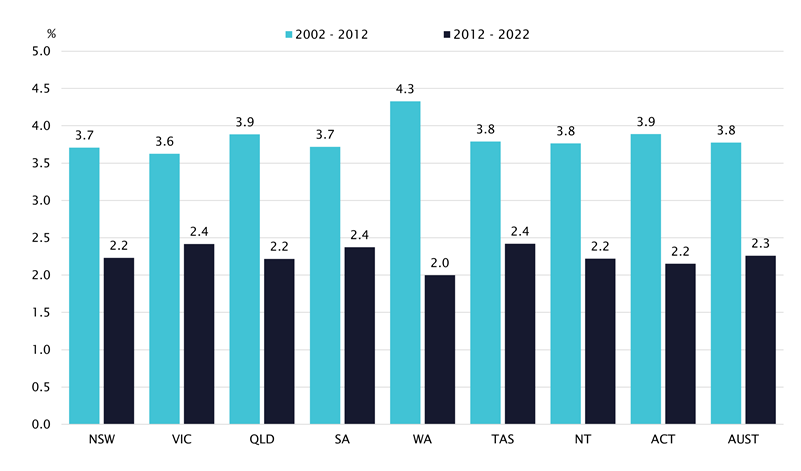
Figure 3 shows the average
annual change in the WPI by state and territory in the past 2 decades. Western
Australia has experienced the biggest decrease, more than halving from an
annual average of 4.3% between March 2002 and March 2012 to just 2.0% in the
decade to March 2022. This outcome is linked with the impact of contraction in wage
growth in the mining sector.
Figure 3 Average
annual change in WPI in states and territories, decade to March 2012 and decade
to March 2022
Source:
ABS, Wage Price Index, Australia, Table 2b (Original estimates) (Canberra: ABS, 2022).
Other sources of wage
data
The ABS Weekly payroll jobs and wages in Australia data series (sourced from business records sent to
the Australian Taxation Office) shows much stronger growth in wages in
the 12 months to 16 April 2022.
The total wage bill in
Australia for all businesses that used Single Touch Payroll (STP) technology was up 7.4% in the 12 month period. The
results from this data source are heavily influenced by factors such as total
hours worked per week. Hours worked has been fluctuating in the past 2 years in
response to business lockdowns and re-openings following measures introduced to
limit the spread of COVID-19. In contrast, the WPI looks at the changing price
of labour unaffected by changes in the quality and quantity of work performed,
while average weekly earnings (AWE) describes changes in theaverage earnings of employees.
The STP wage bill for
younger people aged 15 to 19 years experienced the biggest increase in the 12
months to 16 April 2022 (up 18.9%) while the increase in the wage bill for
women was double the wage bill increase for men (up 9.4% and 4.7% respectively).
By industry, the wage bill for Mining increased the most (at 17.9%) followed by
Professional, Scientific, and Technical Services (up 11.8%). In contrast the
wage bill fell for Construction (by 1.2%) and for Accommodation and Food
Services (by 1.6%).
The gender wage gap
The gender wage gap is calculated as the difference
between earnings of males and females expressed as a percentage of male
earnings. The gap can be estimated using either weekly or hourly earnings,
noting that weekly earnings are influenced by average hours worked by males and
females.
Average weekly earnings for all employees
have not been used as a measure of the gender wage gap as the estimates are
heavily influenced by the much higher proportion of females working part-time
compared with men. For example, in April 2022 ABS
Labour force survey data showed just under 44% of employed females worked
part-time compared with just over 18% of employed males.
Average female weekly earnings for all female
employees are much lower relative to men due to the impact of lower weekly earnings
received by female employees working part-time hours. In comparison average
male weekly earnings are influenced by the much higher proportion of men
working full-time hours. In November 2021, average
weekly total earnings for all male employees stood at $1,577.10 which
compared with an average of $1,093.80 for all female employees- equivalent to a
gap of $483.30 or 30.6%.
One measure of the gender wage gap frequently
cited by the Workplace Gender Equality Agency (WGEA) and reported in the
media is Average Weekly Ordinary Time Earnings (AWOTE) for adult employees
working full-time. While this measure enables comparisons between male and
female employees working similar full-time hours, and the data available
enables comparisons since the mid-1990s, it excludes from the analysis part-time
workers, who accounted for around 30% of all employed people in April 2022.
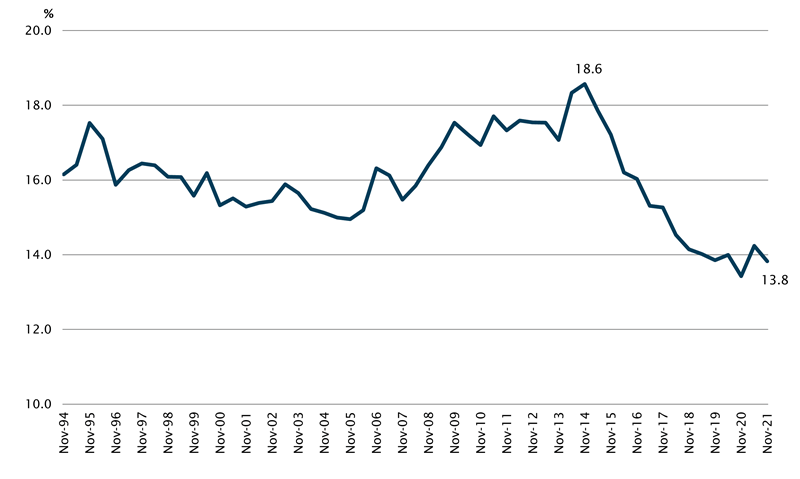
Data from the ABS
Average weekly earnings survey shows growth in wages for women working
full-time hours has been stronger than wage growth for men working full-time over
the 7 years to November 2021. AWOTE for adult females working full-time
grew by an annual average of 3.0% (in original terms) between November 2014 and
November 2021, compared with annual average growth of 2.2% for adult males
working full-time. This has contributed to a reduction in the gender wage gap using
this measure from 18.6% in November 2014 to 13.8% in November 2021 (see Figure 4).
Figure 4 Gender
wage gap, Average Weekly Ordinary Time Earnings (AWOTE)
for adults working full-time hours, November 1994 to November 2021
Source:
ABS, Average Weekly Earnings, Australia, Table 3 (Canberra: ABS, 2022).
The gender pay gap is higher in the private sector (17.0% in November 2021) and lower in the public
sector (11.2%). And gaps are much higher in industries such as Professional,
Scientific and Technical Services and Financial and insurance services (at
24.4% and 20.6% respectively), compared with Public Administration and Safety
(8.5%).
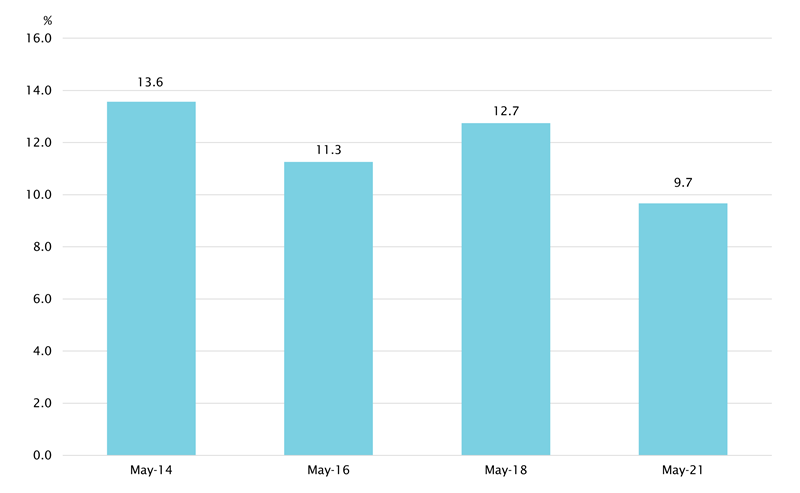
Another indicator of the
extent of the gender wage gap is the difference in average hourly total cash
earnings provided in the ABS Employee earnings and hours (EEH) data series. This series also shows signs of a narrowing
in the gender wage gap for non-managerial employees from 13.6% in May 2014 to
9.7% in May 2021 (see Figure 5). The benefit of this measure is it includes all
non-managerial employees regardless of the number of hours they worked.
However, the gender gap hourly measures can only be calculated every 2 to 3
years when EEH data is published by the ABS.
Figure 5 Gender
wage gap, average hourly
total cash earnings, May 2014 to May 2021
Source:
ABS, Employee Earnings and Hours, Australia, Data cube 4 Table 1 (Canberra: ABS, 2022).
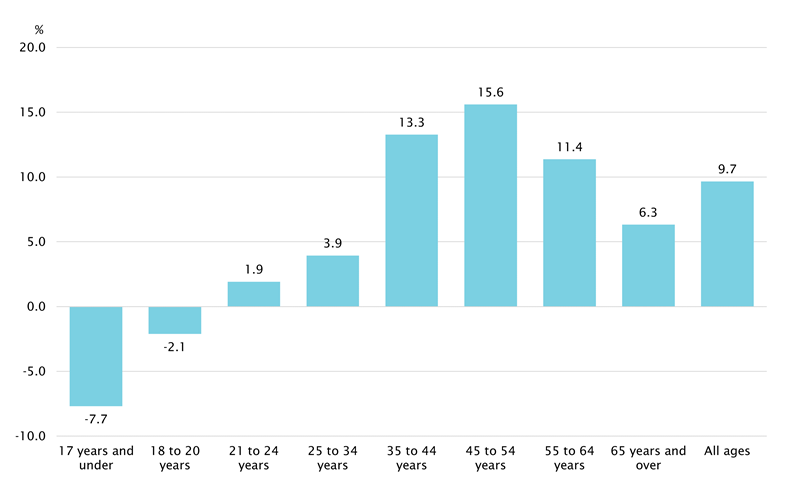
Gender pay gaps as measured by average hourly total
cash earnings for non-managerial employees change over the life cycle. Gaps
tend to be smaller for younger age groups and wider for middle and older age
groups (see Figure 6). There was a small wage gap in favour of women aged 17
years and under and women aged 18 to 20 years (of 7.7% and 2.1% respectively) in
May 2021 and relatively small gaps in favour of men aged 21 to 24 years (1.9%)
and 25 to 34 years (3.9%). The gap in favour of men continues to widen up to
15.6% for those aged 45 to 54 years but then narrows slightly for people in
older age groups.
These differences are consistent with women becoming
more highly educated which narrows the gap for younger age groups or skews gaps
in favour of women. Women are more likely than men to leave the workforce after
the age of 30 to have and care for children. Women are also more likely to
reduce their hours when they return to work to enable the balancing of care and
work responsibilities.
Figure 6 Gender
wage gap over the life cycle, non-managerial employees average hourly total cash earnings, May
2021
Source:
ABS, Employee Earnings and Hours, Australia, Data cube 4 Table 2 (Canberra: ABS, 2022).
National minimum wage continues to fall as a
proportion of median wages
The national minimum wage (NMW) is set at a level that
seeks to incentivise people to look for work, protect the living standards of
low paid workers, and minimise potential negative employment effects of higher
wage costs on the demand for labour.
The NMW is set by the Fair Work Commission (FWC),
following an Annual
wage review by an Expert Panel in which it considers submissions provided
by a range of stakeholders including the Australian Council of Trade
Unions (ACTU) and the Australian Chamber of Commerce and Industry (ACCI). In making decisions on a safety net of fair minimum wages, the panel
considers the
following criteria as part of its ‘minimum wage objective':
- the performance and competitiveness of the national economy,
including productivity, business competitiveness and viability, inflation and
employment growth
- the need to promote social inclusion through increased workforce
participation
- relative living standards and the needs of the low paid
- principles of equal remuneration for work of equal or comparable
value
- the need to provide a comprehensive range of fair minimum wages to
junior employees, employees to whom training arrangements apply and employees
with a disability.
In its submission to the 2021–22 Annual wage review the
ACTU emphasised the position taken by the ACTU Congress that the NMW should be
a ‘living wage’ which acts to ‘reduce
poverty and inequality, improve the absolute and relative living standards of
workers that rely on awards, and reduce the gap between award and agreement’
(p. 1).
In contrast, the ACCI’s
submission to the Annual wage review did not consider the minimum wage to be a ‘suitable tool for
delivering higher living standards to low paid employees’. Instead, the
employer group considered the tax and transfer system to be ‘a far more
effective mechanism to deliver sustainable changes when merited’ (p. 5).
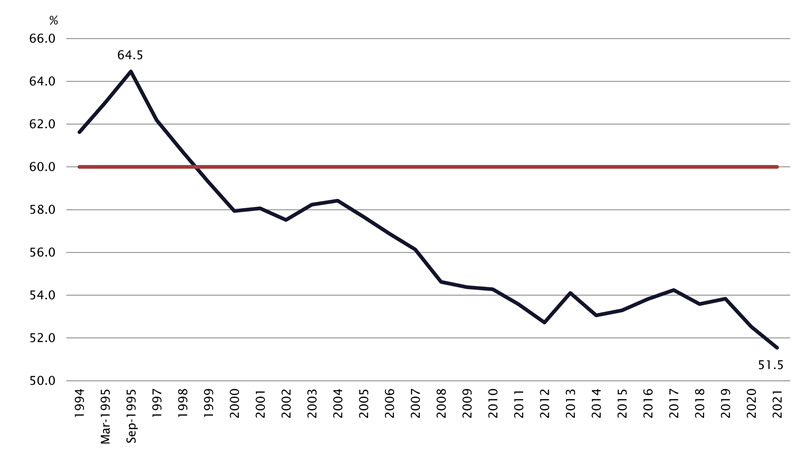
The ACTU stated in its
submission that the NMW is getting further and further away from delivering a
living wage, defined as ‘anyone working full time but earning less than 60% of
full-time median earnings’ (p. 1).
Figure 7 shows trends in what is known as the minimum ‘wage bite’ or
the NMW expressed as a percentage of median wages of full-time workers. The
minimum wage bite fell from a peak of 64.5% in September 1995 to 52.7% in 2012,
increased slightly to 53.8% in 2019, but has since fallen to 51.5% in 2021.
Figure 7 Minimum
wage bite, 1994 to 2021
Source: ABS, Weekly
Earnings of Employees (Distribution), Australia and Employee Earnings,
Benefits and Trade Union Membership, Australia, (Canberra: ABS,
1993 to 2003); ABS, Characteristics
of Employment, Australia, (Canberra: ABS,
2004 to 2021); Fair Work Commission (FWC), Annual
wage reviews, (Canberra: FWC, various years).
The newly elected Government, in its new
submission to the Fair Work Commission Annual wage review of 3 June 2022 ‘recommends
that the Fair Work Commission ensures that the real wages of Australia’s low-paid
workers do not go backwards’ noting that inflation is at a 21-year high of 5.1%.
While the Government did not suggest a quantum for the increase in the minimum
wage, the tone of the submission suggested that the increase awarded by the FWC
should be sufficient to maintain the real wages of low paid workers who are
more vulnerable to rising inflation. The ACCI supported an increase of up to 3%
in the NMW in its Reply
Submission while the ACTU sought an increase of 5.5% in its Reply
Submission.
In its decision
released on 15 June 2022 the Expert Panel of the FWC awarded ‘an increase
of $40 to the NMW, which amounts to an increase of 5.2 per cent. The NMW will
be $812.60 per week or $21.38 per hour’. The Panel observed that this level of increase will protect the real
value of the wages of the lowest-paid workers.’ This will come into effect on 1 July 2022. The Panel also decided to
‘increase modern award minimum wages by 4.6 per cent subject to a minimum
increase for adult award classifications of $40 per week. The $40 per week
increase is based on a 38-hour week for a full-time employee.’ According to the
Australian Government submission provided on 1 April 2022 there
were an estimated 184,000 adult employees paid at the national minimum wage
rate in May 2021 and 2.6 million Australian workers covered by awards.
The Australia
Institute has estimated that at least one-third of Australian employees
work for wages that are directly or indirectly linked to the changes in wages
specified as a result of the Annual wage review.
International minimum
wage comparisons
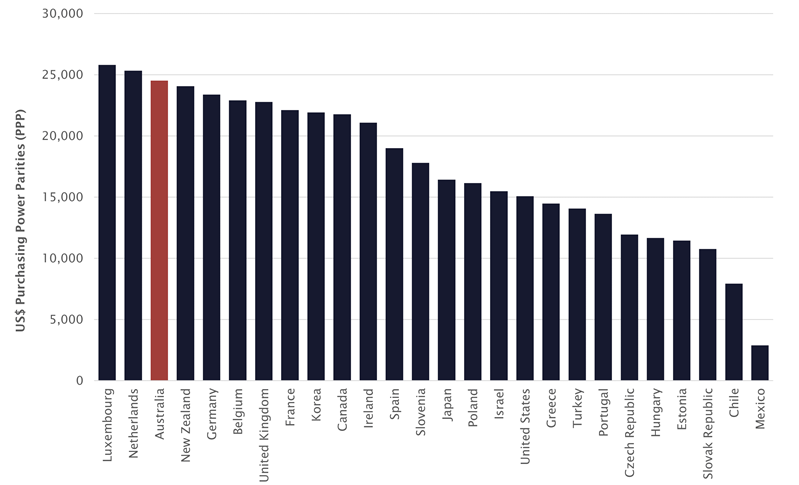
Australia had the third highest
annual minimum wage (behind Luxembourg and the Netherlands) among the 26 OECD
countries that reported the size of their minimum wage in 2020 (as
measured by the OECD in US dollars Purchasing Power Parities (PPP)). The annual minimum wage in the US in 2020 was 38.5%
lower than it was in Australia in 2020.
Figure 8 Annual
minimum wage for OECD countries, 2020
Source:
OECDStat
Conclusion
Slowing in the rate of
wage growth has been a major focus of media and political attention and has
become even more prominent given the recent increase in the inflation rate due
to several compounding factors. The prospects for increases in wage growth are
contingent upon whether tightness in the labour market- as demonstrated by
falling unemployment and underemployment rates, very high numbers of job
vacancies and emerging skill shortages- translates into wage rises. The new
Australian Government is supporting an increase in the national minimum wage, which is likely to flow through to all employees covered by awards (which
accounts for a growing share of all employees), as well as other employees.
Further reading
Andrew Stewart, Jim Stanford and Tess Hardy, The Wages Crisis: Revisited (Canberra: Australia Institute, 2022).
Geoff Gilfillan, The Extent and Causes of the Wage Growth Slowdown in Australia, Research paper series, 2018–19, (Canberra: Parliamentary Library, 2019).
The Treasury, Analysis of Wage Growth, (Canberra: Treasury, 2017).
Workplace Gender Equality Agency, Australia’s Gender Pay Gap Statistics, 8 March 2022.
Back to Parliamentary Library Briefing Book
For copyright reasons some linked items are only available to members of Parliament.
© Commonwealth of Australia

Creative Commons
With the exception of the Commonwealth Coat of Arms, and to the extent that copyright subsists in a third party, this publication, its logo and front page design are licensed under a Creative Commons Attribution-NonCommercial-NoDerivs 3.0 Australia licence.