Michael Klapdor, Social Policy
Key issue
The government response to COVID-19 saw unprecedented levels of income support provided to Australians including increased rates, new payments, and expanded eligibility. The use of ad hoc, temporary changes suggests the design of the social security safety net may need to be reconsidered to ensure it can withstand future economic shocks. Long-standing concerns with the adequacy of some payment rates and eligibility criteria have also re-emerged as COVID-19 supports were withdrawn. Addressing these issues at a time when the Government is looking to restrain expenditure will be difficult.
The level and accessibility of Australia’s social
security and family assistance support systems will persist as key issues for
the 47th Parliament. Around 9.4 million Australians accessed payments or
concession cards from
Centrelink in 2020–21 (p. xiii). Social security, veterans and family
assistance payments make up around 25% of government expenditure- estimated
at around $155 billion in 2021–22 (based on Budget
strategy and outlook: budget paper no. 1: 2022–23, pp. 144;
154–158).
This article examines trends, issues and election
commitments in 3 key areas: income support for working-age people, the Age
Pension and family assistance.
Working-age income support
In 2019, the proportion of the population aged
15–64 receiving means-tested income support payments had reached 13.2%- its
lowest level in 40 years (Figure 1). By June 2020, following the arrival of
COVID-19 in Australia and the implementation of policies aimed at containing
the virus and supporting
those affected by the resulting economic downturn, the proportion of the
working-age population receiving payments had reached 18.6%.
Figure 1 shows that while high, the 2020 level did
not reach the high point achieved following the early-1990s recession when
almost a quarter of this age group received government income support. However,
the 2020 numbers would have been much higher were it not for enacted policy
measures, particularly the JobKeeper wage subsidy
paid to employers. Around 3.6 million individuals were subsidised through
JobKeeper in June 2020. If those aged 65 and over (around 230,000 people) and
those receiving another income support payment (around 130,000 people) are
excluded, JobKeeper recipients represented around 20.1% of the working age
population. In total, an estimated 38.7% of the population aged 15–64 was
receiving government income support in mid-2020.
Figure 1 Income
support recipients as a % of estimated resident population aged 15–64
Notes: Data is
at June unless point-in-time data unavailable in source. Excludes JobKeeper and
disaster payments. ‘Low workforce attachment’ includes female Age Pension
recipients aged under 65 years, payments for widows, Bereavement Allowance
(merged into JobSeeker Payment from March 2020), Mature Age Allowance, Partner
Allowance from 1996 and a percentage of estimated dependent partners of
allowance payment recipients 1978–94. ‘Veterans’ includes Service Pension and
Income Support Supplement. Estimates for some populations follow methodology
used in sources.
Sources:
Parliamentary Library calculations based on Department of Social Services (DSS),
‘DSS
Demographics’, and predecessor departments’ statistical papers, Department
of Veterans’ Affairs, ‘Pensioner
summary statistics’, from 2000 onwards; and Department of Education annual
reports. Latest source available assumed to be most accurate where published
data varies. Population data from Australian Bureau of Statistics (ABS), National,
State and Territory Population, (ABS: Canberra, September 2021), Table
59.
The pre-COVID low point in income support receipt
arose from improvements in the labour market and policy
decisions under consecutive governments (pp. 56–57), including:
- an increase in the Age Pension qualifying age for women
- the phasing-out of payments primarily aimed at dependent partners
such as widow and wife pensions
- restricting eligibility for the Parenting Payment to those with younger
children and introducing activity requirements for recipients of this payment
- new qualification requirements for the Disability Support Pension and a
changed method for assessing impairment levels.
In June 2021, while social security payment
recipient numbers declined, the Government introduced a new COVID-19
Disaster Payment to support those affected by state and territory
government COVID-19 lockdowns. By December 2021, around 2.4 million individuals
had received
the COVID-19 Disaster Payment. Factoring in this payment (but excluding the
180,000 recipients receiving
the COVID-19 Disaster Payment and another income support payment from
Centrelink, p. 18) indicates close to 28.7% of the working-age population
were receiving income support in the second half of 2021.
Does the safety net need a rethink?
The use of ad hoc, temporary income support changes
in response to COVID-19 suggests the design of the social security safety net
may need to be reconsidered to ensure it can withstand future economic shocks. These
temporary
changes included (pp. 5–13):
-
the effective doubling of unemployment benefit
payment rates
-
newly created payments
- expanded eligibility conditions
- eased claim requirements to minimise wait-times
and administrative burdens
-
multiple lump-sum payments to boost other income
support recipients’ rates.
Underlying this response to COVID-19 was a lack of
any permanent job
retention scheme in Australia and long-standing issues with the
adequacy of existing payments and their eligibility
conditions.
Some
researchers have suggested the government response to COVID-19 has ‘opened
up the policy space for a more detailed consideration of innovative reform’
such as universal basic income and unemployment
insurance. The Australian
Green’s 2022 election platform included a significant lift in social
security payment rates with reduced conditionality as part of its ‘liveable
income guarantee’ policy. In 2021, the New
Zealand Government announced it would develop a ‘social unemployment
insurance scheme’. New Zealand and Australia currently stand apart
internationally by relying entirely on flat-rate means-tested systems of unemployment
payments rather than contribution-based insurance systems. Neither the
Coalition nor the ALP proposed major changes to working-age income support
policy at the 2022 election.
Many of the COVID-19 response measures were
delivered outside of legislated frameworks. The COVID-19 Disaster Payment and
Pandemic Leave Disaster Payment were authorised
as grant payments through legislative instruments rather than via
legislation (pp. 8–10). Around $14.5 billion was delivered through these
programs but eligibility criteria and payment rate details were left to outdated
grant guidelines that did not reflect policy changes. Similarly, additional payments
to people affected by the early 2022 NSW floods were delivered as grant programs
rather than disaster
payments provided for in the Social Security Act 1991. Not
addressing issues with the existing safety net through Parliament risks the Executive
turning to similar ad hoc, unscrutinised measures during future crises or
disasters.
Age Pension
Income support for the aged is the largest
component of social
security spending, representing over a third of payments in 2022–23 at
$54.2 billion. In
December 2021, a total of 2,556,063 people received the Age Pension and around 110,000
people aged over 65 received the Service Pension or other means-tested pensions
paid by the Department
of Veterans’ Affairs (DVA).
COVID-19 response measures for pension recipients
included 4
lump-sum payments (p. 131) followed by a $250 ‘Cost of Living Payment’ in
the 2022–23
Budget. There were few significant changes to the Age Pension in the 46th
Parliament, although the Morrison Government attempted to change
the residency requirements for pensions and stop supplement payments for
pensioners temporarily travelling overseas for 6 weeks.
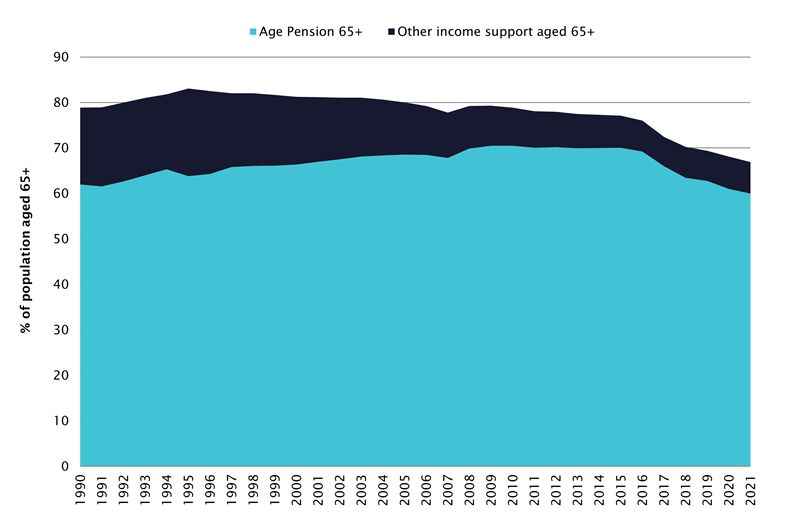
Since 2011 the proportion of Australians aged 65
years and over receiving the Age Pension has dropped significantly, from around
70% to around 60% in 2021 (Figure 2). This is a result of policy changes
including the gradual increase in the Age Pension age (increasing
from 65 in 2017 to 67 by 2023); asset
test changes which commenced in 2017; and increased superannuation balances
and other investments reducing the number of people eligible under the pension means
tests.
Figure 2 Income
support recipients aged 65+ as a % of estimated resident population aged 65+
Notes: Other income
support includes Disability Support Pension, Carer Payment, Service Pension and
Income Support Supplement and closed payments such as Wife Pension but excludes
Widow Allowance due to lack of data for 1990–99. Data is for June of each year.
March 2000 data used for veterans’ payments.
Sources:
Parliamentary Library calculations based on DSS and DVA statistical
publications, and ABS, National,
State and Territory Population, (ABS: Canberra, September 2021), Table
59.
Retirement Income Review
Age Pension policy was considered as part of the
Treasury’s Retirement income review. The Review’s final report,
released on
20 November 2020, observed:
The Age Pension, combined with other support
provided to retirees, is effective in ensuring most Australians achieve a
minimum standard of living in retirement in line with community standards. (p.
18)
However, a significant number of retirees struggle
financially- particularly those renting in the private market, and early
retirees who live on lower-rate payments before qualifying for the Age Pension.
The Treasury report found that around 60% of single retirees who are renting
are living in poverty (p. 32) but determined that increased Rent Assistance would
not have a meaningful impact on income poverty rates. It did not offer an
alternative proposal.
The report found that homeowners could
significantly boost their retirement incomes by drawing on home equity through
reverse mortgages such as the Home
Equity Access Scheme. However, the review found
the current pension asset test exemption for the family home acted as a
disincentive for retirees to draw on this equity (p. 19).
Election commitments
The Coalition made 2 election commitments affecting
Age Pension recipients:
- providing incentives
for homeowners to downsize by extending the assets test exemption for
proceeds from a pensioner’s principal home from 12 to 24 months and assessing a
lower rate of ‘deemed income’ from the proceeds under the income test.
- freezing
the deeming rates used to assess income from financial investments for 2 years.
This will mean pensioners are likely to have less income assessed than what they
are earning on their investments.
The
ALP committed to implementing the same policies (p. 12).
The Coalition
also committed to increasing the income limits to access the Commonwealth
Seniors Health Card. The concession card is for those ineligible for the Age
Pension, usually due to the assets test. Labor
also committed to the same policy (p. 12).
The Greens’ ‘liveable
income guarantee’ election policy proposed lifting pension and other income
support rates. The Greens also announced
a policy to return the pension qualifying age to 65.
Family assistance
Broadly, family assistance includes the Family Tax
Benefit (FTB) program, Paid Parental Leave and the Child Care Subsidy. The
largest component is FTB with an estimated $17.9 billion in payments
budgeted for 2022–23 (p. 31). The Government expected to spend $10.7 billion on
the Child
Care Subsidy in 2022–23 (p. 28) and around $2.7 billion on Paid
Parental Leave (p. 31).
Election commitments
A major
ALP election policy was increased Child Care Subsidy rates and changes to
the income test- estimated to cost $5.1 billion over the forward estimates.
Modelling by Australian
National University researcher Ben Phillips estimated that families using
child care would, on average, gain around $1,600 per year under Labor’s
proposed changes (p. 6). The
Greens proposed spending $19.0 billion, making child care free for all
families.
The Coalition’s
last Budget included a $346.1 million proposal to merge the current Paid
Parental Leave payments available to principal carers and to fathers and
partners so that new parents and carers could choose how they shared a 20-week
payment entitlement. Labor did not indicate its position on this proposal prior
to the election. The
Greens proposed a 26-week Paid Parental Leave scheme paid at pro rata the
parent’s existing wage, up to $100,000 per annum. The policy would also provide
for superannuation contributions to be paid for the leave period and was
estimated to cost $24.5 billion over 10 years.
None of the parties included FTB changes in their
election policies.
Family Tax Benefit no longer for the middle class
The Howard Government
established FTB in 2000, merging a range of different family payments into FTB Part A and
Part B. Part A is paid per eligible child- it is income-tested and rates
vary by the child’s age. Part B is paid primarily to single parents and to
couples with young children where one partner has low or no income. It is paid
per eligible family and is income-tested with rates based on the age of the
youngest eligible child. In
December 2021, around 1.4 million families received FTB for around 2.7
million children. Around 43% of families receiving FTB were also receiving an
income support payment such as Parenting Payment or JobSeeker Payment. These
figures do not include around 4–5% of recipients who are paid FTB
as an end-of-financial-year lump-sum.
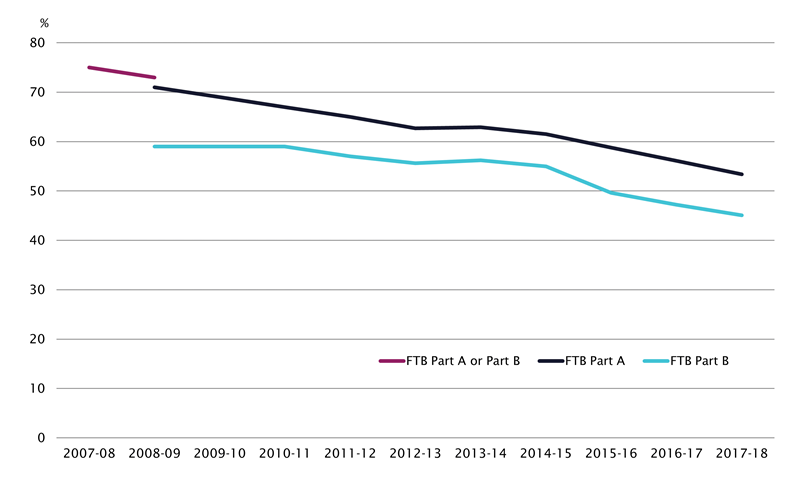
Initially,
most families with dependent children received FTB (p. 17); however, this
almost-universality has eroded via income limits and indexation freezes. In 2007–08
around 75% of families with children under 16 received FTB. By 2017–18, only
around 53% of families received FTB Part A and 45% received FTB Part B (Figure
3). The Department of Social Services (DSS) ceased publishing this measure in its
annual
report in 2020–21, but based on the trend it is likely that fewer than half
of families with dependent children now receive FTB.
DSS has recently changed
the FTB program’s performance measure to explicitly state it is targeted at
low-income families (p. 48). The program now aims to have at least 67% of
FTB paid to families whose income is under the ‘FTB Part A lower income free area’. For 2021–22, this means 67% of FTB being paid to
families with a combined income of under $56,137.
Figure 3 Proportion
of families with children under 16 years of age receiving Family Tax Benefit
Notes: DSS calculations
based on estimates of families with children under 16 years using ABS Survey of
Income and Housing data (excludes families with shared care arrangements). FTB
data is based on reconciled entitlements so 2017–18 data was published in June
2020.
Sources: DSS
and predecessor agencies’ annual reports.
The ALP and Coalition government’s policies have
limited FTB growth despite population and rate increases. The ALP’s savings
measures included freezing
the annual adjustment of some income test thresholds and the rate of
end-of-year supplements; changing
the way adjustments are made to FTB Part A rates; and introducing an income limit
for FTB Part B. These measures were
partly offset by increasing rates of FTB Part A for older children and an
additional ‘Schoolkids Bonus’ payment.
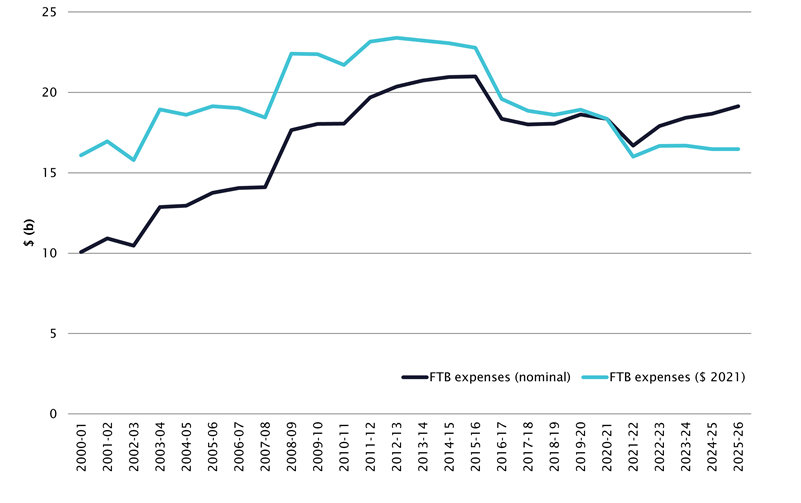
Under the Coalition Government, real FTB expenditure
(adjusted for inflation) has fallen to an estimated equivalent of 2000–01
levels (Figure 4). Measures contributing to this include:
Figure 4 Family
Tax Benefit expenses, nominal and real ($ June 2021)
Notes: 2000–01
to 2020–21 are actual expenses. 2021–22 is estimated actual. 2022–23 onwards
are estimates. 2021 dollars calculated using CPI for June quarter at the end of
the relevant financial year. Expenditure over the forward estimates converted
to 2021 dollarsusing the estimated changes to the CPI published in Australian
Government, Budget
Strategy and Outlook: Budget Paper No. 1: 2022–23, 6.
Sources:
Parliamentary Library calculations based on DSS and predecessor agencies’ Portfolio
Additional Estimates Statements and Portfolio Budget Statements.
Through making the FTB program more targeted,
consecutive governments have achieved significant budget savings. However, previous
savings measures primarily affected high- and middle-income families, and any
further savings measures are more likely to affect low-income families.
Further reading
Michael Klapdor, ‘Social security’, Budget Review 2022–23, Research paper, 2021–22, (Canberra: Parliamentary Library, 2022).
Senate Community Affairs References Committee, Adequacy of Newstart and Related Payments and Alternative Mechanisms to Determine the Level of Income Support Payments in Australia (Canberra: The Senate, 2020).
Retirement Income Review, Retirement Income Review: Final Report, (Canberra: The Treasury, 2020).
Back to Parliamentary Library Briefing Book
For copyright reasons some linked items are only available to members of Parliament.
© Commonwealth of Australia

Creative Commons
With the exception of the Commonwealth Coat of Arms, and to the extent that copyright subsists in a third party, this publication, its logo and front page design are licensed under a Creative Commons Attribution-NonCommercial-NoDerivs 3.0 Australia licence.