Geoff Gilfillan, Statistics
and Mapping
Key Issues
The Australian labour market performed more solidly in the 12 months to June 2016 with relatively strong growth in employment and a modest fall in the unemployment rate
Full‑time employment growth remains subdued and wages have virtually flatlined in real terms over the past three years. After signs of a steady fall in the youth unemployment rate since late 2014 there has been a slight uptick in recent months.
Employment
In the 12 months to June 2016 employment in
Australia grew by 212,000 or 1.8% (in trend terms) to 11.9 million. This growth
rate is just below the annual average for employment growth of 1.9% recorded since
the early 1980s.
However, just over two thirds (68.3%) of employment
growth in the past 12 months was in part‑time employment: around 32% of
employed Australians worked part‑time in June 2016 compared with 26% in
January 2000.
Unemployment
The unemployment rate has fallen by 0.4 percentage
points over the past year to 5.7% in June 2016 (in trend terms). Over this
period, the number of people who are unemployed fell by just over 40,000 to
726,000 (in trend terms).
The most recent low for the unemployment rate in
Australia was 4.1% in April 2008—the lowest unemployment rate recorded since
monthly estimates started being released in February 1978.
Figure 1: Unemployment rate
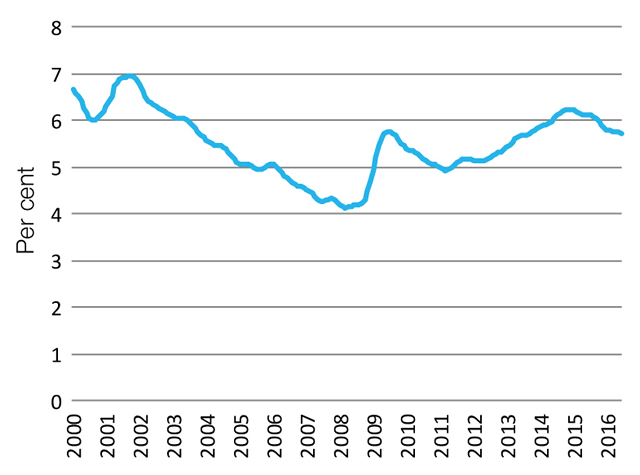
Source: ABS, Labour force survey,
Australia, cat. no. 6202.0, Table 1, Trend.
Participation
Other indicators of the health of the labour market
include the proportion of the population aged 15 years and over in the labour
force (participation rate), and the proportion who have a job (employment to
population ratio).
Both measures showed signs of recovery in the 12
months to late 2015 but have since fallen marginally. The labour force
participation rate of 64.8% (in trend terms) in June 2016 is below its most
recent peak of 65.7% in December 2010.
The employment to population ratio (61.1%) in June
2016 is below its most recent peak of 62.8% in July 2008.
Figure 2: Participation and employment rates
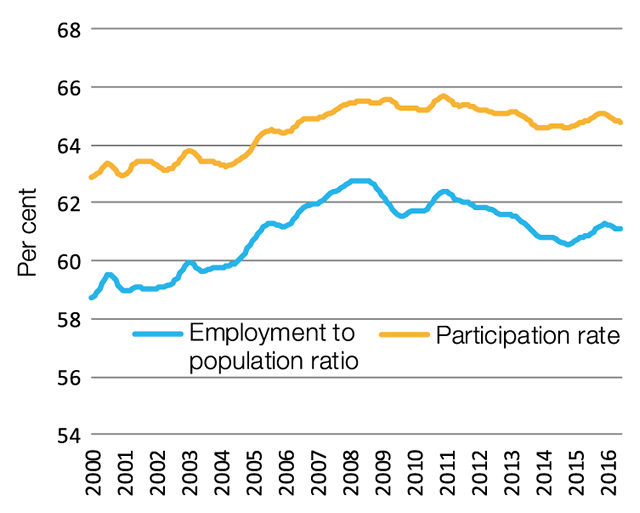
Source: ABS, Labour force survey,
Australia, cat. no. 6202.0, Table 1, Trend.
Lower labour force participation is driven by a
combination of discouragement from looking for work for some potential job
seekers, long‑term demographic trends such as the ageing of the
population, and higher rates of engagement in full‑time education by
young people. Conversely, there is evidence of higher participation among older
age groups in recent years—perhaps in response to declining superannuation
balances following the Global Financial Crisis (GFC).
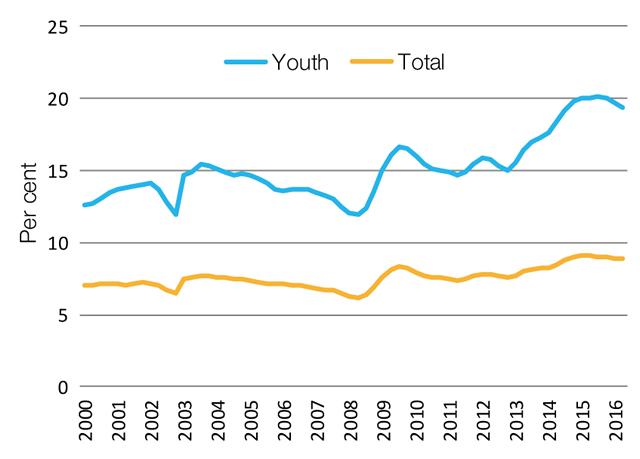
Youth
The unemployment rate for young people aged 15 to
24 years stood at 12.7% (in trend terms) in June 2016—well in excess of the total
unemployment rate (people aged 15 years and over) of 5.7%.
While youth unemployment increased steadily from
mid‑2008 to late 2014, a much higher proportion of people in this age
group are now engaged in full‑time study. Over half (54%) of people aged
15 to 24 years were engaged in full‑time study in June 2016 compared with
47% in July 2008.
Figure3: Youth and total unemployment rates
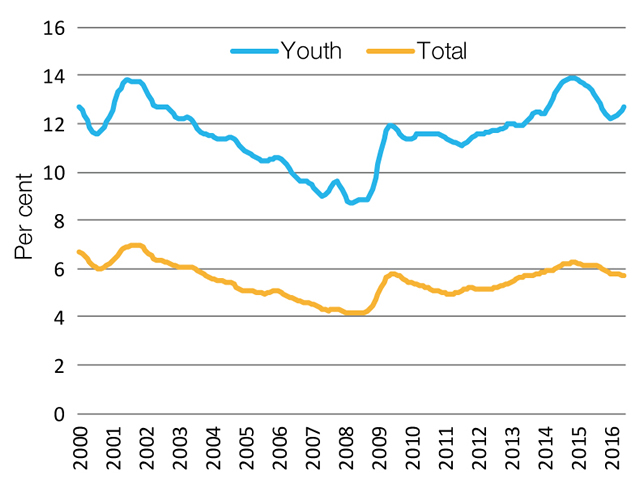
Source: ABS, Labour force survey,
Australia, cat. no. 6202.0, Table 1, Trend.
Wages
Wages in both the public and private sectors have grown
at a slower pace in recent years.
Figure 4: Wage Price Index
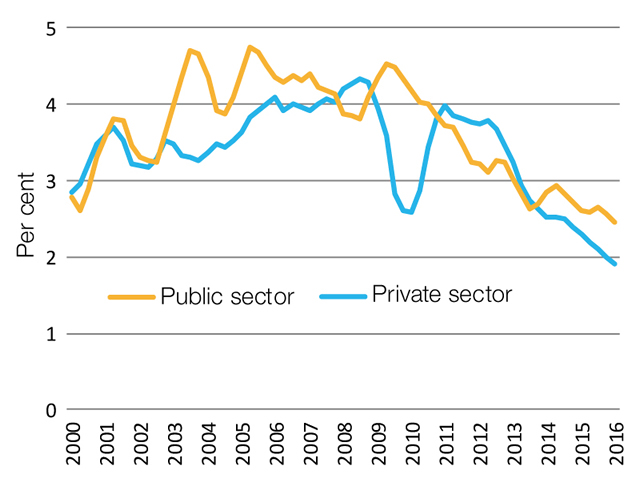
Source: ABS, Wage price index,
Australia, cat. no. 6345.0, Trend.
Total hourly rates of pay for employees in the
private sector (excluding bonuses) grew by 1.9% in the 12 months to March 2016,
compared with growth of 2.5% for public sector employees.
While nominal wages (unadjusted for inflation) have
grown at a slower pace, real wages (adjusted for inflation), as measured by
Average Weekly Ordinary Time Earnings, have virtually flat‑lined since
May 2013.
Figure 5: Nominal and real wages
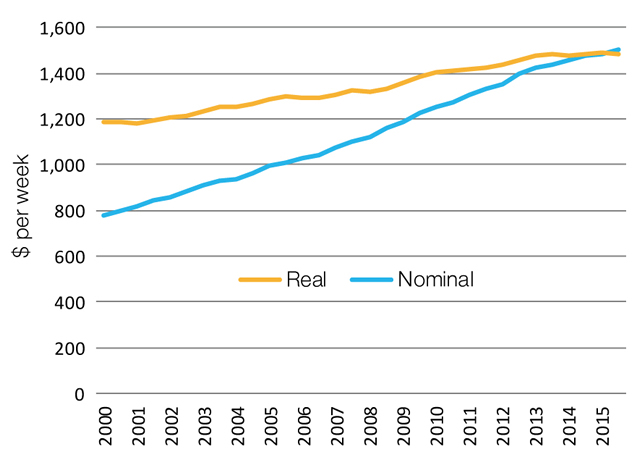
Source: ABS, Average weekly earnings,
cat. no. 6302.0, Original data. Real wages shown in June 2015 dollars
The Reserve Bank of Australia found wages have been
reacting to a softening in the labour market and increasing spare capacity in
the economy. Declining inflationary expectations also appears to have had some influence.
However, wages growth in the past 12 months remains subdued despite a
strengthening in employment growth and a fall in the unemployment rate.
Underemployment
Underemployment is an indicator of the extent of
underutilised labour in the economy. Underemployed workers include those people
who worked part time and wanted more hours and those who normally worked full
time but were working part time due to being stood down or insufficient work
being available.
Underemployment affects younger workers more than
older workers. Just under 20% of workers aged 15 to 24 years wanted more hours
of work in June 2016 compared with 9% of all workers (aged 15 years plus).
Figure 6: Underemployment ratios
Source: ABS, Labour force survey,
Australia, cat. no. 6202.0, Table 22, Trend.
Long‑term unemployment
Long‑term unemployed people are those who have
been unemployed for 12 months or more. Increasing levels and rates of long‑term
unemployment indicates that some unemployed people are taking longer to find
suitable employment.
The level and prevalence of long‑term
unemployment rose sharply from mid‑2008 to late 2010, plateaued until mid‑2013
and has been rising since. The number of people who were long‑term
unemployed has increased from 69,000 in July 2008 to 182,900 in March 2015 (in
trend terms) and has since fallen to 166,600 in June 2016. Around 22.9% of all
unemployed people were long‑term unemployed in June 2016 compared with 12.8%
in February 2009.
Figure 7: Long‑term unemployment
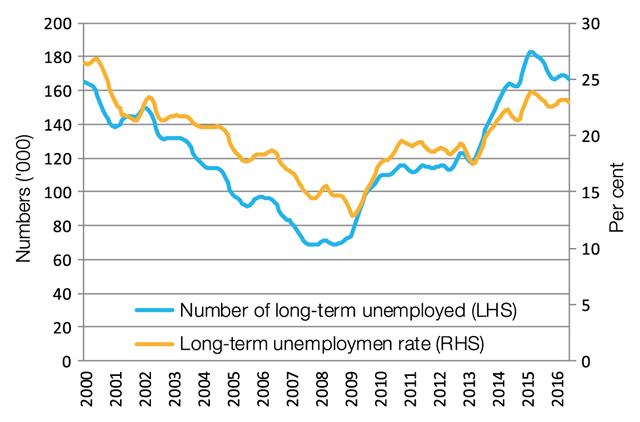
Source: ABS, Labour force survey, cat.
no. 6291.0.55.001, Table 14b, Trend.
Unemployed people in older age groups tend to have
higher rates of long‑term unemployment. In May 2016, 41% of unemployed
people aged 55 to 64 years were long‑term unemployed compared with 18% of
unemployed people aged 15 to 24 years.
Labour productivity
Labour productivity measures the efficiency of use of labour
and is equivalent to the growth of output above the growth in labour inputs.
The annual rate of growth of labour productivity (as
measured by gross value added per hour worked in the 12-industry market sector)
has been slowing in Australia since mid‑2012. Labour productivity grew by
1.4% per cent in the 12 months to March 2016 (in trend terms).
Productivity growth rates are best measured in
growth cycles. According to the Productivity Commission’s PC
Productivity Update (April 2016) labour
productivity across the market sector has averaged 2.3% per annum in the period
between 2007–08 and 2014–15. The last, complete cycle occurred between 2003–04
and 2007–08 when annual average labour productivity growth was 1.6%.
Figure 8: Annual labour productivity growth
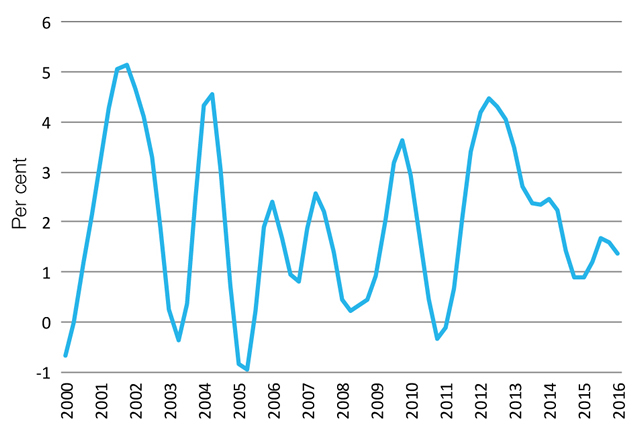
Source: ABS, National accounts, cat.
no. 5206.0, Table 1, Trend.
The Productivity Commission found the relatively strong
growth in labour productivity recorded for mining in 2014–15 was driven by a
substantial contraction in labour inputs as well as strong growth in output.
The Commission attributed the improvement in both labour productivity and multi‑factor
productivity in mining to the transition from the investment phase to the
production phase.
Further reading
C Kent, Cyclical and Structural Change in the Labour Market, Address by the Assistant Governor (Economics) Reserve Bank of Australia, Reserve Bank of Australia website, 16 June 2014.
J Healy, ‘The Australian labour market in 2015’, Journal of Industrial Relations, 58(3), June 2016, pp. 308–323.
PC Productivity Update April 2016.
Back to Parliamentary Library Briefing Book
For copyright reasons some linked items are only available to members of Parliament.
© Commonwealth of Australia

Creative Commons
With the exception of the Commonwealth Coat of Arms, and to the extent that copyright subsists in a third party, this publication, its logo and front page design are licensed under a Creative Commons Attribution-NonCommercial-NoDerivs 3.0 Australia licence.