Sue Johnson, Statistics
and Mapping
Estimated resident population by state and
territory: 1985, 2005 and 2015
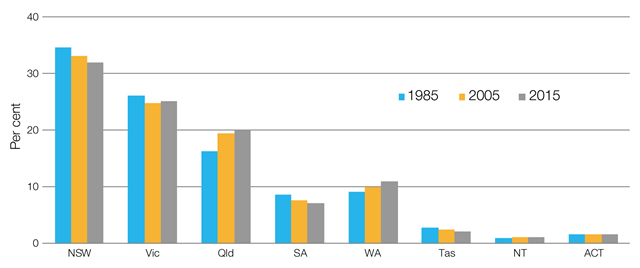
Source: Australian Bureau of Statistics (ABS), Australian Demographic Statistics, December 2015, cat. no. 3101.0.
Between 1985 and 2015, the proportion of Australians living in Queensland (Qld) and Western Australia (WA) increased, while the Northern Territory (NT) and the Australian Capital Territory (ACT) maintained their share of population. Over the thirty year period, Qld and WA recorded average annual growth of 2.1% and 2.0% respectively, compared with the Australian average of 1.4%.
Estimated resident population by age: 1985 and
2015
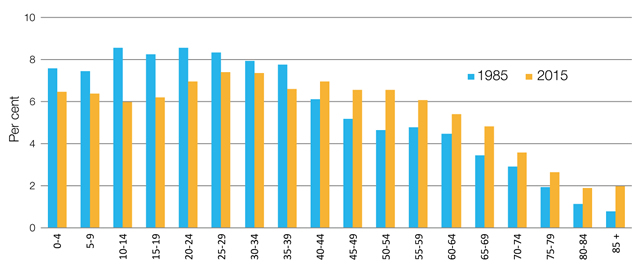
Source: ABS, Australian Demographic Statistics, December 2015, cat. no. 3101.0.
Over the 30 years to 2015, Australia’s population has aged. The proportion aged under 15 years has fallen from 23.8% to 18.8%, and the proportion aged 65 years and over has increased from 10.3% to 15.0%.
Australia’s overseas
born population by country of birth: 1981 and 2011
| 1981 |
2011 |
| Country |
No. |
% of all overseas born |
Country |
No. |
% of all overseas born |
| United Kingdom |
1,086,625 |
36.5 |
United Kingdom |
1,101,082 |
20.8 |
| Italy |
275,883 |
9.3 |
New Zealand |
483,397 |
9.1 |
| New Zealand |
176,713 |
5.9 |
China (excl. SARs and Taiwan) |
318,969 |
6.0 |
| Yugoslavia |
149,335 |
5.0 |
India |
295,362 |
5.6 |
| Greece |
146,625 |
4.9 |
Italy |
185,403 |
3.5 |
| Germany |
110,758 |
3.7 |
Vietnam |
185,036 |
3.5 |
| Netherlands |
96,044 |
3.2 |
Philippines |
171,234 |
3.2 |
| Poland |
59,441 |
2.0 |
South Africa |
145,682 |
2.8 |
| Malta |
57,001 |
1.9 |
Malaysia |
116,196 |
2.2 |
| Lebanon |
49,623 |
1.7 |
Germany |
108,001 |
2.0 |
Source: ABS, Census of Population and Housing, 1981 and Census of Population and Housing (Tablebuilder), 2011, cat. no. 2103.0.
The proportion of Australians born overseas increased from 16.8% in 1981 to 24.6% in 2011. Over this period, there has been a shift away from the United Kingdom and Europe, and growth in migration from Asia.
Employment by business size: 2014–15
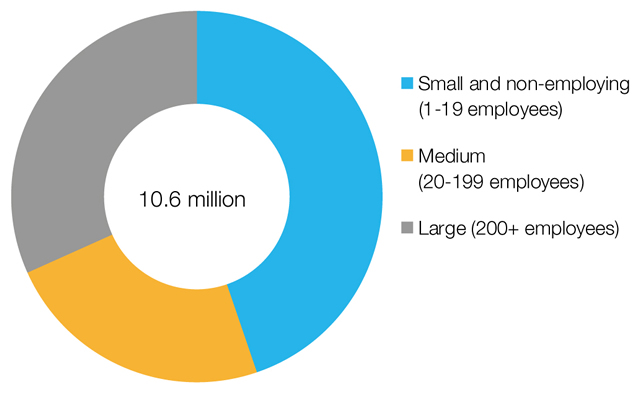
Source: ABS, Australian Industry, 2014–15, cat. no. 8155.0.
Small businesses employed 4.8 million people, or 44.8% of all those employed in 2014–15. This was followed by large businesses, which employed 31.7% (3.4 million people), while medium size businesses employed 23.5% (2.5 million people).
Back to Parliamentary Library Briefing Book
For copyright reasons some linked items are only available to members of Parliament.
© Commonwealth of Australia

Creative Commons
With the exception of the Commonwealth Coat of Arms, and to the extent that copyright subsists in a third party, this publication, its logo and front page design are licensed under a Creative Commons Attribution-NonCommercial-NoDerivs 3.0 Australia licence.