Posted 08/03/2023 by Penny Vandenbroek
International Women’s Day (IWD) is being acknowledged on 8 March 2023. The UN Women’s theme for this year is #CrackingtheCode, which aims to use innovation to increase women’s participation in the digital world through better access to technology, increased inclusivity and championing of women’s involvement in STEM (science, technology, engineering, and mathematics).
An additional IWD theme of #EmbraceEquity is pushing for activities to move beyond equality (equal access to resources or opportunities) and towards equity for all women. Equity recognises that each person has different requirements and these need to be addressed with tailored resources and opportunities to enable the achievement of an equal outcome. Equity promotes inclusiveness of sub-groups within a population, for example women migrants or women with disability. This article will briefly explore how equality in women’s employment can be measured against men, as well as examine equity amongst women. Also provided are links to some key statistical resources.
Employment gaps
There are differences in employment for men and women by levels and outcomes. For example, at January 2023, the employment rate (employed as a share of the relevant population) for women was just under 60%, compared to just over 68% of men (ABS, Employment-to-population ratio). There are also differences in pay outcomes and variations in the composition of men and women in occupations and industries.
Gender pay gap
A widely used measure to calculate difference between women’s and men’s wages is the gender pay gap. This measure is often used at the aggregate level, comparing the average working woman with the average working man, without consideration for the type of work they do (occupation), where they work (industry, urban or regional), how many hours they work (full or part-time), the type of employment they hold (permanent, casual, seasonal) and more. At this aggregate level, the gender pay gap was about 13% in November 2022. However, within the group of women (and men) there are also unequal outcomes in pay. This discrepancy amongst women extends to opportunities to work (employment levels), as well as working conditions.
Occupation
At the time of the 2021 Census, many occupations falling under the banner of STEM had large disparities in men’s and women’s employment. Figure 1 shows the unevenness of gender in many roles, for example Engineering Professionals (87% men vs 13% women). Conversely, similar proportions of men and women worked as Architects, Designers, Planners and Surveyors (52% vs 48%) and the rates were equal for Natural and Physical Science Professionals 50% each).
Fig 1 Proportion of men and women employed in selected STEM occupations, 2021
Source: ABS,
2021 Census [TableBuilder] and Parliamentary Library calculations.
Gaps between women
A range of variables can be used to assess sub-populations of women. For migrant women some of the key variables relate to country of birth, year of arrival in Australia, languages spoken, English proficiency and visa status. For second-generation Australian women, variables such as where someone’s parents are from or language are of interest. More broadly, women may live with a disability or long-term health condition, they may have children, be a carer, or identify as Aboriginal or Torres Strait Islander. The following sections touch on some of these employment gaps, focussing on the working-age population (people aged 15 to 64 years).
First Nations women
In August 2021, the employment rate for Australian Aboriginal and/or Torres Strait Islander women was about 51%, compared to 72% of women who did not identify as First Nations Australian. Consideration could also be given to where women live, such as regional or remote areas, as job opportunities are not evenly dispersed across Australia. Additionally, job flexibility that allows for cultural or kin commitments may not be available in areas with few employment options.
Women born overseas
Australian-born women (including a small group of women from surrounding countries in Oceania) constituted the bulk of employed women at August 2021, with around a 70/30 split with women born overseas. Australian-born women had higher employment rates than several groups of overseas-born women, with those from North Africa and the Middle East having the lowest employment rates, at 41% (largely a function of age and potentially also family size). Figure 2 provides the variation in employment rates based on broad country of birth.
Fig 2 Employment rates of working-age women by broad country of birth, 2021
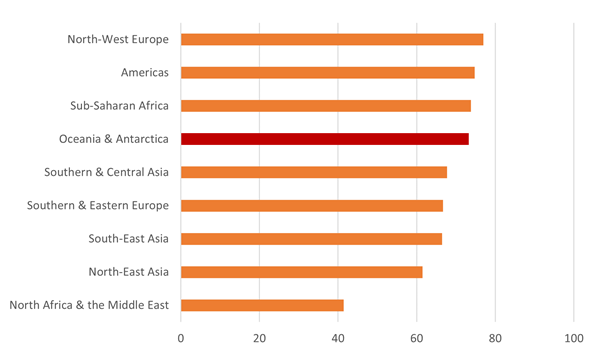
Note: Australia is included in the Oceania and Antarctica grouping, highlighted in red.
Source: ABS, 2021 Census [TableBuilder] and Parliamentary Library calculations.
At this broad level however, these country groupings can obscure differences in outcomes for distinct groups of women. For example, women from Maritime South-East Asia (for example, Malaysia, Singapore, the Philippines) had employment rates of 72% compared to those from Mainland South-East Asia (for example, Cambodia, Thailand, Laos), at 58%. Even within these groupings, there will be variations in womens’ age profile, education levels, metro and non-metro location, caring responsibilities and work preferences, which can all impact on their employment rates.
Women with long-term health conditions
For the first time, the 2021 Census collected information on whether people lived with a long-term health condition. For working-aged women, the gap in employment rates between those who had or did not have one or more long-term health conditions was 9 percentage points, at 65% and 74% respectively. Analysing by type of health condition, or co-morbidity of conditions (more than one condition concurrently), would provide greater nuance for women’s employment outcomes.
Women with an unpaid caring role
The Census collects information on whether someone provided unpaid assistance to someone with a disability, health condition or due to old age in the two weeks prior to Census night. In August 2021, women were more likely than men to have provided unpaid care, at 15% and 10% respectively. People who provided unpaid care had lower employment rates than those that did not — men at 73% compared to 78% and women at 66% compared to 72%. Exploring carer status by additional dimensions, such as Indigeneity, country of birth or parenthood status, would further enrich analysis of the impact of caring on employment outcomes.