Posted 31/10/2022 by Joanne Simon-Davies
This month: How Australians use their time, renewable energy and National Diabetes Month.
Forthcoming releases
If you are interested in any of the forthcoming releases or datasets, please contact the Parliamentary Library to discuss in more detail.
| |
Statistical reports |
Release date |
| ABS |
Building Approvals, September 2022 |
2 Nov |
| ABS |
Selected Living Cost Indexes, September 2022 |
2 Nov |
| ABS |
Lending Indicators, September 2022 |
2 Nov |
| ABS |
International Trade in Goods and Services, September 2022 |
3 Nov |
| ABS |
Twenty-seven years of prisoners in Australia (new release) |
3 Nov |
| NVCER |
Government Funding of VET, 2021 |
3 Nov |
| ABS |
Retail Trade, September 2022 |
4 Nov |
| ABS |
Barriers and Incentives to Labour Force Participation, 2020–21 |
4 Nov |
| ABS |
Guide to labour statistics, 2022 |
7 Nov |
| ABS |
Data by region, 2011 to 2022 |
7 Nov |
| ABS |
Life tables, 2019–2021 |
8 Nov |
| ABS |
Monthly Household Spending Indicator, September 2022 |
8 Nov |
| ABS |
Jobs in Australia, 2015–16 to 2019–20 |
8 Nov |
| ABS |
Personal Income in Australia, 2015–16 to 2019–20 |
8 Nov |
| ABS |
Monthly Business Turnover Indicator, September 2022 |
9 Nov |
| ABS |
Building Approvals, September 2022 |
9 Nov |
| AIHW |
Family, Domestic and Sexual Violence Data in Australia |
9 Nov |
| ABS |
Education and Work, May 2022 |
10 Nov |
| ABS |
Weekly Payroll Jobs and Wages in Australia, Week ending 15 October 2022 |
10 Nov |
| ABS |
Marriages and Divorces, 2021 |
10 Nov |
| ABS |
Employment and Earnings, Public Sector, 2021–22 |
10 Nov |
| ABS |
Estimates of Industry Level KLEMS Multifactor Productivity, 2020–21 |
15 Nov |
| ABS |
Overseas Arrivals and Departures, September 2022 |
15 Nov |
| ABS |
Wage Price Index, September 2022 |
16 Nov |
| AIHW |
Serving and Ex-serving ADF Members Who Have Served Since 1985: suicide monitoring 1997–2020 |
16 Nov |
| ABS |
Labour Force, October 2022 |
17 Nov |
| ABS |
Livestock Products, September 2022 |
17 Nov |
| ABS |
Patient Experiences, 2021–22 |
18 Nov |
| ABS |
Australian National Accounts: State Accounts, 2021–22 |
18 Nov |
| ABS |
Retirement and Retirement Intentions, 2021–22 |
23 Nov |
| ABS |
Corrective Services, September Quarter 2022 |
24 Nov |
| ABS |
Labour Force (Detailed), October 2022 |
24 Nov |
| ABS |
Retail Trade, October 2022 |
28 Nov |
| ABS |
Labour hire workers (new release), August 2020 |
29 Nov |
| ABS |
National Ocean Account, Experimental Estimates, November 2022 |
29 Nov |
| AIHW |
Australia's Mothers and Babies: Stillbirths and Neonatal deaths; Maternal Deaths |
29 Nov |
| ABS |
Building Approvals, October 2022 |
30 Nov |
| ABS |
Construction Work Done (Preliminary), September 2022 |
30 Nov |
| ABS |
Monthly Consumer Price Index Indicator, October 2022 |
30 Nov |
| AIHW |
Economics of sports injuries |
30 Nov |
| AIHW |
National Perinatal Data Collection Data Availability Resource (new release) |
30 Nov |
Note: Release dates may be subject to change without notice.
After the latest key economic statistics? Visit the Parliamentary Library’s Key Economic and Social Indicators Dashboard.
Recent reports
According to the report:
The Australian renewable energy industry accounted for 32.5% of Australia’s total electricity generation in 2021, which represented an increase of almost 5 percentage points compared to 2020. In the past 5 years, the proportion of Australia’s electricity that comes from renewables has almost doubled, increasing from 16.9% in 2017 to 32.5% this year.
The growth in renewable energy generation was most keenly felt in the coal sector, which saw its share of total generation fall from 62.0% in 2020 to 59.1% in 2021. The gas sector also saw a notable fall, with its proportion of total generation falling to 7.7% in 2021, down from 9.9% in 2020.
People in Australia spent an average of 3.5 hours a day on unpaid work activities during 2020–21, according to the latest Australian Bureau of Statistics (ABS) Time Use Survey. Unpaid work includes domestic duties like housework, food and drink preparation and shopping, as well as childcare, adult care and volunteering activities.
Other key findings from the Survey include:
- Whilst both females (94%) and males (86%) participated in unpaid work activities (which includes domestic, childcare, adult care and voluntary work activities), females spent on average 4 hours 31 minutes a day, compared to 3 hours 12 minutes for males.
- Females (93%) were more likely than males (82%) to participate in most types of domestic activities (as shown in Figure 1), such as:
- housework (70% of females compared to 42% of males)
- food and drink preparation/service (75% compared to 55%)
- shopping (38% compared to 31%).
Figure 1: Participation in domestic activities by sex (%)
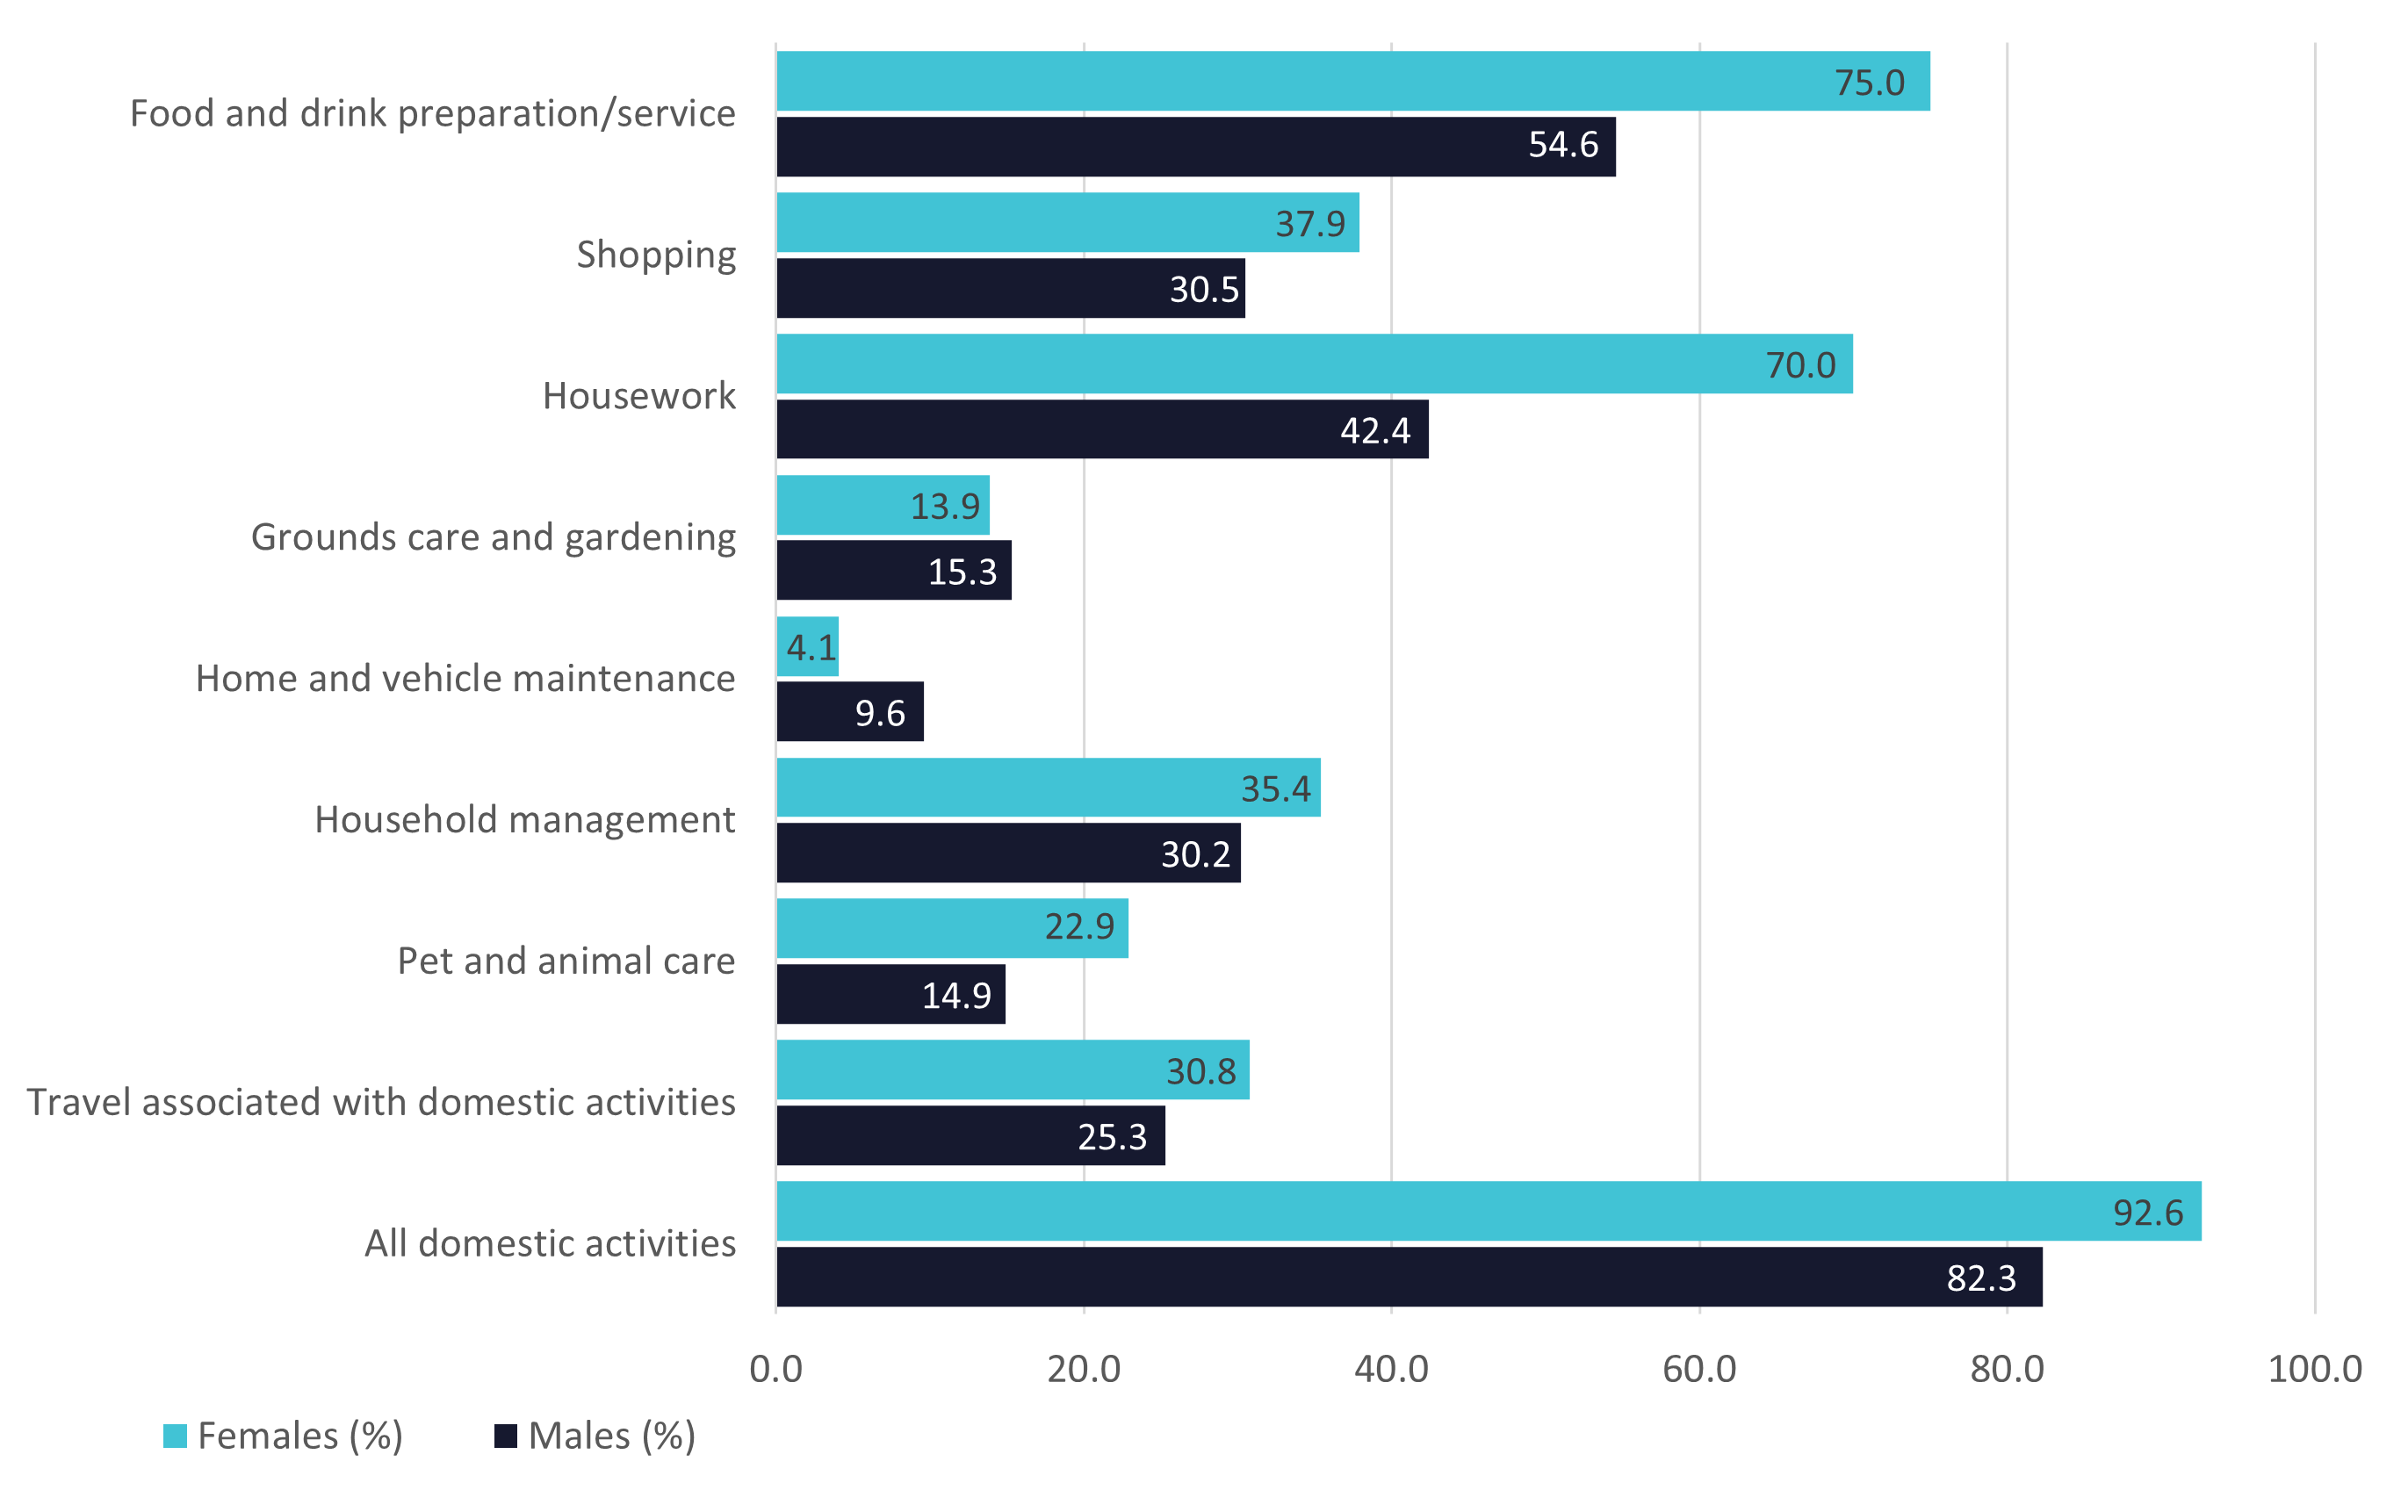
Source: Australian Bureau of Statistics (ABS), How Australians Use Their Time (Canberra, 2022)
More female parents of children under 15 years participated in childcare activities than male parents (89% compared to 73%). Of the different types of childcare participated in by parents of children under 15 years:
- 70% of females engaged in the physical and emotional care of children (42% of males)
- 51% of females spent time playing, reading or talking with a child (38% of males)
- 40% of females participated in feeding and food preparation for children compared to 17% of males.
Most people participated in recreation and leisure activities (93%) and spent on average 4 hour 23 minutes of their day on these activities:
- 75% watched TV and video, for an average of 2 hours 55 minutes
- 36% engaged in general internet and device use, for an average of 1 hour 1 minute
- 30% did exercise, sport or outdoor activity, for an average of 1 hour 29 minutes
- 22% were reading for an average of 1 hour 26 minutes.
Other reports of interest
November: National Diabetes Month

In 2020, an estimated 1 in 20 (almost 1.3 million) Australians were living with diabetes. This includes people with type 1 diabetes, type 2 diabetes and other diabetes, but excludes gestational diabetes.
In 2020–21 there were 19,100 emergency department presentations with a principal diagnosis of type 1 diabetes, type 2 diabetes or other diabetes.
In the same period, there were over 16.5 million prescriptions dispensed for diabetes medicines
According to the Australian Institute of Health and Welfare National Mortality Database, in 2020, diabetes was the underlying cause of around 5,100 deaths. However, it contributed to around 17,500 deaths (10.8% of all deaths) when associated causes are included.
|
Data sourced from the Australian Institute of Health and Welfare, Diabetes: Australian facts; Ella Olsson/Unspash.com
Interested in finding out what the latest statistics are telling us about the Australian economy and population? Each month the Parliamentary Library publishes a Flag Post article listing new reports on a wide variety of topics. The list includes important upcoming ABS releases and other research organisations and government departments.