Posted 22/11/2022 by Penny Vandenbroek
The Australian Bureau of Statistics (ABS) releases quarterly estimates of employed people by industry (in their main job, if a person holds more than one job) in the publication Labour Force, Australia, Detailed. Quarterly data is available since November 1984, with the most recent data being August 2022.
Estimates of employment by industry division are currently available in seasonally adjusted and original (unadjusted) series. The ABS suspended the trend series in April 2020 due to the uncertainty of estimate adjustments related to the COVID-19 pandemic, but will reinstate the series later this year. For finer level detail on industry of employment (for example, sub-division), the ABS release original estimates. Industry data is classified across 19 divisions, according to the Australian and New Zealand Standard Industrial Classification (ANZSIC), 2006 (Revision 2.0) (see ‘The detailed classification’).
Given the ongoing interest in employment by industry, two previously published tables have been updated for comparable periods. Table 1 presents estimates of employment by industry with a breakdown by proportion. These figures capture one industry per employed person (based on the most hours usually worked) and do not reflect any additional jobs held (approximately 6% of people held more than one job in August 2021).
Table 1 Employed people by industry, Feb 2020, 2021 and 2022 (seasonally adjusted)
|
Employed people |
|
Proportion of total employed |
|
Feb-20 |
Feb-21 |
Feb-22 |
Change Feb-21
to Feb-22 |
Feb-20 |
Feb-21 |
Feb-22 |
| Industry of
employment (Division) |
('000) |
('000) |
('000) |
(%) |
(%) |
(%) |
(%) |
| Agriculture,
Forestry and Fishing |
325.5 |
325.9 |
290.9 |
-10.8 |
2.5 |
2.5 |
2.2 |
| Mining |
242.3 |
253.7 |
281.4 |
10.9 |
1.9 |
2.0 |
2.1 |
| Manufacturing |
910.7 |
890.1 |
849.4 |
-4.6 |
7.0 |
6.8 |
6.3 |
| Electricity,
Gas, Water and Waste Services |
132.5 |
148.5 |
167.4 |
12.7 |
1.0 |
1.1 |
1.2 |
| Construction |
1,185.0 |
1,154.4 |
1,164.6 |
0.9 |
9.1 |
8.9 |
8.7 |
| Wholesale
Trade |
392.6 |
392.5 |
328.6 |
-16.3 |
3.0 |
3.0 |
2.4 |
| Retail Trade |
1,246.5 |
1,313.5 |
1,284.8 |
-2.2 |
9.6 |
10.1 |
9.6 |
| Accommodation
and Food Services |
932.6 |
847.8 |
901.4 |
6.3 |
7.2 |
6.5 |
6.7 |
| Transport,
Postal and Warehousing |
650.9 |
672.5 |
671.1 |
-0.2 |
5.0 |
5.2 |
5.0 |
| Information
Media and Telecommunications |
211.6 |
200.0 |
207.1 |
3.6 |
1.6 |
1.5 |
1.5 |
| Financial and
Insurance Services |
466.5 |
470.7 |
552.2 |
17.3 |
3.6 |
3.6 |
4.1 |
| Rental,
Hiring and Real Estate Services |
219.0 |
213.7 |
241.0 |
12.8 |
1.7 |
1.6 |
1.8 |
| Professional,
Scientific and Technical Services |
1,153.9 |
1,204.1 |
1,259.9 |
4.6 |
8.9 |
9.3 |
9.4 |
| Administrative
and Support Services |
433.0 |
379.6 |
404.0 |
6.4 |
3.3 |
2.9 |
3.0 |
| Public
Administration and Safety |
830.5 |
862.0 |
900.1 |
4.4 |
6.4 |
6.6 |
6.7 |
| Education and
Training |
1,133.7 |
1,092.3 |
1,152.2 |
5.5 |
8.7 |
8.4 |
8.6 |
| Health Care
and Social Assistance |
1,794.2 |
1,806.8 |
2,017.8 |
11.7 |
13.8 |
13.9 |
15.0 |
| Arts and
Recreation Services |
247.7 |
241.6 |
228.9 |
-5.3 |
1.9 |
1.9 |
1.7 |
| Other
Services |
487.9 |
504.6 |
512.6 |
1.6 |
3.7 |
3.9 |
3.8 |
| Total
employed (a) |
13,015.5 |
13,000.6 |
13,432.0
|
3.3 |
100.0 |
100.0 |
100.0 |
Table 2 presents employed people by industry with a breakdown by sex. In February 2022, men were most likely to work in: construction (14%); professional, scientific and technical services (10%); or manufacturing (9%). Women were most likely to work in: health care and social assistance (23%); education and training (13%); or retail trade (11%).
Table 2 Share of industry employment by sex, Feb 2022 (average of four-quarters ending, original)
|
Employed people |
|
Proportion of total employed |
|
Men |
Women |
Persons |
Men |
Women |
Persons |
| Industry of
employment (Division) |
('000) |
('000) |
('000) |
(%) |
(%) |
(%) |
| Agriculture,
Forestry and Fishing |
205.3 |
103.7 |
309.0 |
3.0 |
1.6 |
2.3 |
| Mining |
220.3 |
51.4 |
271.7 |
3.2 |
0.8 |
2.1 |
| Manufacturing |
636.6 |
258.5 |
895.1 |
9.2 |
4.1 |
6.8 |
| Electricity,
Gas, Water and Waste Services |
112.3 |
38.6 |
150.9 |
1.6 |
0.6 |
1.1 |
| Construction |
996.9 |
150.6 |
1,147.5 |
14.4 |
2.4 |
8.7 |
| Wholesale
Trade |
231.0 |
119.7 |
350.7 |
3.3 |
1.9 |
2.7 |
| Retail Trade |
587.2 |
691.4 |
1,278.7 |
8.5 |
11.0 |
9.7 |
| Accommodation
and Food Services |
381.2 |
480.5 |
861.7 |
5.5 |
7.6 |
6.5 |
| Transport,
Postal and Warehousing |
506.9 |
148.6 |
655.4 |
7.3 |
2.4 |
5.0 |
| Information
Media and Telecommunications |
106.6 |
84.7 |
191.3 |
1.5 |
1.3 |
1.4 |
| Financial and
Insurance Services |
270.3 |
254.1 |
524.4 |
3.9 |
4.0 |
4.0 |
| Rental,
Hiring and Real Estate Services |
119.7 |
107.6 |
227.3 |
1.7 |
1.7 |
1.7 |
| Professional,
Scientific and Technical Services |
681.5 |
553.1 |
1,234.6 |
9.8 |
8.8 |
9.3 |
| Administrative
and Support Services |
215.7 |
209.6 |
425.2 |
3.1 |
3.3 |
3.2 |
| Public
Administration and Safety |
465.7 |
427.4 |
893.1 |
6.7 |
6.8 |
6.8 |
| Education and
Training |
320.6 |
814.5 |
1,135.1 |
4.6 |
12.9 |
8.6 |
| Health Care
and Social Assistance |
452.7 |
1,462.1 |
1,914.8 |
6.5 |
23.2 |
14.5 |
| Arts and
Recreation Services |
121.4 |
108.7 |
230.1 |
1.8 |
1.7 |
1.7 |
| Other
Services |
296.7 |
235.7 |
532.4 |
4.3 |
3.7 |
4.0 |
| Total
employed |
6,928.5 |
6,300.5 |
13,229.0 |
100.0 |
100.0 |
100.0 |
Source: ABS, Labour Force, Australia, detailed, June 2022 [Data cube EQ06 and Library calculations].
The figures presented are on a national basis; however, they are also available by state and territory, greater capital city and balance of state, and labour market region (Statistical Area Level 4, or SA4). For different time periods, or for other employment characteristics, refer to the detailed release. Industry estimates capturing multiple jobholders can be found in the Labour Account (note: demographic characteristics and geographical breakdowns are not available from this source). For additional information on industry employment, refer to the Parliamentary Library’s Employment by industry statistics: a quick guide.
Working from home
The ABS Characteristics of Employment provides information on whether people usually work from home. The concept of working from home stems from pre-pandemic times and includes people who did so: to catch up on work; as part of a flexible work arrangement; to reduce overheads/have a home office; or as part of their employment conditions. The proportion of people who usually work from home has increased from 30% in 2015 to 41% in 2021. It is expected that some of the recent increase could be explained by the COVID-19 pandemic. However, the estimates were generally trending upwards before this time.
Data is released every two years and can be analysed by industry, based on a person’s main job (most hours worked per week). In August 2021, the five industries with the largest proportions of people who usually worked from home were:
- Financial and Insurance Services (77%)
- Professional, Scientific and Technical Services (70%)
- Information Media and Telecommunications (65%)
- Education and Training (61%)
- Rental, Hiring and Real Estate Services (61%).
Chart 1 provides selected industries by the proportion of people who usually worked from home. Some of the largest increases from August 2019 to August 2021 were for the industries listed above, apart from Education and Training which was relatively stable. Public Administration and Safety also saw a large increase of people usually working at home, from 27% pre-COVID (2019) to 45% during a
period of widespread lockdowns (2021), particularly in Australia’s eastern states.
Chart 1 Selected industries by proportion of people working from home, 2015 to 2021(a)
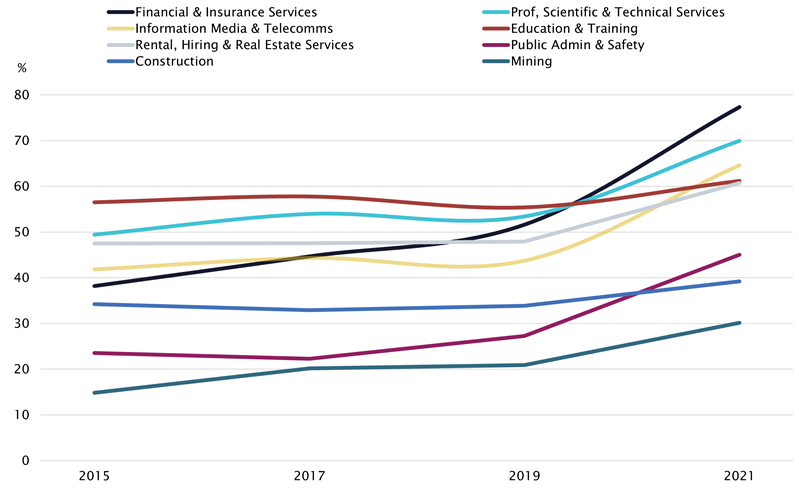
(a) Based on industry of a person's main job, that is, the one in which they usually worked the most hours per week. At August of each period.
Source: ABS, Characteristics of Employment, 2014 to 2021 [TableBuilder and Library calculations].
For an international perspective on how the pandemic impacted people working from home, including industry summaries, see the OECD’s Teleworking in the COVID-19 pandemic: Trends and prospects.
Other useful resources
The National Skills Commission publishes a selection of ABS statistics with analysis in their quarterly updates on industry, occupation and skills. The Commission also publishes ‘Employment projections by industry’ (level of employment change) with summary highlights and charts. The most recent estimates are for the five years to November 2026.
Additionally, the Commission reproduces a range of ABS regional (SA4) industry and occupation data via their Labour Market Insights website. This site enables users to select a region via drop-down menus or an interactive map. The SA4 profiles provide summary labour force indicators, such as the employment rate, and include a breakdown by working-age. The industry profile includes the share of employment (SA4 and state), five-year projections (to November 2025), full-time/part-time employment and a breakdown by sex.