Posted 30/10/2020 by Dr Hazel Ferguson
The Australian Taxation Office (ATO) has released new data on the Higher Education Loan Program (HELP, formerly HECS) debts, covering the 2019–20 financial year.
This FlagPost summarises the ATO HELP data. Previous versions were published for the 2018–19 financial year release, 2017–18 financial year release, and the 2016–17 financial year release.
All figures are at 30 June for the relevant financial year. Figures have not been adjusted for inflation.
Total amount of outstanding HELP debt
This release updates the total amount of outstanding HELP debt to nearly $66.4 billion in 2019–20, down from $66.6 billion in 2018–19 (Figure 1 below). This is the first decline in total outstanding debt since the series began in 2005. However, much of this decline is attributable to fact that, unlike prior years, VET Student Loans debts and debtors are not included in the 2019–20 financial year data. This is because the Education and Other Legislation Amendment (VET Student Loan Debt Separation) Act 2018 separated the administration of VET Student Loan debts for vocational education and training students from HELP debts for higher education students from 1 July 2019.
Figure 1: total amount of outstanding HELP debt 2010–11 to 2019–20 financial years ($m)
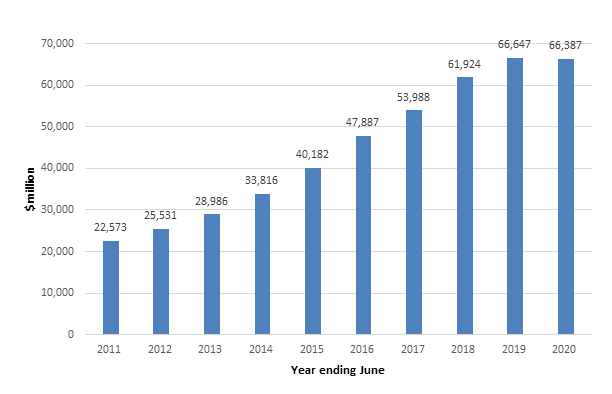
(Source: ATO, HELP statistics 2019–20, Table 5, 28 October 2020)
Since HELP is an asset on the Government’s balance sheet, ‘debt not expected to be repaid’ (DNER) is arguably more important than the overall size of the loan portfolio. The latest DNER estimate from the Australian Government Actuary is 14.69 per cent for new loans incurred in 2019–20 (Department of Education, Skills and Employment Annual Report 2019–20, p. 43). However, this estimate is based on data to 30 June 2019, which does not account for the effects of COVID-19.
The ‘fair value’ of HELP debts, which calculates the value of the loans as a Government asset, taking into account DNER and the concessional nature of HELP loans, was estimated at $50.6 billion at 30 June 2020 in the 2020–21 budget papers (p. 9-45) (HELP debt indexation is set at the Consumer Price Index, which is generally lower than the Government’s cost of borrowing). However, this estimate includes VET Student Loans, and is therefore no longer precisely comparable to the total amount of outstanding debt figures provided above.
Number of people with outstanding HELP debt
The number of people with outstanding HELP debts was 2.9 million in 2019–20, down from 3.0 million in 2018–19 (Figure 2 below). As explained above, this largely reflects the omission of VET Student Loans borrowers from the 2019–20 data. However, even before 2019–20, the rate of increase in the number of borrowers was slowing, as discussed in last year’s HELP data FlagPost.
Figure 2: total number of people with outstanding HELP debt 2010–11 to 2019–20 financial years (‘000)
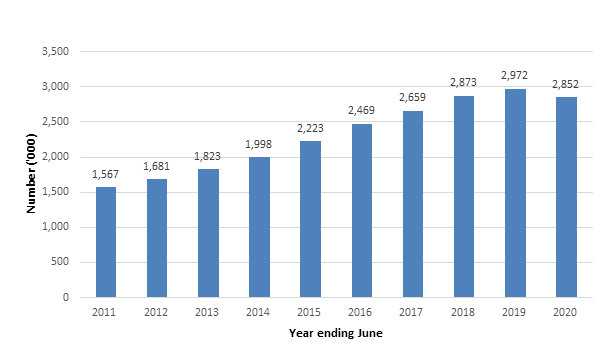
(Source: ATO, HELP statistics 2019–20, Table 5, 28 October 2020)
Size of outstanding HELP debts
Despite the decreases in the number of debtors and the overall size of outstanding debt, the number of debts above $50,000 continued to grow, reaching 256,053 in 2019–20, up from 244,201 in
2018–19. Among people with debts above $50,000, 24,544 have debts above $100,001, up from 22,514 in 2018–19. More detail is provided in Table 1 below.
The average amount of outstanding debt is $23,280, up from $22,425 in 2018–19.
The time taken to repay HELP debts has also been rising, reaching 9.3 years in 2019–20, up from 9.2 years in 2018–19.
Table 1: average debt and number of people with outstanding HELP debt by size of outstanding balance 2010–11 to 2019–20 financial years
|
2011
|
2012
|
2013
|
2014
|
2015
|
2016
|
2017
|
2018
|
2019
|
2020
|
| Average debt |
$14,404 |
$15,191 |
$15,898 |
$16,925 |
$18,075 |
$19,396 |
$20,303 |
$21,557 |
$22,425 |
$23,280 |
| Up to $10,000 |
696,577 |
723,714 |
768,048 |
799,772 |
827,484 |
851,313 |
893,574 |
910,732 |
910,821 |
841,645 |
| $10,000.01 to $12,000 |
108,154 |
117,981 |
120,642 |
119,501 |
129,860 |
136,734 |
139,944 |
149,823 |
155,742 |
146,131 |
| $12,000.01 to $14,000 |
98,392 |
103,094 |
104,464 |
119,592 |
129,003 |
142,151 |
141,177 |
153,444 |
152,355 |
137,501 |
| $14,000.01 to $16,000 |
95,257 |
99,648 |
104,059 |
109,580 |
116,075 |
124,820 |
129,834 |
138,964 |
140,701 |
129,823 |
| $16,000.01 to $18,000 |
91,046 |
94,334 |
104,921 |
110,775 |
121,207 |
122,157 |
124,045 |
131,439 |
133,832 |
123,403 |
| $18,000.01 to $20,000 |
78,345 |
80,624 |
90,900 |
106,938 |
123,654 |
139,835 |
144,259 |
133,292 |
130,733 |
135,020 |
| $20,000.01 to $30,000 |
252,253 |
269,787 |
296,244 |
338,949 |
403,064 |
473,584 |
509,360 |
548,229 |
563,779 |
544,486 |
| $30,000.01 to $40,000 |
91,733 |
114,051 |
131,384 |
157,758 |
195,492 |
242,240 |
281,594 |
328,753 |
350,824 |
347,708 |
| $40,000.01 to $50,000 |
31,679 |
42,338 |
53,877 |
67,468 |
84,863 |
110,455 |
135,795 |
169,781 |
189,044 |
189,955 |
| $50,000.01 to $60,000 |
11,978 |
17,444 |
23,705 |
32,258 |
43,096 |
56,919 |
70,265 |
87,380 |
99,389 |
102,829 |
| $60,000.01 to $70,000 |
4,601 |
7,322 |
10,589 |
15,002 |
21,035 |
29,235 |
37,363 |
50,425 |
58,675 |
60,708 |
| $70,000.01 to $80,000 |
2,429 |
3,507 |
5,009 |
7,433 |
10,629 |
15,164 |
19,996 |
27,393 |
33,374 |
35,273 |
| $80,000.01 to $90,000 |
1,515 |
2,126 |
2,943 |
4,147 |
5,827 |
8,120 |
10,809 |
14,850 |
18,772 |
20,400 |
| $90,000.01 to $100,000 |
1,034 |
1,391 |
1,851 |
2,527 |
3,563 |
5,216 |
6,996 |
9,369 |
11,477 |
12,299 |
| $100,000.01 and above |
2,107 |
3,339 |
4,652 |
6,273 |
8,189 |
10,996 |
14,046 |
18,729 |
22,514 |
24,544 |
(Source: ATO and Parliamentary Library estimates, HELP statistics 2019–20, Table 5, 28 October 2020)
Note that amounts of debt up to $10,000 have been aggregated for Table 1—more detail is available in the source tables from the ATO.