Performance information and reporting model
The DPS Outcome and Outputs
Framework consists of four outputs—with sub-outputs—and
administered work programs. The framework is summarised in Figure
14.
Performance indicators for each
output are established in the Department of Parliamentary Services
Portfolio Budget Statements 2008-09. The indicators cover the
quality, quantity and price aspects of the department's outputs or
services.
In this part of the annual report,
performance results and explanatory comments are provided against
each of the department's suboutputs.
Output cost attribution
DPS operates through a branch
structure that is aligned to its output structure.
Each branch comprises a number of
cost centres that collect all direct operating costs, including
depreciation, on an accrual basis. The internal overheads
attribution process is completed in a number of steps. First, the
costs of all corporate cost centres are allocated to sub-outputs.
Then, the cost of providing internal services (IT, communications
and accommodation) is attributed to those sub outputs that receive
the services. This methodology ensures that the department reports
the total cost of services provided to clients for each
suboutput.
The Outcome statement of DPS is
that:
occupants of Parliament House are
supported by integrated services and facilities, Parliament
functions effectively and its work and building are accessible to
the public.
Occupants of Parliament House are supported by integrated
services and facilities, ...
DPS provides occupants and other
users of Parliament House with a wide range of services and
facilities. These are described in general terms in Parts 2 and 3.
The performance reports in Parts 3 (Parliamentary Library) and 4
measure and discuss the DPS performance in delivering those
services and facilities. Environmental performance is discussed in
Part 5.
The results demonstrate success in a
variety of areas but less satisfactory performance in others.
Because of the ongoing nature of the outcome, and the scope for
providing our services more efficiently and effectively, DPS will
continue to look for further improvements.
Parliament functions effectively ...
Parliament's operations have
continued to run smoothly to the extent that this is the
responsibility of DPS. Our contribution includes:
- ensuring the security of the building,
including the chambers in particular, and of building
occupants;
- providing a suitable venue for parliamentary
activity through building maintenance and provision of building
services and information and communications technology services;
and
- providing Library and Hansard services to
enable members of Parliament to contribute effectively to
parliamentary activities.
& and its work and building are accessible to the
public.
In 2008-09, DPS facilitated access
for the general public to the work of the Parliament and its
building by:
- providing 1,473 hours of chamber
broadcasts;
- providing 2,804 hours of committee
broadcasts;
- providing print-ready Hansard transcripts on
the DPS internet site and the web interface to ParlInfo; and
- hosting 863,552 visitors, including 114,190
school children.
The effectiveness of our services is
assessed through a customer satisfaction survey conducted each
Parliament that collects customer views on:
- the appropriateness of, and satisfaction
with, existing services;
- problems with service delivery;
- identification of service gaps; and
- the extent to which services and facilities
are appropriately and conveniently integrated and accessible to
assist the user.
The survey for the 42nd Parliament
was completed in July 2009. Whilst the results are still being
fully analysed the overall outcome is positive. More detailed
analysis of the results will be included in the 2009-10 DPS Annual
Report.
Figure
14—Relationship between Outcome and Outputs
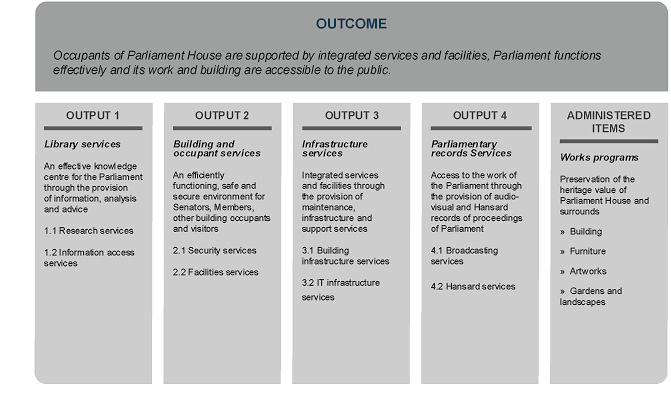
Output 1 is the provision of an
effective knowledge centre for the Parliament through the provision
of information, analysis and advice.
Performance reports for the
Parliamentary Library suboutputs 1.1 and 1.2 are set out in Part 3
of this annual report.
Introduction
Output 2 of the DPS Outcome and
Outputs Framework is the provision of an efficiently functioning,
safe and secure environment for Senators, Members, other building
occupants and visitors.
Two sub-outputs, Security services
and Facilities services, contribute to Output 2.
Sub-output 2.1—Security services
DPS provides security and emergency
services to occupants of, and visitors to, Parliament House.
Figure 15—Sub-output 2.1—Security
services—quality indicators
|
|
|
|
|
|
|
|
|
|
Extent to which security
procedures are followed
|
Percentage of reported security
incidents dealt with in accordance
with agreed procedures (target:
100%)
|
100%
|
100%
|
|
Validation of security
procedures
|
The extent to which each
validation was successful (target:
100%)
|
New
indicator
|
92%
|
Indicator—Extent to which security procedures are
followed
During 2008-09, there were 245
reported security incidents. All of these were responded to in
accordance with established procedures.
Indicator—Extent to which each validation was
successful
Security validation exercises are
conducted monthly by Parliamentary Security Service (PSS) officers
and Australian Federal Police-Uniform Protection (AFP-UP). The
results of each exercise are reviewed by the Security Management
Board.
Two of the 24 validation exercises
conducted in 2008-09 identified areas for improvement to security
arrangements and procedures. As a result of lessons learned from
these two exercises, security procedures have been updated to
address the issues identified.
Figure
16—Sub-output 2.1—Security services—quantity
indicators
|
|
|
|
|
|
|
|
|
|
Validation of security procedures
|
Percentage of security validation program
achieved
(target: 100%)
|
100%
|
100%
|
|
Security incidents
|
Number of reported security incidents
|
AFP-UP:151
|
AFP-UP: 150
|
|
PSS: 83
|
PSS: 95
|
|
Security services
|
Number of hours of internal guarding
(PSS)
|
25,212
|
25,164
|
|
Number of hours of external guarding
(AFP-UP)
|
11,722
|
11,007
|
|
Number of parliamentary and
non-parliamentary functions (including official visits) requiring
additional security resources
|
See Figure 17
|
|
Number of scheduled emergency evacuation
exercises completed
|
New indicator
|
2
|
Indicator—Validation of security procedures
Validation exercises are conducted
monthly by both the PSS and AFP-UP to test how well security
procedures work. All 24 scheduled validation exercises were
conducted in 2008-09. Six of these exercises were conducted as
joint exercises between the PSS and AFP-UP.
Indicator—Security incidents
Security incident reports are
completed in response to events that may require follow-up action,
such as protests, threatening telephone calls, non-compliance with
security screening and unattended or suspect items. Reports are
completed by AFP-UP or PSS staff.
Indicator—Security services
The number of PSS hours used each
month varies depending on the number of parliamentary sitting days
and, to a lesser extent, the number of functions held in Parliament
House.
Figures previously reported in
2007-08 for internal guarding (19,281 hours) were understated due
to a data collection error and the correct figures are reported
above.
The number of internal and external
guarding hours remained relatively stable in 2008-09.
In 2008-09, two emergency evacuation
exercises were scheduled and conducted, with one of these occurring
on a parliamentary sitting day. Both evacuations were based on a
fire evacuation scenario.
Figure
17—Number of parliamentary and non-parliamentary functions
requiring additional security resources
|
|
|
|
|
Number of
parliamentary functions
|
79
|
96
|
|
Number of official
visits
|
185
|
|
Number of
parliamentary functions requiring additional security resources
|
5
|
12
|
|
Number of official
visits requiring additional security resources
|
New indicator
|
16
|
|
Number of
non-parliamentary functions
|
676
|
419
|
|
Number of
non-parliamentary functions requiring additional security
resources
|
375
|
338
|
The PSS provides services to
parliamentary and non-parliamentary functions requiring additional
security resources. The definition of a parliamentary function
includes functions in support of the whole of Parliament but
excludes specific political party or executive government
functions.
Figure
18—Sub-output 2.1—Security services—price
indicator
|
|
|
|
|
|
|
|
|
|
Security services
|
Staff costs for:
|
|
|
|
a) internal guarding (PSS)
|
$10,593,453
|
$11,697,367
|
|
b) external guarding (AFPUP)
|
$10,479,017
|
$10,482,876
|
|
c) additional PSS guarding for
parliamentary functions
|
$11,437
|
$23,261
|
|
d) additional PSS guarding for
non-parliamentary functions
|
$354,466
|
$327,098
|
|
e) additional PSS or AFP-UP guarding for
official visits
|
New indicator
|
$31,404
|
|
Direct costs of Pass Office operations
|
$210,223
|
$165,910
|
|
Total cost of suboutput 2.1
|
$29.875m
|
$32.447m
|
Indicator—Cost of security services
The increase to internal guarding
costs is attributed to increased salary costs arising from the new
Union Collective Agreement and an increase in overtime expenditure.
In response to increasing overtime costs in the first half of
2008-09, more efficient rostering practices were implemented in
consultation with employee and union representatives.
The increased cost for sub-output
2.1 includes an annual depreciation charge associated with new
x-ray screening equipment.
There is no cost recovery applied to
security services provided to parliamentary functions. The cost of
security services for nonparliamentary functions is recovered from
function organisers.
Sub-output 2.2—Facilities services
DPS provides facilities management,
health and wellbeing and visitor services to occupants of and
visitors to Parliament House.
Figure
19—Sub-output 2.2—Facilities services—quality
indicators
|
|
|
|
|
|
|
|
|
|
Customer satisfaction
|
High level of building occupant and/or
user satisfaction with facilities contracts for catering, cleaning,
pest control and sanitary services
|
New indicator
|
See Figure 20
|
|
Number of complaints about facilities
contracts for catering, cleaning, pest control and sanitary
services
|
69
|
82
|
|
Visitor satisfaction
|
Number of complaints about guide
services
|
3[12]
|
14
|
|
Number of complaints about the Parliament
Shop
|
0
|
|
Number of complaints about facilities
contracted for catering, cleaning, pest control and sanitary
services
|
New indicator
|
44
|
Quality indicators
To provide additional detail the
quality indicators for sub-output 2.2 were revised in the
Department of Parliamentary Services Portfolio Budget Statements
2008-09. The term customer refers to Parliament House building
occupants, whilst the term visitor is taken to mean members of the
public visiting Parliament House.
Indicator—Customer satisfaction
The DPS 2009 Customer Satisfaction
Survey asked customers to rate their level of satisfaction with a
range of DPS services. The preliminary results for the components
of Facilities services are provided in Figure 20. Besides supplying
information on current levels of customer satisfaction, survey
results are used to inform strategic planning to improve
services.
Figure
20—Customer Satisfaction Survey results
|
|
|
|
|
|
|
|
Catering
|
42
|
57
|
|
Cleaning
|
68
|
67
|
|
Health and Recreation Centre
|
84
|
80
|
|
Non-catered functions
|
60
|
68
|
|
Nurses Centre
|
85
|
92
|
|
Parliament Shop
|
88
|
90
|
|
Visitor Services (Guides)
|
88
|
88
|
|
Child care
|
Not applicable
|
70
|
Contracted catering services saw a
substantial increase in user satisfaction over the previous survey,
(57% in the July 2009 survey compared with 42% in the 2006-07
survey). This is attributable to a change in catering contractors
from 1 July 2008, and better arrangements being built into those
contracts for gathering and responding to customer feedback, as
discussed under Customer complaints below.
Cleaning includes two contracts
covering internal and external cleaning. Pest control and sanitary
services are not specifically addressed in the survey. Satisfaction
with cleaning remained relatively static between the two
surveys.
Indicator—Customer complaints
Facilities Management section
welcomes feedback from building occupants, and uses this feedback
to help improve services provided. We received 82 complaints from
building occupants in 2008-09, up from 69 complaints received in
2007-08. This is considered to be a result of substantially
improved processes for gathering customer feedback implemented in
2008-09, including expanding the number of avenues available for
customers to comment on services provided. The introduction of two
new catering contractors from 1 July 2008 may have also resulted in
a temporary increase in complaints as the new contractors
accustomed themselves to parliamentary operations.
Analysis of complaints received
indicates the majority relate to the standard of services provided,
with a smaller number of complaints relating to catering for
functions in Parliament House.
In light of the significant
improvement shown in preliminary results for customer satisfaction
with catering in the recent survey, and the renewed focus on
collecting and responding to customer complaints, we anticipate the
incidence of customer complaint to decrease in future years.
Indicator—Visitor satisfaction
Visitor satisfaction measures
provide feedback on how well visitor services are delivered, and
how well visitor expectations are met. 2008-09 saw the Facilities
Management section introduce a new, comprehensive approach to
recording visitor complaints. The majority of the 44 visitor
complaints received were about food availability and tour
times.
In 2008-09, 14 complaints were
received relating to guide services, representing 0.002% of the
863,552 visitors recorded over the period. Most of the complaints
related to the timing of guided tours.
No complaints were received about
the Parliament Shop.
Figure
21—Sub-output 2.2—Facilities services—quantity
indicators
|
|
|
|
|
|
|
|
|
|
Facilities Management
|
Number of parliamentary functions
supported by Facilities Management
|
New indicator
|
258
|
|
Number of official visits supported by
Facilities Management
|
New indicator
|
4
|
|
Number of non-parliamentary functions
supported by Facilities Management
|
New indicator
|
766
|
|
Number of parliamentary and
non-parliamentary catered functions held at Parliament House
|
New indicator
|
1,261
|
|
Total number of catered and non-catered
parliamentary and non-parliamentary functions held at Parliament
House
|
New indicator
|
2,285
|
|
Number of contracted labour hours used for
official visits and parliamentary functions
|
New indicator
|
465
|
|
Nurses Centre
|
Number of incidents and accidents
(including requests for first aid) managed by the Nurses Centre
|
925
|
787
|
|
Number of vaccinations delivered under
Influenza Vaccination Program
|
558[15]
|
620
|
|
Health and Recreation Centre
|
Number of members, by category:
|
|
a) Senators and Members
|
67
|
72
|
|
b) staff of Senators and Members
|
23
|
16
|
|
c) others (building occupants)
|
667
|
584
|
|
Number of casual visits by category of
user:
|
|
a) Senators and Members
|
33
|
14
|
|
b) staff of Senators and Members
|
667
|
828
|
|
c) others (building occupants)
|
680
|
643
|
|
Classes conducted:
|
|
total number of classes
|
New indicator
|
590
|
|
total number of places in classes
|
6,156
|
6,322
|
|
total number of attendees at classes
|
3,750
|
3,954
|
|
Community engagement with Parliament
House
|
Total number of visitors[16]
|
867,220
|
863,552
|
|
Total number of general (public) tours
conducted
|
4,981
|
4,527
|
|
Total number of school tours conducted
|
3,256
|
3,310
|
|
Total number of special tours
conducted
|
610
|
454
|
|
Total number of paid tours conducted
|
New indicator
|
70
|
|
Total number of participants in general
(public) tours
|
101,236
|
|
Total number of participants in school
tours
|
114,086
|
119,765
|
|
Total number of participants in special
tours
|
9,825
|
7,095
|
|
Total number of participants in paid
tours
|
New indicator
|
2,296
|
|
Total number of participants in garden
tours
|
330
|
348
|
|
Total number of filming and photographic
requests processed
|
New indicator
|
325
|
|
Parliament Shop customers
|
Total number of visitors to the Parliament
Shop
|
New indicator
|
280,002
|
|
Total number of purchases from the
Parliament Shop
|
62,257
|
65,019
|
Indicator—Facilities management
This series of indicators is new and
was introduced in the Department of Parliamentary Services
Portfolio Budget Statements 2008-09 to provide greater facilities
workload and performance information. Statistics on the indicators
are not available for prior years.
The 2008-09 figures indicate a large
number of catered and non-catered functions (2,285) were held in
Parliament House. For DPS, this has an effect on a number of
services and resources deployed, including facilities utilised,
catering, cleaning, visitor services and security staff.
Indicator—Nurses Centre
The Nurses Centre focuses on the
delivery of a range of health services to both visitors and
occupants of Parliament House.
The preliminary results of the
Customer Satisfaction Survey 2009 (see Figure 20) recorded
increased satisfaction with the Nurses Centre (from 82% in 2006-07
to 92% in 2008-09). The centre experienced a slight increase in
demand for its services during the year, and there was also a
marked increase in participants in the Influenza Vaccination
Program.
Indicator—Health and Recreation Centre
The Health and Recreation Centre
provides management of health, recreation and sporting facilities
for Parliament House, as well as direct services for building
occupants such as fitness classes and assessments.
An important development during the
year was the conversion of two under-utilised tennis courts into a
multipurpose court, enhancing the range of health and recreation
activities available to building occupants.
Total membership of the Health and
Recreation Centre fell 11% from the 30 June 2008 high of 757 to 672
at 30 June 2009, although casual attendance increased by 8% over
the same period. This coincided with a slight reduction in customer
satisfaction with the centre, from 84% in 2006-07 to 80% in 2008-09
(see Figure 20).
Total attendance at Health and
Recreation Centre classes increased by 5% over the year.
Indicator—Community engagement with Parliament House
Figure
22—Parliament House Visitors 1988-2009
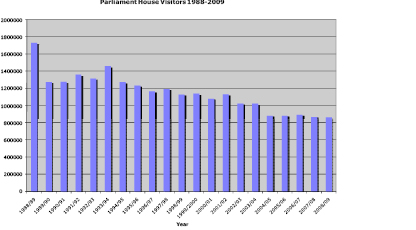
The number of visitors figure is a
count of people entering Parliament House through the main front
entrance. Total visitor numbers to Parliament House slightly
decreased by 0.42% compared to 2007-08. This decrease in total
visitors continues the long-term trend of a slight decline of
visitors since Parliament House opened in 1988.
The number of general (public) tours
conducted during the year fell, reflecting new reduced frequency
tour schedules put in place in the last quarter of 2008-09. These
reductions were part of broad departmental efforts to reduce costs
and, in the case of tours, also reflected a transfer of resources
to support an increase in the number of school tours (which rose by
2% in 2008-09 on the previous year).
A number of new indicators have been
included for community engagement in 2008-09, recognising the
importance DPS places on community engagement and also to provide
better workload and performance information.
Indicator—Parliament Shop
The Parliament Shop is a gift and
souvenir retail outlet, run by DPS for the benefit of visitors and
building occupants.
The quantity indicators for the
Parliament Shop (see Figure 21) have been expanded for the 2008-09
year. They now include visitors to the shop, which is a count of
the number of people entering the shop. No prior year data is
available for this indicator. The second indicator, Total number of
purchases from the Parliament Shop , was previously reported as
Total number of customers . This indicator records the number of
purchases from the shop.
Together, the two quantity
indicators will enable more accurate assessments of purchasing
patterns and enhance commercial decision making. In 2008-09, 23% of
Parliament Shop visitors went on to make a purchase, and the total
number of purchases made increased by 4%, despite a slight
reduction in overall visitor numbers to the building. This suggests
in part a successful outcome from the review of merchandising
arrangements in 2008-09, which improved the commercial focus of the
Parliament Shop's operations. The continuation of this focus into
the future is expected to result in improved conversion of visitors
to the shop into purchases from the shop.
The Parliament Shop also recorded a
modest (2%) improvement in building occupant satisfaction (see
Figure 20).
Figure
23—Sub-output 2.2—Facilities services—price
indicator
|
|
|
|
|
|
|
|
|
|
Facilities services
|
Cleaning costs under contracts:
|
|
a) internal cleaning costs
|
$3,561,259
|
$3,648,785
|
|
b) industrial cleaning costs
|
$999,659
|
$1,006,774
|
|
c) cost of additional labour (including
function set up)
|
New indicator
|
$114,742
|
|
Waste management costs under contracts
|
$139,004
|
$159,666
|
|
Gross revenue from non-catered
functions
|
$37,599
|
$28,534
|
|
Gross revenue from:
|
|
a) Press Gallery licensees
|
$1,020,313
|
$1,067,397
|
|
b) catering contractors
|
$350,954
|
$451,035
|
|
c) other licensees
|
$189,571
|
$184,632
|
|
Management fee paid to catering
contractor(s)
|
$243,009
|
$150,000
|
|
Nurses Centre: direct costs
|
$209,229
|
$199,079
|
|
Health and Recreation Centre: net costs
(direct costs less revenue)
|
$92,940
|
$117,360
|
|
Parliament House Guides services: net
costs (direct costs less revenue received from paid tours)
|
$1,465,102
|
$1,494,021
|
|
Parliament Shop: revenue (target:
$1.3m)
|
$1,119,293
|
$1,207,257
|
|
Parliament Shop: net profit (target: 10%
of revenue)
|
$227,768
20.3%
|
$234,777
19.5%
|
|
Total cost of sub-output 2.2
|
$9.918m
|
$10.905m
|
Indicator—Facilities services
The total cost for sub-output 2.2
Facilities services increased by 10% in 2008-09 over the 2007-08
total cost.
New major catering contracts came
into effect from 1 July 2008. As was expected, DPS was required to
underwrite the operating costs of one of these contracts, although
management fees paid were significantly reduced from fees under the
previous contract, and gross revenues from the catering contractors
increased by 29% from the previous year.
A significant drop in non-catered
function revenue was experienced, due to the reduced number of
large events in Parliament House in 2008-09 compared to
2007-08.
The Parliament Shop's net profit
increased by 3%, on the back of a solid 5% increase in shop
revenues. Net profit remained well above the 10% of revenue
target.
Significant increases in direct
costs for the Health and Recreation Centre (26%) eroded the
otherwise strong revenue results. For the Health and Recreation
Centre, increased staff costs combined with slightly reduced
revenues brought about the net increase in costs.
The outlook for Facilities
Management is one of continuing focus on careful administration,
revenue expansion and cost reduction. The focus for facilities
management will be improved service delivery and improving
management practices.
Introduction
Output 3 of the DPS Outcome and
Outputs Framework is the supply of integrated services and
facilities through the provision of maintenance, infrastructure and
support services.
This output comprises two
sub-outputs—Building infrastructure services and IT
infrastructure services.
Sub-output 3.1—Building infrastructure services
This sub-output involves the
provision of building and security infrastructure, maintenance
services and landscape services.
Figure
24—Sub-output 3.1—Building infrastructure
services—quality indicators
|
|
|
|
|
|
|
|
|
|
Extent to which the building condition is
maintained
|
Building Condition Index (target:
89-92%)
|
89.3%
|
89.2%
|
|
Extent to which the landscape condition is
maintained
|
Landscape Condition Index (target:
90%)
|
83.0%
|
75.0%
|
|
Condition and ageing of engineering
systems
|
Engineering Systems Condition Index
(target: 90%)
|
90.0%
|
89.1%
|
|
Performance of security systems
|
Scheduled availability of operational
systems:
|
|
(a) card management system (target:
100%)
|
100%
|
100%
|
|
(b) radio communications equipment
(target: 100%)
|
100%
|
100%
|
|
(c) x-ray equipment / walk-through metal
detection (target: 95%)
|
100%
|
100%
|
|
(d) CCTV system
(target: 98%)
|
100%
|
100%
|
|
(e) electronic door locks (target:
99.8%)
|
100%
|
100%
|
|
(f) alarms (target: 99.9%)
|
100%
|
100%
|
Explanation of indicators
The Building Condition Index (BCI)
measures the current condition of the building fabric of Parliament
House, expressed as a percentage of the original condition.
The Landscape Condition Index (LCI)
measures the current condition of the landscape surrounding
Parliament House, expressed as a percentage of the total possible
condition.
The Engineering Systems Condition
Index (ESCI) measures the current operation and condition of the
engineering systems in Parliament House against the expected
decline of those systems through their life cycles. The system of
scoring has been designed so that the optimum target of 90% is
achieved if all systems are ageing through their life cycle as
expected.
Indicator—Extent to which building condition is
maintained
Parliament House is divided into
seven zones, as shown in Figure 25, to measure the BCI. The seven
zones have different condition targets that combine to give an
overall score for the BCI. The target range of 89-92% has been
determined, based on external benchmarks, as the optimum balance of
condition and cost.
Figure
25—Building Condition Index score by zone
|
|
|
|
|
Public Areas
|
89.7
|
89.4
|
|
Parliamentary Chambers
|
92.6
|
91.8
|
|
Ministerial Wing
|
89.7
|
89.6
|
|
Senate Wing
|
89.9
|
89.5
|
|
House of Representatives Wing
|
89.4
|
89.3
|
|
Back of House
|
84.4
|
84.7
|
|
Plant Rooms
|
89.3
|
89.9
|
|
Total Score
|
89.3
|
89.2
|
There has been a very slight 0.1%
decrease in the overall building condition when compared to
2007-08, which reflects the effects of ageing and use since the
building opened in 1988. The largest decrease (0.8%) occurred in
the score of the Parliamentary Chambers. The reduction is primarily
related to leather and fabric materials requiring maintenance or
refurbishment in public gallery seating, chamber floor seats and
desks, and commissioned furniture pieces.
Indicator—Extent to which landscape condition is
maintained
The parliamentary landscape has been
divided into eight zones for the purpose of measuring the LCI. The
zones have different targets that combine to give an overall
score.
There was an 8% decrease in overall
landscape condition in 2008-09, with the result being 15% below the
target. Parliament House is in the third consecutive year of ACT
stage 3 water restrictions, with significant parts of the landscape
not able to be watered. This has had a cumulative impact on the
landscape condition.
Most areas with significant drops
are reflecting deterioration in turf condition, either through
reduced or no watering. Wind and storm erosion has occurred where
areas are not being watered, such as turf along the outside of
Parliament Drive, corner lawns, ministry turf and front lawns.
Indicator—Condition and ageing of engineering
systems
To calculate the ESCI, 83
engineering and structural systems—including airconditioning,
hydraulic, power, fire and security systems—are scored for
reliability, life cycle progress and actual versus expected
condition.
The overall ESCI just failed to meet
the target of 90% for 2008-09, achieving a score of 89.1%.
Engineering services related items decreased by 1.7% to a score of
87.1%, due to a number of ageing electrical, security and special
services systems requiring maintenance or replacement. The building
structure and surfaces score increased by 0.5% to 92.4%
Several systems are approaching the
end of their life and preparations are underway for their
replacement over the next few years. These systems include the
central energy plant, kitchen equipment and exterior street and
floodlighting.
Indicator—Performance of security systems
The card management system, closed
circuit television system (CCTV), radio network, electronic doors,
and alarms are connected to a single security network. Overall, the
security network remains stable, and there are a range of built-in
redundancies to ensure the system continues to function in the
event of equipment failure.
Standard security foot patrols are
backed up by daily camera coverage checks and weekly camera
maintenance. Performance checks are conducted on all CCTV cameras
to ensure they are operational. From time to time these routine
checks identify individual camera units that require some form of
maintenance, but this does not detract from the overall performance
of the CCTV system. Faults with individual camera units are
generally rectified within acceptable timeframes.
Figure
26—Sub-output 3.1—Building infrastructure
services—quantity indicators
|
|
|
|
|
|
|
|
|
|
Managing the potential impact on the
environment
|
Electricity consumption
(target: 88,345 Gj)
|
88,642 Gj
|
92,386Gj
|
|
Gas consumption
(target: 42,659 Gj)
|
41,015 Gj
|
43,522Gj
|
|
Greenhouse gas emissions[17] (target: 23,428 tonnes
CO2e)
|
22,286
tonnes CO2e
|
22,743
tonnes CO2e
|
|
Water consumption Total (target: 190,858
kL[18])
|
163,481 kL
|
167,662kL
|
|
a) landscape water consumption; and
|
New indicator
|
97,244kL
|
|
b) building water consumption
|
New indicator
|
70,418kL
|
|
Waste recycled as a percentage of total
waste generated (target: 45%)
|
43.0%
|
44.0%
|
|
Maintenance of plant and building
fabric
|
Percentage of planned maintenance
achieved
(target: 85%)
|
94.0%
|
90.5%
|
|
Maintenance help desk requests
|
Total number of calls
|
3,790
|
2,943
|
Indicator—Managing the
potential impact on the environment
All environmental and heritage
performance reporting information has been consolidated in Part 5
of the annual report. Part 5 includes information on the Managing
the potential impact on the environment indicator.
Indicator—Maintenance of plant and building fabric
The Maintenance Services section
achieved 90.5% of the planned maintenance for 2008-09 against a
target of 85%. This result is 3.5% down on the 2007-08 outcome. The
2007-08 result was achieved in an election year when greater access
to areas for maintenance was possible.
Indicator—Maintenance help desk requests
The number of calls to the
Maintenance Services help desk fell this year. This can be
attributed to the successful completion of a new and comprehensive
preventative maintenance program.
Figure
27—Sub-output 3.1—Building infrastructure
services—price indicators
|
|
|
|
|
|
|
|
|
|
Maintenance
|
Target: Maintenance costs reduced by 1.25%
from previous year
|
$19,208,066
|
$18,696,900
(-2.7%)
|
|
Energy
|
Target: Energy cost reduced by 1.25% from
previous year
|
$2,698,528
|
$2,930,575
(+8.6%)
|
|
Water
|
Target: Water cost reduced by 1.25% from
previous year
|
514,720[19]
|
$615,652
(+19.6)
|
|
Cost of water: $/ha landscape
|
New indicator
|
$261,049
|
|
Cost of water: building
|
New indicator
|
$798,743
|
|
Building infrastructure services
|
Total cost of sub-output 3.1
|
$21.210m
|
$19.874m
(-6.7%)
|
Indicator—Energy cost
The 2008-09 year saw an increase in
energy consumption of 4.8% which resulted in an increase in energy
costs of 8.6%. These figures represent the current costs of energy
during a normal parliamentary sitting year.
Indicator—Water cost
The price indicator for water has
changed. It previously reported on the combined cost of water and
sewerage. The cost of water for the 2008-09 year was $615,652, an
increase of 19.6% on 2007-08. However, consumption for the same
period increased by only 2.6%.
Indicator—Total cost of sub-output
The total cost of providing building
infrastructure services has decreased by 6.7% compared to 2007-08.
Given previously mentioned increases in the cost of water and
electricity, CPI increases in other maintenance contracts, and
salary increases provided for in the DPS certified agreement, this
is a major achievement in improving our overall maintenance
practices.
With several major elements of the
building infrastructure nearing their end of life, asset
replacement will provide opportunities to review the approach to
maintaining these assets. While some savings are expected, they may
not be realised for several years.
Sub-output 3.2—IT infrastructure services
IT infrastructure services provided
include the maintenance of information technology, broadcasting and
telecommunications infrastructure, and customer support for these
services.
Figure
28—Sub-output 3.2—IT infrastructure
services—quality indicators
|
|
|
|
|
|
|
|
|
|
Customer satisfaction
|
High level of user satisfaction
|
Not applicable[20]
|
53
|
|
Number of user complaints
|
58
|
50
|
|
High level of critical systems
availability
|
The total time that critical systems are
unavailable during scheduled service hours, and critical system
availability expressed as a percentage of scheduled service hours
(target: 100% availability):
|
|
a) information technology infrastructure
(computing services)
|
99.96% (unavailable for
4:44hrs)
|
99.99%
(unavailable for 1:46hrs)
|
|
b) information technology infrastructure
(network)
|
99.99%
(unavailable for 1hr)
|
99.98% (unavailable for 2hrs)
|
|
c) broadcast support infrastructure
|
100%
(unavailable for 0:08hrs)
|
100% (unavailable for 0:09hrs)
|
|
d) telecommunications infrastructure
|
100%
(unavailable for 0:00hrs)
|
100%[21]
(unavailable for 0:00hrs)
|
|
Timeliness of incident resolution
|
Percentage of support requests resolved
within service standards as follows (target: 95%):
|
|
a) immediate priority—response 15
minutes, resolution 2 hours
|
90.26%
|
89.04%
|
|
b) high priority—response 30
minutes, resolution 4 hours
|
96.18%
|
96.83%
|
|
c) medium priority—response 30
minutes, resolution 8 hours
|
97.38%
|
95.25%
|
|
d) as agreed—response 60 minutes,
resolution as agreed
|
98.20%
|
97.67%
|
Indicator—High level of critical systems
availability
Systems identified as critical in
the Department of Parliamentary Services Portfolio Budget
Statements 2008-09 are:
- House of Representatives applications:
- Chamber applications; and
- Table Office applications;
- Senate applications:
- Chamber applications; and
- Table Office applications;
- Hansard applications;
- OneOffice;
- Building Management System (BMS);
- Parliamentary Computing Network (PCN);
- home servers;
- print servers;
- email;
- sound reinforcement; and
- DPS applications:
- SAP; and
- PeopleSoft.
Critical systems availability is
defined as critical systems being operational and useable during
scheduled service hours.
Although the 100% target for all
critical systems availability was not met, overall performance
achieved high levels of availability. Responses to interruptions
were timely and technical staff had the skills and resources to
quickly diagnose and correct the faults.
IT critical systems were unavailable
on various occasions throughout the year, with total aggregate
outages being 64 minutes. The system failures were due to:
- The three email servers had an aggregate
unavailability of 18 minutes during July 2008. This was due to
email queue problems associated with the spam management software,
each of which required a server reboot. The spam management
software has been replaced and the problems have been
resolved.
- One email server affecting DPS was
unavailable for 10 minutes due to a server reboot in March
2009.
- Two of the six servers holding network drives
had an aggregate unavailability of 21 minutes during the year.
- The print server was unavailable for 10
minutes due to a software problem that required a reboot in March
2009.
- The chamber systems server that underpins
Hansard and Table Office systems was unavailable for five minutes
due to a server reboot in June 2009.
Isolated parts of broadcasting
infrastructure were unavailable for a total of nine minutes and 10
seconds during business hours. Service interruptions were as
follows:
- Loss of 10 seconds of audio in Committee Room
2S1 on Tuesday 2 June due to operator error.
- Loss of Committee Room audio system for nine
minutes during estimates hearings in February 2009.
Broadcasting Infrastructure Support
achieved an exceptional level of system availability. This can be
attributed to preventative maintenance carried out during
2008-09.
IT infrastructure (network) down
time was largely due to the failure of small-scale communications
devices that connect PCs and printers from office areas to the
network. During business and sitting periods these failed devices
are quickly replaced, but outside these times a failed device might
only be restored the next morning, before commencement of the next
business day.
Major network components have a high
degree of fault tolerance, with most of the critical systems being
connected to the network via two communication paths. Faults that
are detected in the major network switches can therefore be
bypassed without affecting the overall performance of the
network.
Telecommunications infrastructure
down time was mostly attributed to the failure of individual
handsets. The PABX system has a backup processor which takes over
when any system faults occur. Given the number of handsets that are
deployed, individual handset failures have an isolated, but
personal, impact on performance.
Indicator—Timeliness of incident resolution
Service standards for resolution of
Client Support 2020 help desk requests with high, medium or as
agreed priority, totalling 49,780—99% of all calls—were
met comfortably. Responses to immediate priority requests did not
meet the 95% target for the 2008-09 year; only 89.04% of immediate
priority requests were handled within the service standard. This
failure was attributable to increased support desk call
volumes.
Indicator—Support services
The demand for IT resources and
support services continues to increase at significant rates.
Infrastructure Services Branch regularly monitors demand on
services, and industry trends, to enable DPS to anticipate future
needs of the users of the Parliamentary Computing Network
(PCN).
The reduction in the number of phone
calls made and facsimiles sent via the broadcast facsimile gateway
can be attributed to mobile phones and the internet offering
alternative ways of sharing information.
Figure
29—Registered PCN users
|
|
|
|
|
|
|
|
|
|
|
Department of Parliamentary Services
|
1,350
|
1,315
|
1,054
|
1,111
|
1,125
|
+1.3%
|
|
Department of the Senate
|
232
|
224
|
244
|
246
|
235
|
-4.5%
|
|
Department of the House of
Representatives
|
264
|
255
|
281
|
262
|
240
|
-8.4%
|
|
Senators and staff
|
718
|
742
|
892
|
796
|
940
|
+18.1%
|
|
Members and staff
|
1,531
|
1,425
|
1,636
|
1,658
|
1,938
|
+16.9%
|
|
Other clients (DoFD)
|
450
|
413
|
309
|
302
|
317
|
+5%
|
|
Total
|
4,545
|
4,374
|
4,416
|
4,375
|
4,795
|
+9.6%
|
Figure
30—Sub-output 3.2— IT infrastructure
services—quantity indicator
|
|
|
|
|
|
|
|
|
|
Support services
|
Number of support services, by
category:
|
|
a) support desk calls
|
51,948
|
52,131
(+0.3%)
|
|
b) training services
|
472
student days
|
421
student days
(-11%)
|
|
c) consultations
|
7,570 hours
|
6,749.32 hours
(-11%)
|
|
d) total number of registered users on the
parliamentary Computing Network (PCN)[22]
|
4,375
|
4,795
|
|
e) amount of storage under management
|
10,587GB
|
14,248GB
(+34.6%)
|
|
f) emails transmitted across internet
|
26,963,482
|
31,019,589
(+15%)
|
|
g) external web accesses from PCN
|
21,336GB
Downloaded
|
26,498GB
Downloaded
(+24.2%)
|
|
h) number of telephone calls made[23]
|
2,931,214
|
2,558,032
(-12.7%)
|
|
i) number of facsimiles sent
|
674,584
|
355,280
(-47.3%)
|
|
Volume of IT services required
|
Number and percentage change in registered
users supported on the PCN
|
4,375
|
4,795
(+9.6%)
|
Indicator—Volume of IT services required
This year saw a 9.6% increase in the
total number of PCN users from 2007-08. The main areas of growth
were Senators and Members and their staff. This is likely to be a
reflection of staff ceasing without informing the IT areas that the
account can be terminated. A review of accounts no longer in use is
scheduled for September 2009 so that those belonging to staff no
longer employed can be terminated.
Figure
31—Sub-output 3.2— IT infrastructure
services—price indicators
|
|
|
|
|
|
|
|
|
|
IT support infrastructure
|
Cost per registered user
|
$2,432
|
$2,322
(-4.5%)
|
|
Broadcasting support infrastructure
|
Cost per broadcast hour
|
$1,744
|
$1,133
(-35.0%)
|
|
Telecommunications infrastructure
|
Total costs
|
$3,854,004
|
$3,085,870
(-19.9%)
|
|
IT infrastructure services
|
Total cost of sub-output 3.2
|
$18.883m
|
$20.052m
(+1.6%)
|
Indicator—Total of sub-output
The increase in the total cost of
sub-output is due to an increase in depreciation expense resulting
from an asset revaluation in 2008-09. The total IT infrastructure
services amount also includes an overhead component for
accommodation, administration and corporate costs.
Total cost of sub output 3.2 for
2007-08 has been revised by $859k (from $19.742m to $18.883m) in
line with the changes to recognition of revenue found in Note 1
paragraph 1.22 of the Financial Statements (see page 147).
Introduction
Output 4 of the DPS Outcome and
Outputs Framework is access to the work of the Parliament through
the provision of audio-visual and Hansard records of parliamentary
proceedings.
Two sub-outputs, Broadcasting
services and Hansard services, contribute to Output 4.
Sub-output 4.1—Broadcasting services
Broadcasting services involve the
production of an audio visual record of parliamentary proceedings
(including committees) which are available for broadcasting and
archiving.
Figure
32—Sub-output 4.1—Broadcasting services—quality
indicator
|
|
|
|
|
|
|
|
|
|
Customer satisfaction
|
High level of customer satisfaction
|
Not applicable[24]
|
87%
|
|
Number of customer complaints
|
4
|
3
|
Indicator—Customer satisfaction
The preliminary results of the DPS
2009 Customer Satisfaction Survey indicated a high level of
satisfaction with 87% of respondents reporting they were satisfied
or very satisfied with Broadcasting services.
During 2008-09, three formal
complaints were received (down from four the previous year). These
were due to human errors and technical failures which adversely
affected broadcasting services. Procedures have been revised and
business continuity plans updated to minimise the risk of
recurrence.
Seventeen plaudits were received
including complimentary feedback from the Department of the Prime
Minister and Cabinet and the office of the Usher of the Black Rod
for our coverage of the GovernorGeneral's swearing-in ceremony and
also for services provided to the new Australian Public Affairs
Channel (A-PAC).
Figure
33—Sub-output 4.1—Broadcasting services—quantity
indicator
|
|
|
|
|
|
|
|
|
|
Broadcasting services
|
Hours of material captured on audio-visual
record, by category:
|
|
a) chambers
|
929
|
1,473
|
|
b) committees
(ACT hearings)
|
785
|
1,721
|
|
c) committees
(interstate hearings)
|
423
|
1,083
|
|
Number of other productions
|
New indicator
|
789
|
|
Number of audio-visual services
|
1,081
|
1,373
|
|
Number of master control services
|
921
|
1,532
|
|
Number of requests for extracts of
parliamentary broadcast material
|
New indicator
|
1,245
|
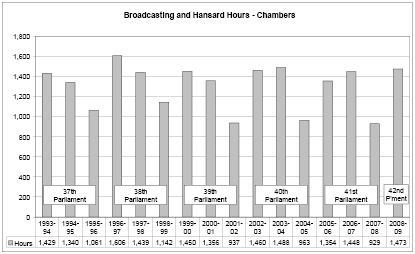
Indicator—Broadcasting services (quantity)
Chambers
There were 1,473 hours of chamber
proceedings broadcast (television and audio) in 2008-09. This is a
large increase when compared with 2007-08 (929 hours) and an 8.7%
increase on the activity levels in the preceding post-election
year, 2005-06 (1,354 hours).
Figure
34—Broadcasting and Hansard—Chamber Hours 1993-94 to
2008-09
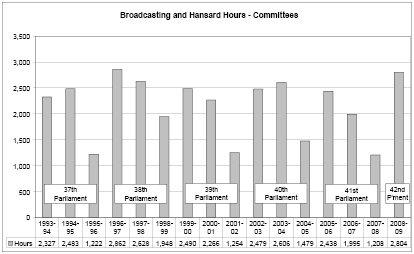
Committees
In 2008-09, 2,804 hours of
parliamentary committee hearings were recorded. This is a large
increase when compared with the 2007-08 election year (1,208 hours)
and 13% higher than the preceding post-election year, 2005-06
(2,486 hours).
As in previous years, Senate
Estimates hearings (Estimates) placed considerable pressure on
broadcasting resources. During each week of Estimates, four Senate
committees generally sit concurrently from 9am until 11pm. This is
in addition to sittings of the House of Representatives, the Main
Committee of the House of Representatives and, on occasion, House
of Representatives Standing Committees. In 2008-09 some Estimates
committees again made use of the spillover provisions, resulting in
additional days of hearings.
Figure
35—Broadcasting and Hansard—Committee Hours 1993-94 to
2008-09
Other productions
In addition to core broadcasting
business, DPS also provides audio-visual and production services on
a cost recovery basis. These services are subject to availability
of staff not otherwise engaged on primary parliamentary
broadcasting duties. There were 789 other productions in 2008-09.
This is the first year this activity has been recorded as a
separate service.
Audio-visual services
In 2008-09, DPS provided 1,373
stand-alone audio-visual services—an increase of 27% over
2007-08. This service mostly involves the loan of audio-visual
equipment to clients in Parliament House. It also includes sound
reinforcement and recording services for functions, meetings,
seminars and special events.
Master control services
Master control services involve DPS
staff making audio and video patches to connect external media
organisations to the broadcast of selected parliamentary
proceedings and other special event productions inside and in the
grounds outside Parliament House. In 2008-09 the number of master
control services increased significantly from 921 in 2007-08 to
1,532 due to the busy post-election workload. The new Australian
Public Affairs Channel (A-PAC) also relied on our master control
services to enable their broadcasts of parliamentary proceedings
until their own infrastructure was installed in Parliament
House.
Requests for extracts of parliamentary broadcast material
DPS received 1,245 requests for
extracts of parliamentary broadcast material, most of which were
for chamber proceedings. Requests for this service came primarily
from Senators and Members. This activity is reported for the first
time this year.
Figure
36—Sub-output 4.1—Broadcasting services—price
indicators
|
|
|
|
|
|
|
|
|
|
Broadcasting services
|
Cost per hour of material captured on
audio-visual record, by category:
|
|
a) chambers
|
$961
|
$570
(-41%)
|
|
b) committees (ACT hearings)
|
$998
|
$527
(-47%)
|
|
c) committees (interstate hearings)
|
$1,198
|
$875
(-27%)
|
|
Cost of other productions
|
New indicator
|
$324,110
|
|
Cost recovery from other productions
|
New indicator
|
$337,061
|
|
Total cost of sub-output 4.1
|
$6.051m
|
$6.267m
|
Indicator—Broadcasting services (price)
The decreased cost per hour of
material captured on the audio-visual record for chambers and
committees is due to the substantial increase in broadcast hours
when compared to the 2007-08 election year.
Overall the total cost for
broadcasting services in 2008-09 increased by 3.6%. This was due to
a combination of salary increases and higher travel expenditure
necessary to support the large number of away committees (340 in
2008-09 compared with 222 in 2005-06, the last post-election year).
The increases were kept to a minimum through cost-saving
initiatives such as a more efficient rostering system and
implementing sessional employment for some staff.
Cost of other productions
The cost to DPS of other productions
in 2008-09 was $324,110. This figure is reported for the first time
this year.
Cost recovery from other productions
DPS recovered $337,061 through
charging for services provided to clients for non-parliamentary
business. In 2008-09 the schedule of charges was reviewed and
increased to more accurately reflect current DPS costs associated
with providing these services.
Sub-output 4.2—Hansard services
Hansard services comprise
transcribing and publishing reports of proceedings in the Senate,
the House of Representatives and all parliamentary committees.
Hansard also provides transcription services for some ministerial
or parliament-related conferences.
Figure
37—Sub-output 4.2—Hansard services—quality
indicators
|
|
|
|
|
|
|
|
|
|
Customer satisfaction
|
High level of customer satisfaction
|
Not applicable[25]
|
83%
|
|
Number of customer complaints
|
2
|
5
|
|
Accuracy of transcription
|
Error rate as notified by customers
(target: maximum of 5 errors per 100 pages transcribed):
|
|
a) chambers
|
3.0 errors
|
2.7 errors
|
|
b) committees
|
1.4 errors
|
0.7 errors
|
|
Timeliness of transcription
|
Percentage of transcripts delivered for
chambers within service standards (target: 95%):
|
|
a) individual draft speeches (2 hours
after speech finishes)
|
94%
|
95%
|
|
b) electronic proof Hansard reports
(within 3 hours after house rises)
|
74%
|
70%
|
|
c) hard copy proof Hansard reports
(available in Parliament House by 8:30am the following sitting
day)
|
97%
|
100%
|
|
d) electronic official Hansard (15
nonsitting working days following the last sitting day in the
week)
|
100%
|
88%
|
|
e) hard copy of official Hansard
(delivered to publisher within 15 non-sitting working days
following the last sitting day in the week)
|
82%
|
75%
|
|
Percentage of transcripts delivered for
committees within the following standards (target: 95%).
Transcripts for priority committees (a) and b) below) are
negotiated with the Clerk Assistant, Committees:
|
|
a) within 24 hours
|
100%
|
92%
|
|
b) 1-3 days
|
94%
|
86%
|
|
c) 3-5 days
|
97%
|
91%
|
|
d) over 5 days
|
94%
|
100%
|
Indicator—Customer satisfaction
The preliminary results of the DPS
2009 Customer Satisfaction Survey indicated 83% of customers were
satisfied or very satisfied with Hansard services. This is less
than the 89%[26] result in the previous customer survey
conducted in 2006-07. We attribute this to Hansard's increased
workload and delays in meeting committee deadlines as reported on
page 84.
Hansard received five customer
complaints during 2008-09, in respect of 4,273 hours of transcribed
proceedings. These complaints related to problems experienced in
supporting committees sitting outside Canberra, the timeliness of
committee transcription, and concerns about Hansard's
responsiveness in correcting errors identified in the transcripts.
As issues arise and on an ongoing basis, Hansard continues to
review and streamline its processes to improve services to the
parliament.
Indicator—Accuracy of transcription
Hansard error rates are based on the
number of corrections to draft chamber speeches returned by
Senators and Members, or corrections to committee transcripts made
by witnesses, and accepted as Hansard errors. Error rates for both
chambers (2.7) and committees (0.7) improved in 2008-09 and were
well within the target of five errors per 100 pages.
Indicator—Timeliness of transcription
Chambers
The service delivery standards for
chamber transcripts are in five categories, as listed at Figure 37.
As the delivery of draft speeches gives Senators and Members their
first opportunity to review the Hansard transcript, delivery time
is critical. Hansard met its 95% target against this standard, and
achieved a slight improvement on the 94% achieved in 2007-08.
The service standard for publishing
electronic proof Hansard reports within three hours of the chamber
adjourning was met on 70% of occasions, down on the 2007-08 result
of 74% and below the 95% target. Delays were experienced for two
main reasons: technical difficulties in publishing, due often to
the lengthy and complex processing of answers to questions on
notice or in writing, and the additional supervision required to
check trainee editors' work. On average the electronic proofs were
published in 2 hours 51 minutes, which is within the service
delivery standard. The delivery standard for hard copy proof
Hansard reports delivered to Parliament House was met on 100% of
sitting days
Publishing the electronic Official
Hansard (Officials)—88% within the delivery
standard—and delivery of the hard copy Official Hansard to
the publisher—75% within the delivery standard—were
down in comparison with the 2007-08 results (100% and 88%
respectively) and also well below the 95% target. This was due to
the level of checking undertaken in completing the final version of
the Officials. Revised procedures streamlining this process have
been implemented for 2009-10 and should result in the publishing
targets being met for the coming year.
Committees
The service delivery standards for
committee transcripts are in four categories: within 24 hours
(priority), within 1-3 days (priority), within 3-5 days and over 5
days. Delivery times for priority hearings are negotiated with the
relevant Clerk Assistant, Committees.
The performance result is the
percentage of transcripts delivered within the agreed deadlines.
For the 24-hour category, 92% of transcripts were delivered on time
compared with 100% in 2007-08. For the 1-3 day category 86% of
transcripts were delivered on time compared with 94% in 2007-08. In
the 3-5 day category 91% of transcripts were delivered on time
compared with 97% in 2007-08. Committee transcripts with a delivery
standard of over 5 days were delivered on time on all occasions in
2008-09 compared with 94% in 2007-08.
In 2008-09 there was a significant
increase in the number of committee hours, with 2,804 hours
transcribed compared with 1,208 hours in 2007-08, and 2,438 hours
in 2005-06 (the previous post-election year). During the year
parliamentary committees also requested priority transcripts within
24 hours on 125 occasions. These shorter timeframes, coupled with
the overall increase in committee activity, allowed less
flexibility in managing Hansard workloads and resulted in an
increased number of transcripts being delivered outside the
requested timeframes.
The number of parliamentary
committees held outside Canberra increased to 340 in 2008-09
(compared with 115 in 2007-08 and 222 in 2005-06). This also
contributed to reduced timeliness of committee transcription, as
Hansard staff travelling to support away committees significantly
reduced transcription capacity.
Late in the year DPS commenced a
trial of single officer support for most committee hearings held
outside Canberra where previously two staff were the norm. As well
as reducing travel costs, this initiative will increase
transcription capacity as Hansard officers will travel less
frequently.
Figure
38—Sub-output 4.2—Hansard services—quantity
indicators
|
|
|
|
|
|
|
|
|
|
Transcription services
|
Number of hours transcribed, by
category:
|
|
a) chambers
|
929
|
1,473
|
|
b) committees (ACT hearings)
|
785
|
1,721
|
|
c) committees (interstate hearings)
|
423
|
1,083
|
|
Questions on Notice
|
Number of pages of answers to Questions on
Notice or Questions in Writing in proof Hansard
|
New indicator
|
1,116
|
Indicator—Transcription services
Chambers
The figures for transcription
services are the same as those reported for broadcasting activity
and show the number of hours transcribed in 2008-09 increased
significantly in comparison to the previous year. This in part
reflected the reduced hours during 2007-08 due to the federal
election, and also reflected the higher levels of chamber hours for
the first year of a new government. The figure of 1,473 chamber
hours for 2008-09 is 9% higher than the 1,354 chamber hours in
2005-06, the previous first year of a new Parliament.
Transcripts were provided to
occupants of Parliament House in hard copy, and were also available
electronically through ParlInfo, the parliamentary database.
Transcripts were provided to the general public through:
- the Australian Parliament House web site
(including a search option using ParlInfo Web);
- libraries and educational institutions,
through the Legal Deposit and Commonwealth Library Deposit and Free
Issue Schemes; and
- direct subscriptions.
Committees
There were 2,804 hours of committee
hearings transcribed in 2008-09. This is a 132% increase when
compared with the 1,208 hours in the 2007-08 year, and also a 15%
increase from the 2,438 hours in 2005-06 (the previous
post-election year). The 2008-09 committee workload was the highest
since 1995-96 (the first year of the Howard Government), and is
close to the 2,862 hours of committees transcribed that year.
Senate Estimates hearings again took place concurrently with House
of Representatives sittings. This presented significant workload
challenges for Hansard.
Senate committee hearings, including
Estimates hearings, made up 66% of the total committee workload,
down from 78% in 2007-08. House of Representatives committees made
up 20% (up from 10% in 2007-08) and joint committees 14% (up from
12% in 2007-08).
In 2008-09 DPS continued to use
external transcript providers to manage its peak workload. External
providers are engaged on occasions to record and transcribe
parliamentary committee hearings held interstate and to assist with
the transcription of committee hearings in the ACT, particularly
during the busy Senate Estimates hearings. Hansard could not meet
its delivery standards during peak periods without assistance from
external providers. This has become increasingly important in
managing workloads with the increase in committee activity,
particularly during sitting weeks. Without this mechanism Hansard
would need additional staff to cover peak workloads, resulting in
excess transcription capacity at other times.
Indicator—Questions on Notice
In 2008-09 1,116 pages of answers to
Questions on Notice or Questions in Writing were included in proof
Hansard. This figure is being reported for the first time for
2008-09.
Figure
39—Sub-output 4.2—Hansard services—price
indicators
|
|
|
|
|
|
|
|
|
|
Hansard services
|
Cost per hour transcribed, by
category:
|
|
a) chambers
|
$3,374
|
$2,134
(-37%)
|
|
b) committees (ACT hearings)
|
$2,942
|
$1,652
(-44%)
|
|
c) committees (interstate hearings)
|
$3,229
|
$1,961
(-39%)
|
|
Total cost of sub-output 4.2
|
$10.198m
|
$11.517m
(+13%)
|
As expected, the hourly cost for
chamber and committee transcription in 2008-09 reduced
significantly as the parliamentary activity increased in a
post-election year. Costs per hour have also fallen in comparison
to 2005-06 hourly rates (the previous post-election year) for
chamber transcription (from $3,175 per hour in 2005-06 to $2,134 in
2008-09), and remained fairly steady for committee hearings (down
from $1,716 per hour in 2005-06 to $1,652 in 2008-09 for ACT
hearings, and up from $1,931 per hour in 2005-06 to $1,961 in
2008-09 for interstate hearings). The higher levels of activity in
2008-09 mean that despite the total cost rising slightly across the
period (from $11.362m in 2005-06 to $11.517m in 2008-09) the unit
cost has decreased, reflecting the improved cost effectiveness of
Hansard transcription.
Introduction
DPS uses administered funds to plan,
develop and deliver into service:
- a building works program; and
- an artworks conservation and development
program.
These programs are to support the
operation of Parliament into the future, while at the same time
preserving the design integrity of the architecture, engineering
systems, art and landscape that make up Parliament House.
Part 5 includes information on the
Extent to which design integrity is preserved and the Design
Integrity Index.
Performance
Figure
40—Administered items—Building works—quality,
quantity and price indicators
|
|
|
|
|
|
|
|
|
|
Extent to which building projects meet
objectives
|
Client acknowledgement that a project has
delivered 90% of agreed business objectives (target: 100% of
projects)
|
90.5%
|
100%
|
|
|
|
|
Extent to which building projects are
completed on time
|
Projects are delivered to agreed
timetables (target: 100% of projects)
|
86%
|
75%
|
|
|
|
|
Extent to which building projects are
completed on budget
|
Projects are completed within approved
total budget (target: 100%)
|
100%
|
100%
|
|
Extent to which administered funds are
expended on building projects
|
Cost of building projects
|
$5,562,238
|
$8,421,938
|
Indicator—Extent to which building works projects meet
objectives
During 2008-09 eight projects were
completed with all projects meeting the agreed objectives. The
users for two of the projects indicated they were delivered above
their expectations.
Indicator—Extent to which building works projects are
completed on time
Of the eight projects completed six
were delivered within the agreed timeframe. The two late projects
were delayed by actions to ensure the contractors delivered the
stipulated quality.
The first project was delivered
three days late and the second one was 10 days late. The late
delivery did not impact on the operational areas.
Indicator—Extent to which building projects are completed
on budget
All projects were completed within
their allocated budget.
Indicator—Extent to which administered funds are expended
on building projects
Increased capacity and capability in
the Building and Security Projects team resulted in some $8.42m of
administered funding being spent on building projects. This was 54%
of the budgeted spend, a significant improvement compared to the
$5.56m, or 39%[27], achieved in 2007-08.
Figure
41—Administered items—Artworks—quality, quantity
and price indicators
|
|
|
|
|
|
|
|
|
|
Extent to which the art collection is
developed
|
Acquisition proposals approved by Art
Advisory Committee (target: 100%)
|
100%
|
100%
|
|
|
|
|
Extent to which the art collection is
developed[28]
|
Number of new artworks acquired
|
124
|
93
|
|
Extent to which the art collection is
conserved
|
Number of artworks receiving
preservation
|
17
|
18
|
|
Extent to which art projects are completed
on time
|
Projects are delivered to agreed
timetables (target: 100% of projects)
|
100%
|
100%
|
|
|
|
|
Extent to which administered funds are
expended on the art collection
|
Cost of artworks preservation
|
$60,629
|
$26,063
|
|
Cost of art collection development
|
$271,382
|
$411,130
|
In 2008-09, the focus for art
acquisitions continued to be on areas of the collection that are
under-represented, and on increasing the number of artworks
available for display in Senators' and Members' suites. All
acquisition proposals presented to the Art Advisory Committee (AAC)
during the year were approved.
Ninety three new artworks were
approved for purchase for the rotational
collection—addressing priority areas for acquisition
including works by artists based in Western Australia and
Queensland, indigenous artists and female artists, as well as
landscape works.
Two new portrait commissions for the
Historic Memorials Collection were approved, for portraits of
former Prime Minister the Hon John Howard, and former President of
the Senate, Senator the Hon Alan Ferguson. These commissions will
be finalised in the second half of 2009.
Four items were also accepted for
the Gifts Collection, presented by the Republic of Croatia, the
Kingdom of Saudi Arabia, and the National Sorry Day Committee.
All artworks collection development
projects were completed on time.
Indicator—Extent to which the art collection is
conserved
Eighteen artworks were subject to
conservation treatment in 2008-09. The most significant project
involved detailed condition assessment and cleaning of 11 paintings
from the Historic Memorials Collection, on long term loan to the
High Court of Australia. The 11 paintings are portraits of former
Justices of the High Court (primarily Chief Justices). As a
consequence of this process, two of the portraits were identified
as requiring more intensive treatment, including repairs to their
gilded frames and canvas.
All artworks conservation projects
were completed on time.
Indicator—Extent to which administered funds are expended
on the art collection
Costs attributed to art collection
development and preservation include the purchase price of
individual artworks, as well as payments for delivery, framing, art
consultancy services and contracted conservation services.
Electorate office support
The Presiding Officers and the
Special Minister of State signed an agreement on 14 May 2003 with
respect to DPS providing IT support to electorate offices on behalf
of the Department of Finance and Deregulation (Finance), which
meets agreed costs of this support. The original agreement covered
the period from 1 July 2003 until 30 June 2006. The 2003-06
agreement will remain in force until a replacement agreement is
negotiated.
Under this agreement:
- DPS (in consultation with Finance) develops
and maintains the Standard Operating Environment (SOE) which is
used in Parliament House and electorate offices, and for mobile
use; and
- DPS provides service desk and remote desktop
support services for fixed and mobile access.
Finance engages external contractors
to supply, maintain and support on-site hardware in electorate
offices, to maintain communication links to Parliament House from
electorate offices and to provide training services for electorate
office staff.
There were two management meetings
between Finance, DPS and the external contractor (CSG) responsible
for managing the services held during 2008-09. In these meetings,
DPS and Finance reviewed procedures and processes and determined
what improvements should be made to improve service delivery.
During 2008-09, DPS performed a
range of electorate office support activities including:
- support and maintenance of the SOE;
- various software upgrades, including the
introduction of Office 2007;
- a trial and subsequent rollout of BlackBerry
personal digital assistant (PDA) devices to replace the Mobile
Messaging Service (otherwise known as Windows Mobile devices);
and
- final work associated with Senate electorate
office moves resulting from the November 2007 federal
election.
The workload for 2008-09 of 23,582
calls—requests to the Client Support help
desk—represents a 10.2% decrease on the 26,253 calls received
in 2007-08.
The cost recovered by DPS from
Finance for providing core electorate office support services for
the 2008-09 financial year was $1.931 million (GST exclusive).
A joint working group, comprising
the parliamentary departments and Finance, was established in
2008-09 to determine the feasibility of transferring electorate
office IT responsibilities from Finance to DPS.