The Parliamentary Library aims to provide an effective knowledge centre for the
Parliament through the provision of information, analysis and advice. These services
are provided through two sub programs:
- Research Services: these services include responding to requests from
individual parliamentary clients for information and research, and the
production of print and electronic publications.
- Library Collections and Databases: Information services are provided to the
Library’s clients by acquiring and providing access to information resources,
through the selection, processing and indexing of material for library and media
databases in ParlInfo Search.
Staff from the Office of the Parliamentary Librarian contribute to the work of
both programs.
Performance is assessed using indicators that cover quality, quantity and price.
Indicators, performance results and relevant comments are shown against each of the
Library programs.
Progress in key projects identified in the Library’s Business Plan 2018–19 was the
subject of discussion in the previous section. The Performance Report focusses
on analysis of the Library’s achievement against service standards set out in that
same document.
Methodology
Key priorities and performance indicators for the Parliamentary Library are approved
each year by the Presiding Officers as part of the Library’s Annual Resource
Agreement (PS Act, section 38G). The KPIs in each Resource Agreement set out the
outcomes and key deliverables for that year and also measure the:
- percentage of clients using the Library’s services
- customer satisfaction
- number of completed client requests
- number of publications produced
- number of online uses of the Library’s publications
- attendance at training courses and events
- timeliness of research and library services
- number of items added to the Library’s Electronic Media Monitoring Service
(EMMS) and ParlInfo data bases
- number of new titles added to the catalogue
- percentage of the collection available online, and
- use of the Library’s collections and data-bases and the media portal.
The Library uses the RefTracker Information Request Management System to manage
client requests and other client related work. This provides a rich array of client
related data, including number of requests, usage, and timeliness. Satisfaction data
is derived primarily from a formal evaluation of the Library’s services conducted once
in every Parliament, the most recent being undertaken in 2017. Data regarding the
number of publications produced and the number of items added to the EMMS and
ParlInfo Search databases is obtained from the Australian Parliament House website
and ParlInfo Search. Data relating to visits to the Library client portal (intranet) are
captured by Sitecore’s engagement analytics. The Parliamentary Library currently uses
Google analytics and Splunk web-analytics application to analyse statistics for use of
publications and collection items. A manual count is used to report on attendance at
training courses and events and new titles added to the Library catalogue. Reports
generated from the ILS provide information regarding the percentage of titles in the
Library’s collection available online in full-text. Statistics on the use of the Library’s
collections and databases is formulated from ILS reports, Splunk data and vendor
provided usage statistics.
Research services
The services contributing to this program are as follows:
- commissioned information, research and advisory services—these are tailored
and confidential responses prepared following requests from individual
parliamentarians and their staff, and other parliamentary clients and
- general distribution publications (publications)—these are prepared where strong
client demand is anticipated for briefing on specific policy issues. Publications
include the Parliamentary Handbook, Briefing Book, Budget Review, Bills Digests,
Research Papers, Quick Guides and FlagPost blog posts. Publications are available
to clients and the public, through the Internet.
Client requests
During 2018–19, 100 per cent of the Library’s primary clients (parliamentarians’
offices, including ministers’ offices) used the client request service at least once, a
considerable achievement given the number of new senators and members taking
their seats during the financial year.
The ‘number of client requests’ target is a demand driven indicator, representing a best
estimate of how many requests the Library expects to complete annually. Complex,
multi-part requests are generally recorded as a single client job although they may
require significant and discrete input from researchers in different sections.
The Library answered 10,299 individual client requests in 2018–19, below its target of
13,000, and below the 11,600 or so requests completed in the previous two financial
years. The outcome reflects the nature of the 2018–19 parliamentary calendar (with
relatively few sitting days between late February and April) and the prorogation of the
45th Parliament and dissolution of the House of Representatives on 11 April. (The use
of research services is heaviest when Parliament is sitting.)
Table 21: Research services
| Deliverable |
Measure |
Performance |
|
|
2015–16 |
2016–17 |
2017–18 |
2018–19 |
| Individual client
requests |
Percentage of primary clients using the
service
Target: 100%
|
100% |
100% |
100% |
100% |
Number of individual client requests
completed
Target: 13,000
|
13,113 |
11,681 |
11,656 |
10,299 |
| Self-service
requests |
Number of online uses of
the Parliamentary Library’s
publications, including the
Parliamentary Handbook,
through ParlInfo and the
Internet
Target: 4m
|
6.74m |
6.4m |
7.2m |
7.9m |
| Publications |
Number of publications
produced
Target: 260
|
267 |
280 |
295 |
385 |
| Client training and seminars |
Attendance at training
courses and events
(e.g.
Vital Issues Seminars)
Target:
500
|
729 |
1,101 |
803 |
688 |
The following table illustrates the costs associated with providing research services.
Table 22: Research services—price indicators
| Deliverable |
Measure |
Performance |
| 2015–16 |
2016–17 |
2017–18 |
2018–19 |
| Cost of research
services |
Average cost per individual client
request
|
$527.22 |
$556.39 |
$562.03 |
$598.41 |
| Average direct cost per
self-service client request
(staff time only)
|
$0.11 |
$0.16 |
$0.12 |
$0.12 |
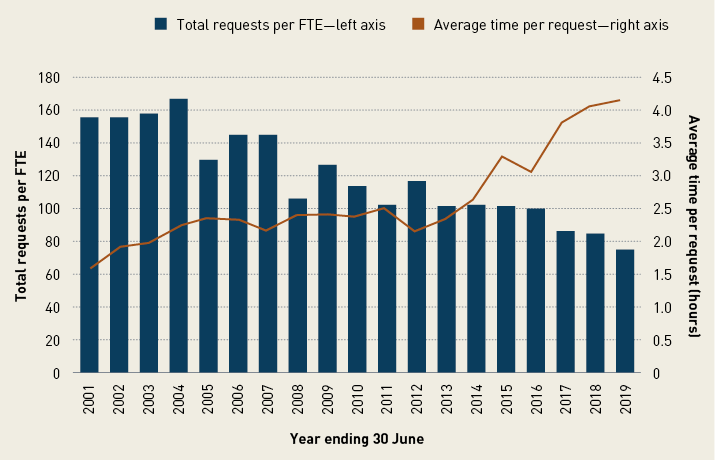
2018–19 saw the continuation of the trend towards fewer but increasingly complex
client requests. As illustrated in the graph below, Library data continues to show
an overall decline in the number of completed client requests of 60 per cent per
FTE between the financial years 2000–01 and 2018–19. However, while year-to-year
outcomes vary, over the same period there has been an overall increase in the average
amount of time spent per FTE on individual requests. The average amount of time per
FTE per request in 2018–19 was 4.2 hours, over two and half times the 2000–01 figure
of 1.5 hours.
Figure 17: Client requests—relative indicators
The Library will continue to monitor usage closely and consult with clients to ensure
services are appropriately targeted. In particular, a targeted program of client outreach
has been planned for the early weeks of the new Parliament.
Publications
In meeting the need to provide high quality information, analysis and advice to
parliamentarians, the Library produces information and advice for individual clients
on an ‘in confidence’ basis. It also produces publications for broader distribution in
areas where there is strong client interest and demand, or where such demand is
anticipated.
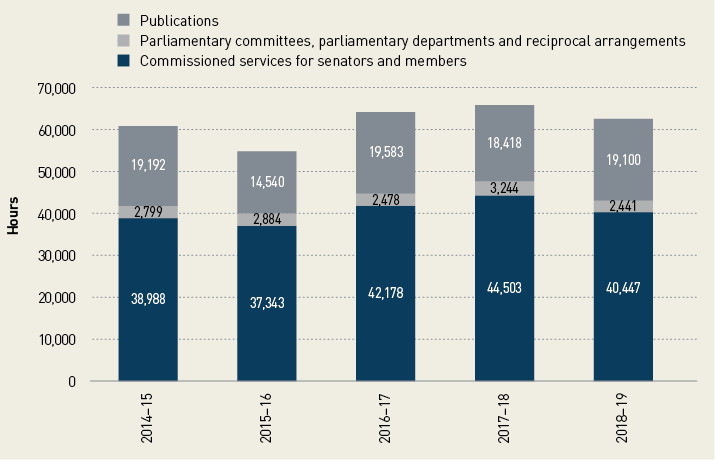
In 2018–19, the Library issued 385 new or revised research publications. Hours spent
on publications increased by 3.9 per cent to 19,100 (compared to 18,418 hours the
previous financial year).
The Library published 80 Bills Digests in 2018–19, as compared to 133 in 2017–18.
The low number reflects the reduced number of sitting weeks and the lapsing
of 29 bills on prorogation of the Parliament and dissolution of the House of
Representatives. Two digests were produced on private senators’ or members’ Bills.
Twenty six digests were not published in time for debate in the first chamber. Digests
were not produced for 40 Government Bills. Of these:
- two passed both Houses on the day of introduction
- four passed within one day of introduction, and
- four passed within a week of introduction.
Flagposts were published on 10 of these Bills.
In the context of prioritising research work, Bills Digests and client requests receive
the highest priority, with other publications worked on as time permits.
Figure 18: Distribution of client service hours by service type 2018–19
Client training and seminars
The Parliamentary Librarian participated in induction sessions organised by the
chamber departments for new senators and members. Library staff also served as
contact officers for all new senators and members.
During the year, Library induction and orientation services continued to be successful
in providing, through individual and small group sessions, a timely and detailed
introduction to Library services.
The Library supplements its regular one-on-one training with other training programs
including ‘drop in’ sessions in the Senators and Members Reading Room during sitting
weeks. In 2018–19, four sessions were offered on news services, new releases of
Census data, e-books, and the new ParlMap service.
One of the recommendations of the Client Service Evaluation 2015 was that the
Library focus more on providing orientation and training, and consider conducting
some of these in other capital cities to make it easier for electorate staff to attend.
The Library continued its program of electorate office visits, visiting 20 offices in
Victoria, New South Wales and the ACT, meeting its target for the financial year.
In 2018–19, the Library also continued its program of consultation and outreach to
parliamentary committees.
The Library continued to deliver a program of lectures and seminars bringing notable
speakers to the Parliament to give parliamentarians and their staff the opportunity to
hear, first hand, expert opinion on a range of currently relevant topics. In addition to the
Budget seminars, the Library hosted the following lectures and seminars for clients:
- National Reconciliation Week lecture: ’Grounded in truth: walk together in courage’,
Professor Tom Calma AO, Co-Chair Reconciliation Australia
- Forgotten founder—George Houstoun Reid, Dr David Headon
- The National Disability Insurance Scheme: is it meeting its objectives?,
Helen Dickinson, UNSW Canberra
- Rising Inequality? A stocktake of the evidence, Jonathan Coppel, Productivity
Commission
- Section 44—Office of profit under the Crown, Professor Anne Twomey,
University of Sydney
- Developments on the Korean Peninsula, Dr Euan Graham, Senior Fellow, Lowy Institute
- Cybersecurity and electoral integrity, Tom Uren, Australian Strategic Policy Institute
- Tech briefing: New Genetic Technologies, Dr TJ Higgins, Australian Academy of Science
- Tech briefing: Blockchain technologies, Rob Hanson, ANU and Data61.
Most lectures are available for download from the Australian Parliament
House website.
Client satisfaction with requests and
publications
Table 23: Research services—key performance indicators
| Deliverable |
Measure |
Performance |
| 2015–16
|
2016–17
|
2017–18
|
2018–19
|
| Client satisfaction with
requests and publications |
High level of customer
satisfaction
Target: 95%
|
93% |
93% |
94% |
94% |
Client service delivered to timeliness service
standard
Target: 90%
|
90.4% |
97.9% |
99.33% |
99.71% |
| Number of complaints from clients remains low
|
2 |
1 |
2 |
0 |
The 2017 client service evaluation found the general response to the Library was very
positive. Satisfaction among senators, members, and their staff is high at 94 per cent
(though slightly below the target of 95 per cent), with 97 per cent of senators and
members indicating they would recommend the Library’s services to a colleague.
Pleasingly, since the last evaluation in 2015, the percentage who were extremely
satisfied increased by five per cent (to 50 per cent), and the number dissatisfied
decreased to only one per cent (compared to five per cent in 2015).
Most respondents considered Library staff to be hard-working, professional
and friendly and the services to be of a high quality. Clients valued the Library’s
independence and its capacity to provide analysis; and regarded the Library very
highly as a source of trusted information. It was found to perform strongly on issues
of balance, impartiality and confidentiality. There was also a significant and welcome
increase in the number of respondents who thought the Library’s performance had
improved. Reasons given for this included the time taken to understand individual
requests, innovation, promotion of Library services, and building of relationships.
This is consistent with spontaneous feedback received from clients throughout the
reporting period.
The Library received no complaints in 2018–19.
Library Collections and Databases
The services contributing to this program include:
- the Library collection—development of the collection to meet users’ needs and
provision of access through the catalogue and ParlInfo Search
- online full-text content such as news clippings
- media services—desktop access to television and radio news and current affairs
programs broadcast in Canberra, provided to senators and members for their
parliamentary duties
- commercial databases—including online full-text journal and newspaper services
available through the Library Client Services’ portal and the Senators’ and
Members’ Services Portal, and
- client services including the Central Enquiry Point and self-help services.
As far as possible, usage rates of all of these services are monitored to ensure that they
remain relevant and are of practical assistance to senators, members, and their staff.
Table 24: Information access services—deliverables
| Deliverable |
Measure |
Performance |
| 2015–16 |
2016–17 |
2017–18 |
2018–19 |
| Material added to Library databases |
Number of items added to the
Library’s Electronic Media Monitoring Service and to ParlInfo
databases
Target: 150,000
|
177,644 |
168,788 |
175,249 |
189,766 |
| Material added to Library
collection |
Number of new titles (books and
serials) added to the Library’s catalogue
Target:
5,000
|
7,318 |
6,575 |
6,378 |
5,756 |
Percentage of titles (books and serials) in Library’s
collection available to clients online in
full-text
Target:
46%
|
41.2% |
42.2% |
45.5% |
46.2% |
| Use of the Library collection and databases
|
Use of the collections and databases,
including loans from the collection, radio and television
programs from the Electronic Media Monitoring Service, and from
ParlInfo databases
Target: 4 million
searches
|
4.44m |
3.81m |
3.95m |
4.34m |
Table 25: Information access services—price indicators
| Deliverable |
Measure |
Performance |
| 2015–16 |
2016–17 |
2017–18 |
2018–19 |
| Cost of information
services |
Average cost per item added to the
Library’s collection
|
$155.81 |
$152.91 |
$162.93 |
$137.54 |
| Average cost per item added to the Library’s
databases
|
$17.47 |
$17.85 |
$14.62 |
$16.34 |
| Average cost per use of the Library’s databases and collection
|
$1.57 |
$1.85 |
$1.59 |
$1.56 |
Material added to Library databases
In 2018–19, the Library selected and indexed approximately 10,071 newspaper
clippings a month, up from an average of 9,231 a month in 2017–18. Of all the Library
databases that are indexed for ParlInfo Search, the newspaper clippings accounted for
94 per cent of the indexed content.
Since the introduction of the automated Library Authoring System and Thesaurus (LAST)
in 2010, the Library has been able to publish the latest newspaper clippings in ParlInfo
Search, as well as produce the senators’ and members’ news clips of the day by
7:30am. Data shows that the introduction of LAST significantly improved the Library’s
productivity in the selection and indexing of newspaper clippings.
Material added to the Library collection
The number of new titles (books and serials) added to the Library’s catalogue exceeded
the 5,000 target at 5,756.
The percentage of titles available online (full-text) increased from 45.5 per cent to
46.2 per cent, meeting the year’s target.
Use of the Library’s collection and
databases
The target figure of four million uses of the Library’s collection and databases was
exceeded with 4.34 million uses being reported. This is the first year the KPI has
been met since 2015–16. The increase in 2018–19 reflects the expansion of digital
newspapers and clients accessing these through the Library.
Figure 19: Use of the print collection
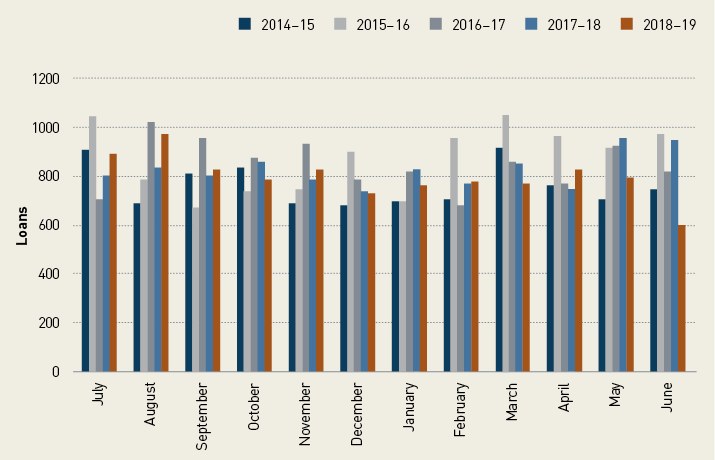
Use of the print collection remained stable with a total of 9,557 loans during 2018–19
(compared to 9,913 in 2017–18). The 2017 client evaluation of Library services found
that use of the Library’s print collection has fallen slightly from 85 per cent in 2015 to
75 per cent in 2017 (after increasing significantly from 61 per cent in 2012).
Though still quite low when compared to usage of the print collection, ebook usage
increased slightly during 2018–19, with 1,244 loans being processed (compared to
1,100 the previous financial year). Overall, the proportion of print versus electronic
loans during 2018–19 was 88.5 per cent print and 11.5 per cent electronic. In 2017–18
it was 90 per cent print and 10 per cent electronic. This increase may be attributable
to the Library’s increased promotion of the ebook services and the promotion of
the EZproxy system which provides a more seamless (single sign-on) access to our
subscribed ebook collections outside the PCN.
Table 26: Subprogram 2—collections and databases—key performance indicators
| Deliverable |
Measure |
Performance |
| 2015–16 |
2016–17 |
2017–18 |
2018–19 |
| Client satisfaction with
collections and database services |
High level of customer
satisfaction
Target: 95%
|
93% |
93% |
94% |
94% |
Number of urgent new titles (books and serials) added to
the Library’s catalogue within timeliness service
standard
Target: 100%
|
100% |
100% |
100% |
100% |
Senators’ and members’ offices using the iSentia
Mediaportal
Target: 90%
|
89% |
96% |
99% |
99% |
Senators’ and members’ offices using social media
monitoring service
(new KPI
2016–17)
Target:
45%
|
- |
56% |
66% |
70% |
New items added to the Library’s Electronic Media
Monitoring Service and the ParlInfo newspaper clippings database
within timeliness service standard
Target:
95%
|
94.7% |
94.4% |
99.07% |
95.8% |
| Number of complaints from clients remains low
|
0 |
1 |
0 |
0 |
Client satisfaction with Library Collection and Databases
See the discussion on client satisfaction indicators.
Cataloguing
The key performance indicator for ‘urgent new titles (books and serials) added to the
Library’s catalogue within timeliness service standard’ measures timeliness in relation
to cataloguing items obtained as a result of direct client requests (with a turnaround
deadline of 24 hours). These items are classed as urgent and are catalogued as a
priority by Library staff.
The cataloguing team met both its timeliness target for direct client requests and
exceeded the target (5,000) for the number of new titles (books and serials) added to
the Library’s catalogue by processing 5,756 titles. The team also exceeded its target of
85 per cent for adding routine items (those selected by the Library’s Acquisitions staff)
to the catalogue within the two week service standard, with 100 per cent of material
being added within this time-frame.
Expansion of news services
The Parliamentary Library provides a comprehensive news service to clients.
The Library is proactive in its endeavours to enhance its news services within its
available budget. Several services that were procured in 2017–18 were successfully
implemented in July 2018, these included: the Front Pages service that conveniently
bundles all daily front pages of national and metropolitan newspapers; access to
Analytics, another service available through the iSentia MediaPortal that provides
quantitative analysis tools for measuring media coverage and; IP access to The West
Australian. These services performed well over the past 12-months and have seen
good usage by clients. During 2018–19 the news services were further expanded to
include online access to The Canberra Times.
The Library has had a strong focus on broadening the scope of news services for
the Parliament and making them more convenient to access. The costs for online
news services for the Parliament are funded as business as usual through the
Information Resources allocation. In 2018–19, the Library spent $0.746 million on all
its news services. This includes online news services, news databases and hardcopy
newspapers located in the Newspaper Reading Room.
iSentia MediaPortal
Senators and members are able to access a wide variety of metropolitan and regional
press and broadcast news media through the iSentia MediaPortal, including news from
over 300 regional radio and television stations. Clients are able to set up alerts to push
news stories directly to their inbox and to have easy access to the news services even
when they are not on the parliamentary network.
Use of this service has grown significantly since it was introduced in 2013–14. As of
30 June 2019, 99 per cent of clients have a logon to this service, well above the target
of 90 per cent. These users have received over 1,440 email alerts per month.
Social media monitoring
iSentia retired its BuzzNumbers product in December 2018. The service was
conveniently rolled into the iSentia MediaPortal allowing consolidated access through
a single interface. The MediaPortal now provides access to social media commentary
from assorted blogs, Twitter and Facebook. Users can ask iSentia to set-up searches
to monitor particular areas of interest and receive alerts. During the year 70 per cent
of senators and members offices made use of the Library’s social media monitoring
services (target 45 per cent).
Performance
The news services’ KPI in table 26 above combines the performance outcomes of
the daily press clips service and Electronic Media Monitoring Service against their
individual performance benchmarks or standards. Performance against this KPI
was excellent, with both teams overall achieving 95.8 per cent against a target of
95 per cent.
Footnotes:
As measured in Uncommon Knowledge, Australian Parliamentary Library: client service
evaluation 2015.
Ibid.
As measured in Uncommon Knowledge, Australian Parliamentary Library: client service
evaluation 2017.
Ibid.
As measured in Uncommon Knowledge, Australian Parliamentary Library: client service
evaluation 2015.
Ibid.
As measured in Uncommon Knowledge, Australian Parliamentary Library: client service
evaluation 2017.
Ibid.