Introductory statement
I, Rob Stefanic, as the accountable authority of the Department of Parliamentary Services, present the 2018–19 annual performance statements of the Department of Parliamentary Services, as required under paragraph 39(1)(a) of the Public Governance, Performance and Accountability Act 2013 (PGPA Act). In my opinion, these annual performance statements accurately reflect the performance of the entity, and comply with section 39(2) of the PGPA Act.
Purpose
DPS supports the functions of the Australian Parliament and the work of the parliamentarians through the provision of professional services, advice and facilities, the ongoing maintenance of Australian Parliament House; and makes the building, and the important activity that takes place within it, accessible.
Analysis of performance against purpose
DPS has four strategic themes that provide the planning and performance framework against which DPS operates.
Enhance the Parliament’s engagement with the community
Part of our purpose is to increase community engagement to showcase Australian democracy, and share the work, stories and collections within Parliament House. DPS achieves this through developing and implementing new visitor experiences including events, festivals, tours and digital/online programs. In 2018–19, we achieved six of our seven community engagement measures. This is a result of 86 per cent. A small increase in growth of visitation numbers is likely attributed to the increase in programs we are offering and our involvement in joint initiatives with cultural institutions such as the Culture Loop bus.
Respond to the changing needs of the Parliament
In 2018–19, a focus for DPS was to work in collaboration with the parliamentary departments to support the Parliament and parliamentarians through innovative, unified and client-focused services. This was particularly important during the 2019 federal election cycle. From the time of prorogation of the 45th Parliament, until new senators took their seats, DPS mobilised to assist with the exit and entry of parliamentarians. This work included restoration of suites (including deep clean, painting and furniture replacement), reclamation and reissue of artworks and IT equipment, transfer of data, the cancellation and issue of hundreds of security passes and induction tours. Business as usual services such as catering and events continued. DPS is pleased to have achieved nine of 11 performance measures, which is a result of 81 per cent.
Effective stewardship of Australian Parliament House
DPS operates in a complex environment with a range of significant challenges. Optimising our service capability, working collaboratively and ensuring design intent is at the heart of every decision is essential to safeguard the life of our iconic building. As outlined in the analysis for each performance criterion, a range of different factors contributed to only three of eight performance measures being achieved most notably, a more effective measure of engineering condition. In each area, work is underway to improve results against these criteria in 2019–20. For example, improvements in the engineering systems condition rating will be realised over the next five years, as packages of capital works are delivered within each system category. We also anticipate Security Key Performance Indicator (KPI) results will improve as we embed our in-house Parliamentary Security Service training package and strengthen our protective security culture. In 2018–19, DPS launched the Management of Design Integrity Framework. The framework outlines how we will manage projects for change, maintenance and repair activity, and is a major contributing factor in assuring effective stewardship of Parliament House for the future.
Effective delivery of the Australian Parliament House works program
DPS follows an annual cycle of programming capital works to address key infrastructure risks and accommodate the evolving requirements of building occupants. DPS building services are delivered around the parliamentary sitting calendar and the needs of a wide range of stakeholders. The 2019 federal election cycle provided further opportunity to undertake widespread interior building maintenance in short time frames. In 2018–19, DPS focused on being flexible while continuing to aim to achieve the required outcomes. As a result, good progress was made on capital works despite delays experienced with the entrance upgrades, which were beyond DPS’ control. All four performance measures were achieved. This result of 100 per cent is an improvement on the 2017–18 result of 75 per cent. The significant work undertaken in the past 12 months and planned works over the coming years will ensure Parliament House remains a building of significance into the future.
While there have been a number of positive achievements in 2018–19, further work is required to strengthen our accountability and to improve the quality of service we provide. In 2019–20, DPS will focus on the appropriateness of our performance measures as an assessment of our goals and outcomes. We will achieve this by reviewing and improving the processes behind the performance criteria and by looking for ways to develop performance stories that include qualitative measurements.
Performance criterion 1— Visitor Experience
Table 4: Performance criterion 1—Visitor Experience
| Enhance the Parliament’s engagement with the community
|
| Performance Measure |
|
Target |
Result |
| 1. Number of visitors |
Number of participants equivalent or greater to the same period last year |
Achieved |
| 2. Number of virtual visitors |
Achieved |
| 3. Number of visitors for DPS school tours |
Achieved |
| 4. Number of participants to DPS organised tours and events |
Not Achieved |
| 5. % of visitor feedback indicating their visit met or exceeded expectations |
85% satisfaction rating achieved |
Achieved |
| 6. % of school visitor feedback indicating their visit met or exceeded expectations |
Achieved |
| 7. % of participants attending DPS tours and events indicating their visit met or exceeded expectations |
Achieved |
Criterion Source: Program 1, 2018–19 Portfolio Budget Statement, p11
Methodology
Measure 1:
- Total magnetometer count, less passholders swipes, at the Parliament House Main Front Entry.
Measure 2:
- The number of users on the Parliament House website provided by Google Analytics.
Measure 3:
- A manual count of all students, teachers and accompanying adults to DPS school tours.
Measure 4:
- A manual count of all attendees to DPS organised tours and events.
Measure 5-7:
- The percentage of visitor feedback indicating the visit met or exceeded expectations measured on a scale of one to five, with scores of three or higher counting as ‘satisfied’.
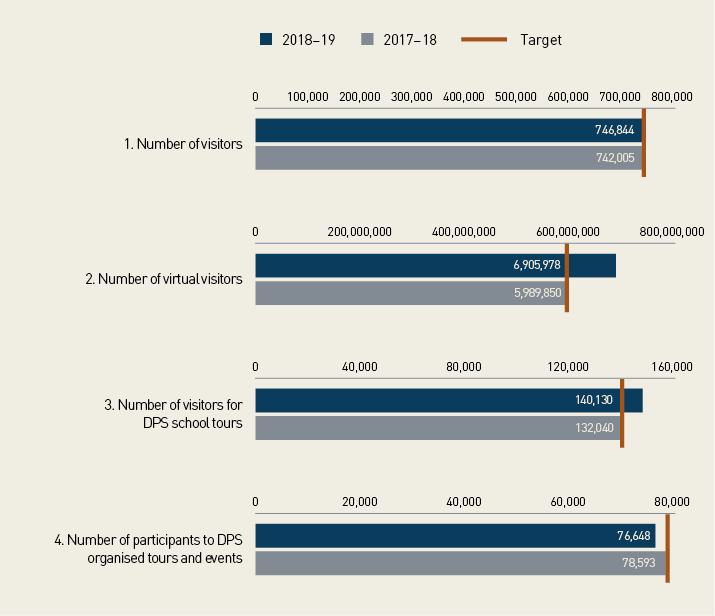
Figure 3: Visitor numbers
Analysis
DPS exceeded the visitor numbers target this year, welcoming a total of 746,844
visitors to our iconic building—on average over 2,000 visitors per day. As the custodian
of Parliament House, the iconic symbol of Australian democracy, DPS strives to
make Parliament House a highly rated destination for our citizens and international
visitors alike. Visitation to Parliament House is affected by two main external factors—
parliamentary activities and events in Canberra generally. The 2.5 per cent shortfall in
the number of participants to DPS organised tours and events can be attributed to the
federal election cycle, which saw a reduction in visitor numbers for an 11 week period
from 18 April to 30 June 2019. Without the parliament sitting, many of the private
tours that would normally be booked by parliamentarians’ offices on behalf of their
constituents and other private groups of citizens wishing to see parliament in action
did not occur.
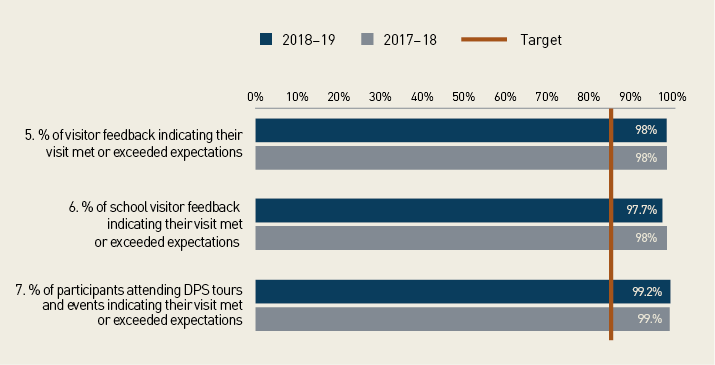
DPS continues to receive positive visitor feedback, both directly to staff and through
visitor feedback cards, demonstrating the quality of our programs and customer
service. This is supported by Parliament House ranking ninth out of the ‘254 things to
do in Canberra’ as of 1 July 2019. This ranking, by TripAdvisor, is based on the quantity
and quality of visitor reviews. During 2018–19, Parliament House received the 2018
TripAdvisor Travellers’ Choice and Certificate of Excellence awards. These results
affirm the commitment of our visitor services staff to deliver a standard of service that
enhances visitor experience and encourages others to visit.
Table 5: Highlights
| Parliament House Open Day
|
Christmas comes to Parliament House
|
Centenary of the Armistice
|
- Celebrating the 30th Anniversary of Australian Parliament House.
- Over 8,600 people attended.
- Showcased many private areas of the building to the public, including the Presiding Officers’ and Prime Minister’s courtyards.
|
- Free public performances of Christmas carols performed by 10 school choirs and the Canberra Choral Society.
- Giving tree in the Marble Foyer.
- Funds were raised for the charities Drought Angels and the Australian Indigenous Education Foundation.
|
- A significant exhibition of poppies was displayed on the forecourt as part of the 5,000 Poppies Project, creating a visual link with the Australian War Memorial.
- A dedicated program of events for children and young people saw more than 900 kids enjoy dedicated film screenings and school holiday workshops.
|
Figure 4: Visitor satisfaction
Visitor Service officers actively engage visitors with the work, stories and collections of Parliament House through the tour programs, including educational school tours available to all primary and secondary Australian schools.
‘This is a fantastic program that the children are able to experience. It is fantastic to put all of their prior knowledge and learning into practice. The children were very interested and engaged.’
‘Very enjoyable and will give me an insight into my Civics and Citizenship project at school, amazing to visit places which our country’s leaders visit on a regular basis.’
Welcome Tours are offered five times a day to introduce visitors to the most significant features of Parliament House. The tours include a visit to the chambers of parliament on non-sitting days and viewing of the extensive Parliament House Art Collection on show, including in the Great Hall, the Marble Foyer and the Members Hall.
‘Guided tour with Kylie was amazing. Everybody went above and beyond to ensure I didn’t miss anything. The staff were so thoughtful—an absolute asset.’
‘Very good tour by Rebecca and it was a good experience to uncover the history and stories behind this magnificent building.’
Behind the Scenes Tours are offered three times a day to give visitors an exclusive chance to visit some of the private spaces of Parliament House. Visitors have the opportunity to hear of the events that have shaped Australia and Parliament House. Visitors Services continue to conduct tours year round for Ministers, parliamentarians and international delegations from around the world.
‘It was a brilliant showcase of Australian democracy.’
A focus for DPS for 2018–19 was to discover and create new ways for our visitors to experience Parliament House. The seasonal Spring Courtyard Tours were held in September and October 2018, focused on the hidden courtyards and landscapes of Parliament House. These tours highlighted the courtyards on the Senate and House of Representatives sides of the building. They also featured the springtime foliage of the large and small trees, including the amazing Mount Fuji flowering cherry trees. Proving popular with locals, many returned from previous years to rediscover the beauty of these spaces.
The tour guide Stephen was excellent, very interesting anecdotal history and his very pleasant manner made the Garden Tour great.’
Spring Courtyard Tour—Marie was an excellent guide. The experience was wonderful. Please keep the tours going.’
The new Indigenous Experiences of Parliament House Tour was presented for the first time in 2019. This tour was created in consultation with local Indigenous communities. The tour explores and highlights the very important connections relating to Indigenous experiences and Indigenous peoples within the Australian democratic process.
‘A fantastic rich coverage of Aboriginal connections to this land and Parliament.’
During the DesignCanberra Festival, Parliament House hosted the popular Geometry of Democracy Tours, offering a rare opportunity to explore behind the scenes the geometric, architectural and landscape design of the precinct. Over six days, Parliament House was a key destination for this event.
Orientation Tours for building occupants were also conducted throughout 2018–19. Tailored tours are conducted in both sitting and non-sitting weeks to allow all building occupants to learn about Parliament House and the myriad of places and spaces that are important to working in this iconic building.
Performance criterion 2—Catering and Events
Table 6: Performance criterion 2—Catering and Events
| Respond to the changing needs of the Parliament
|
| Performance Measure
|
Target
|
Result
|
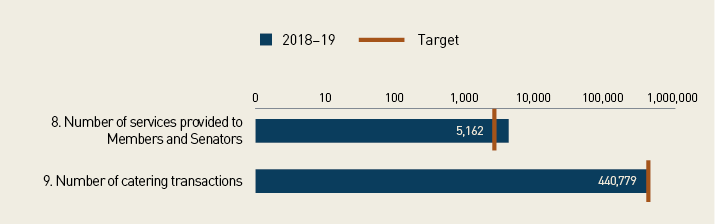
| 8. Number of services provided to members and senators |
3,524 |
Achieved |
| 9. Number of catering transactions |
415,514 |
Achieved |
Criterion source: Program 1, 2018–19 Portfolio Budget Statement, p11; Program 1, 2018–19 Corporate Plan, p29
Figure 5: Number of services provided
Methodology
Measure 8:
- To track services provided to parliamentarians, Australian Parliament House Catering and Events counts:
- Each DPS supported event held by a parliamentarian
- Each room service order
- Every catered meeting held by a parliamentarian, and
- Every transaction for parliamentarians and their guests in the Members and Guests Dining Room.
Measure 9:
- Australian Parliament House Catering and Events tracks all transactions from food and beverage outlets, excluding non-food and beverage items.
Analysis
This was the first full reporting cycle since DPS consolidated catering in-house in December 2017. DPS achieved the performance targets despite the 2019 federal election cycle, which had the result of fewer people working in and visiting the building. The recorded number of catering services averages at 1,211 transactions per day, including weekends and public holidays. Tracking service satisfaction is supplemented by the feedback obtained through the Annual Building Occupant Satisfaction Survey, which recorded a satisfaction rating of 93.4 per cent for Food and Beverage/Catering services for 2018–19. This is a further increase of 2.2 per cent compared to 2017–18 and a total increase of 5.1 per cent compared to 2016–17.
In line with the transition to in-house catering, DPS has implemented a ‘Service First Culture’. This means DPS actively seeks and manages feedback for continuous improvement and to flexibly adjust our service delivery. In 2018–19, DPS received 496 instances of feedback for our retail venues and events, of which 91 per cent was positive. DPS business practices and menu items are frequently reviewed to ensure quality and cost effectiveness is achieved in line with the guiding principles: to deliver quality and value; to provide a choice of dining options; to support parliamentarians’ use of event space for parliamentary duties; to position Parliament House as a destination of choice; and to offer competitive event management services.
Table 7: Highlights
| Kitchen refurbishment project
|
Enlighten festival
|
High tea
|
- Commenced refresh of kitchen infrastructure and service areas across all outlets—completion due 2020.
- Full Hazard Analysis and Critical Control Points certification—meet industry best practice principles for food safety.
|
- A degustation event in the Members and Guests Dining Room was open to the public and sold out.
- An event to coincide with the conclusion of Enlighten provided ‘light’ catering options on the lawns of Australian Parliament House.
|
- High tea sittings held in the Queens Terrace Café Friday to Sunday 12:00–4:00pm were popular with local and interstate visitors.
- High tea events in the main courtyard, held in conjunction with Floriade, attracted many visitors.
|
Innovation
Positive changes were made across many aspects of the catering operation to improve business practices and minimise wastage. DPS is proud of the proactive steps taken to minimise environmental impact through use of surplus food supplies. DPS redirected 1,146 kilograms of good food to OzHarvest who collect and provide it directly to charities, which equates to 3,438 meals for people in need. DPS established business with Yume Food Australia—a company which provides a brokering service for surplus food stock from primary producers and distributors at significantly reduced wholesale prices. DPS has also introduced various initiatives to reduce the use of single-use plastics, such as supplying filtered water rather than bottled water for visiting school children, and replacing plastic straws and takeaway packaging with biodegradable or recyclable alternatives.
Table 8: Performance criterion 3—Hansard Service
| Respond to the changing needs of the Parliament
|
| Performance Measure
|
Target
|
Result
|
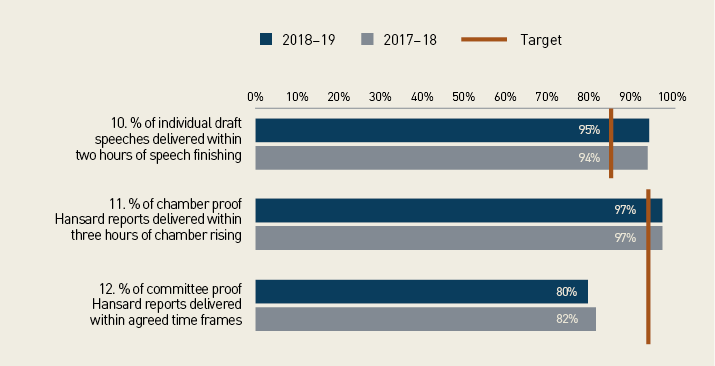
| 10. % of individual draft speeches delivered within two
hours of speech finishing |
85% |
Achieved |
| 11. % of chamber proof Hansard reports delivered within
three hours of chamber rising |
95% |
Achieved |
| 12. % of committee proof Hansard reports delivered within
agreed time frames |
95% |
Not Achieved |
| 13. External error rate per 100 pages for chamber proof
Hansard reports |
5 errors per 100 pages |
Achieved |
| 14. External error rate per 100 pages for committee proof
Hansard reports |
5 errors per 100 pages |
Not Achieved |
| 15. Availability of operated sound reinforcement in the
chambers and committees |
99% |
Achieved |
Criterion Source: Program 1, 2018–19 Portfolio Budget Statement, p11; Program 1, 2018–19
Corporate Plan, p29
Figure 6: Hansard timeliness
Methodology
The DPS Hansard Service records and reports on delivery of Hansard documents compared to the set time frame and the associated error rates.
Measure 10:
- An individual draft speech is recorded as delivered on time if the entire speech reaches the office of the parliamentarian within two hours of the speech.
Measure 11:
- Hansard proofs are recorded as being on time if published in full within three hours of the chamber rising.
Measure 12:
- Committee proof transcripts are recorded as being on time if published in the time frame agreed with the committee.
Measure 13:
- Error rates for chamber Hansard proofs are recorded in the Hansard Production System at the time when they are made official (15 non-sitting working days after the sitting day). The error rate for a given month for proofs is based on the number of errors per page for chamber sittings held in that month.
Measure 14:
- Committee proof transcripts are made official when corrections are provided by the committee or the committee requests that the transcript be made official without corrections. Error rates for committee transcripts are manually recorded in the month the corrections or request to make a transcript official are received by Hansard. There is no deadline for requesting corrections to committee transcripts and they can be received some months after hearing dates. Therefore, the committee error rate records the number of errors per page for transcripts in the month that the committee requests corrections or requests to make the transcripts official. The committee error rate is not the error rate for committees that sat in a given month.
Measure 15:
- This measure represents the availability of sound and recording of chamber and committee proceedings. This is the first year for data collection and measures the instances where service delivery was impacted.
Analysis
DPS achieved two of the three 2018–19 timeliness targets for Hansard Service KPIs: individual draft speeches and proof chamber transcripts. The annual target for the delivery of committee transcripts was not met. This result was driven by increased committee activity towards the end of the 45th Parliament and a consequent levelling of workloads across sitting and non-sitting periods. To address this, Parliamentary Recording and Reporting Branch adjusted its resourcing and consulted the parliamentary departments’ committee offices on expected delays in committee transcription to ensure priority transcripts were delivered on time. The branch has since undertaken workforce planning to better align its workforce and workload. The new staffing arrangements provide additional resources in non-sitting weeks to facilitate improved service to committees, while allowing an increased operational focus on chamber work during sitting weeks.
The Hansard Service reports on errors in transcription notified by its customers as a guide to trends in the accuracy of its transcripts. In 2018–19, DPS recorded 1.48 errors per 100 pages for chamber proof Hansard reports and 14.4 errors per 100 pages for committee proof Hansard reports. Errors are notified by parliamentarians’ offices for chamber transcripts and by committee secretariats for committee hearings. Throughout 2017–18 and 2018–19, as resources and delivery time frames permitted, the Hansard Service introduced a number of additional quality assurance processes that aimed to improve the accuracy of transcripts. As the quality assurance measures for committees primarily related to staff feedback and to learning and development needs, there is expected to be a lag in the positive impact of these quality assurance measures on error rates.
Of the 3,045 hours of proceedings recorded in 2018–19, the target of 99 per cent availability of operated sound reinforcement (sound and recording) in the chambers and committees was achieved.
Performance criterion 4—Building Occupant Satisfaction with timeliness and quality of DPS services
Table 9: Performance criterion 4—Building occupant feedback
| Respond to the changing needs of the Parliament
|
| Performance Measure
|
Target
|
Result
|
| 16. % of building occupant feedback indicating a satisfied
or neutral rating with timeliness and quality of DPS
services (by DPS service category) |
80% |
Achieved |
Criterion source: Program 1, 2018–19 Portfolio Budget Statement, p11; Program 1, 2018–19
Corporate Plan, p27
Methodology
Measure 16:
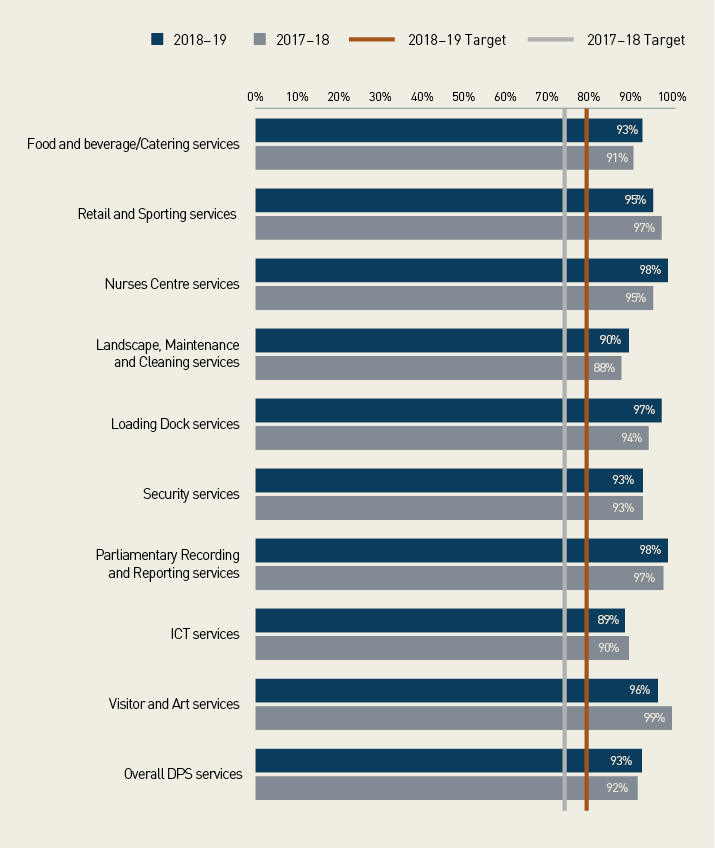
- The 2019 Building Occupant Satisfaction Survey was conducted over four weeks from 21 March to 19 April 2019. This period included a non-sitting week and the last two sitting weeks of the autumn session of Parliament. The online survey tool, SurveyMonkey, was used to host the survey and it was distributed to approximately 6,300 email addresses. Respondents were asked to rate their satisfaction across a number of service categories, as detailed in Figure 7, and provide supporting commentary if desired.
New questions in retail and sport services were included in this year’s survey to help provide insight into retail traffic in Parliament House, and additional questions focused on catering were included under Food & Beverage/Catering services.
Analysis
This year’s survey yielded positive results exceeding all service satisfaction targets and achieving an overall improvement from 2017–18, with a result of 93 per cent. Our aim is to provide the highest quality client experience through the provision of excellent services. DPS seeks the views of all clients using the parliamentary computing network, to assist us to identify opportunities for improvement, and recognises achievements. This includes free form qualitative response opportunities as well as statistical ratings.
The results of the survey, including both satisfaction ratings and individual comments, are provided to the responsible area for anaylsis and improvement. DPS continues to supplement this information with other sources of feedback, such as the Parliament House Art Collection and Catering and Events feedback cards.
DPS is committed to delivering services for building occupants in a timely and professional manner. This year the target was raised from 75 per cent to 80 per cent. As identified in Figure 7, all service categories achieved a satisfaction rating well above this new target.
Figure 7: Building occupant satisfaction survey results by service category (satisfied or
neutral rating)
Performance criterion 5—Parliamentary Library Services
Table 10: Performance criterion 5—Parliamentary Library Services
| Respond to the changing needs of the Parliament
|
| Performance Measure
|
Target
|
Result
|
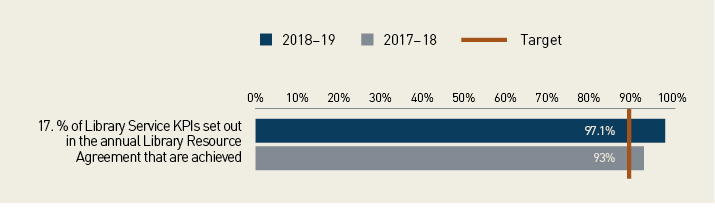
| 17. % of Library Service KPIs set out in the annual Library
Resource Agreement that are achieved |
90% |
Achieved |
Criterion source: Program 1, 2018–19 Portfolio Budget Statement, p11, Program 11; 2018–19 Corporate Plan, p27
Methodology
Measure 17:
- Key priorities and performance indicators for the Parliamentary Library are approved each year by the Presiding Officers as part of the Library’s Annual Resource Agreement (Parliamentary Service Act 1999, section 38G). Library performance data is derived from a range of administrative and analytical systems. Satisfaction data is derived from a client evaluation of the Library’s services.
Figure 8: % of Library Service KPIs set out in the annual Library Resource Agreement
Analysis
In 2018–19 the Library met 97.1 per cent of its key deliverables and targets. Significant
initiatives in the reporting period included: the completion of a multi-year project
to digitise the Parliamentary Papers Series 1901—2012; procurement of key library
systems (with the new search and discovery platform to be implemented, and
the integrated library service and digital repository to be upgraded in 2019—20);
preparations for the 46th Parliament, including production of the Briefing Book;
enhanced support for Parliament’s consideration of the Budget; completion of a
strategic workforce plan; implementation of a new branch structure in the Library
Collections and Databases Branch; the establishment of the cyber working group in
the Research Branch; deployment of the Wadsworth database; the conference and
general meeting of the Association of Parliamentary Librarians of Asia and the Pacific;
and assistance to the parliaments of Samoa and Vanuatu.
With regard to service benchmarks, the Library met its client usage target of 100 per
cent (consistent with the previous financial year) and received no complaints. The
Library achieved a rating of 94 per cent for client satisfaction among parliamentarians
against its target of 95 per cent (based on data from the most recent client evaluation
in 2017). It completed 10,299 individual client requests against its target of 13,000
(a demand driven measure). This figure reflects the parliamentary calendar, with
relatively few sitting days between late February and April 2019, and the prorogation of
the 45th Parliament and dissolution of the House of Representatives on 11 April 2019.
Consequently, hours spent on client requests decreased to 40,447, though this figure
was higher than the 37,434 hours recorded in the previous election year (2016). There
were 4.34 million uses of the Library collection and databases, meeting the target.
The Library will continue to monitor usage closely. A decision was made to pause work
on the Electronic Media Monitoring Service (EMMS) data remediation due to delays in
a related ICT project. Similarly, the Library paused digitisation of the Parliamentary
Authors’ Collection due to a management decision to redirect resources to a higher
priority project (the Parliamentary Papers Series).
The Library met or exceeded its targets for its remaining client service KPIs, including:
timeliness; use of online publications; electorate office visits; attendance at training
courses and events; number of research publications released; number of items
added to the EMMS service and ParlInfo Search databases and the Library catalogue;
client use of the Mediaportal and social media monitoring services; and percentage
of collection available online. Detailed discussion of the Library’s performance is
contained in the Parliamentary Librarian’s Annual Report, which is included in the DPS
Annual Report, as required by section 65(1)(c) of the Parliamentary Service Act 1999.
Performance criterion 6—ICT Service Standards
Table 11: Performance criterion 6—ICT Service Standards
| Respond to the changing needs of the Parliament
|
| Performance Measure
|
Target
|
Result
|
| 18. % of ICT Standards outlined in the ICT Service Level
Agreement that are achieved |
90% |
Achieved |
Criterion source: Program 1, 2018–19 Portfolio Budget Statement, p11; Program 1, 2018–19
Corporate Plan, p27
Methodology
Measure 18:
- Information Services Division uses the ServiceNow IT Service Management
System to capture and manage client interactions received via telephone, email,
self-service and face-to-face contacts. Client interactions are classified and
prioritised appropriately before being assigned to the relevant support group
for resolution. Data specifically related to the management and handling of
telephone calls to the 2020 Service Desk is obtained from the Alcatel-Lucent Call
Management System.
Availability statistics for key ICT systems and infrastructure is obtained directly from event
logging and monitoring software systems. Manual methods are used to calculate the
availability of broadcasting services due to the nature of these analogue systems. Their
availability is determined through a combination of regular scheduled testing, monitoring
and incidents raised by clients directly with the 2020 Service Desk. Availability of the Whole
of Government Secure Internet Gateway is reported to DPS by the vendor.
Analysis
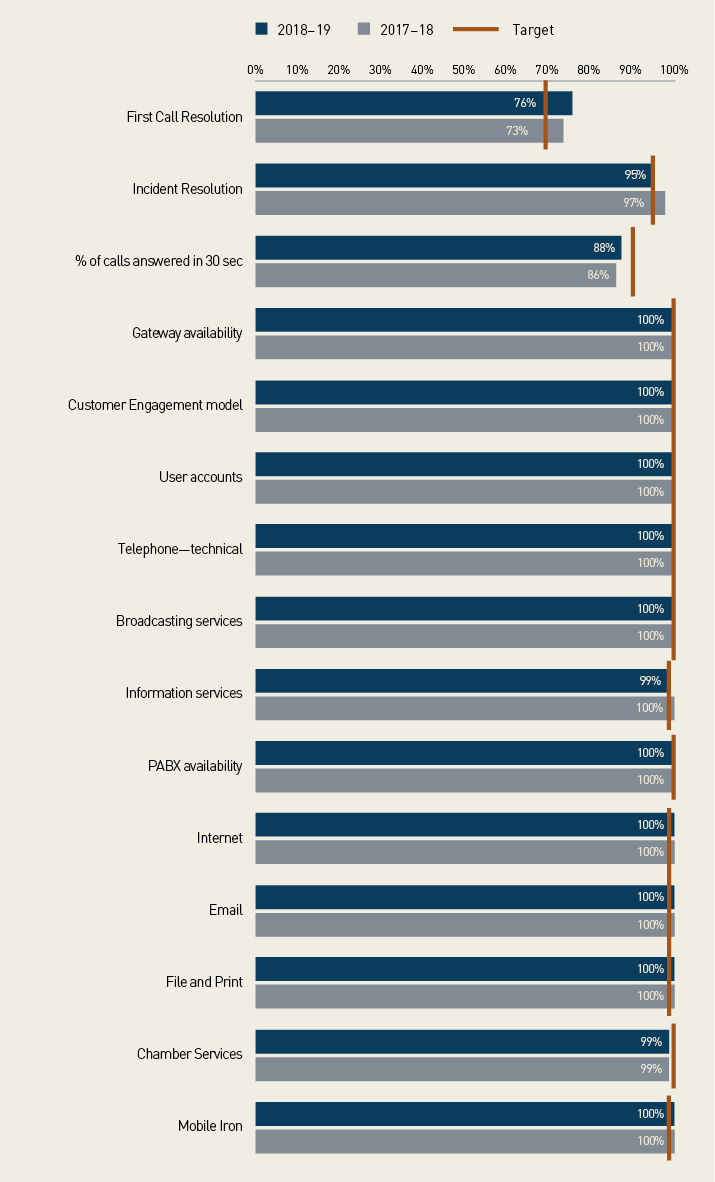
The ICT Service Standards indexes are developed and sourced from the ICT
Service Level Agreement (SLA) comprising 15 individual service standards. Each
service standard is measured monthly and assesses the delivery of key services in
support of the effective and efficient operations of the Parliament. This includes
provision of services at Parliament House, electorate offices and Commonwealth
Parliament Offices.
In 2018–19, 162 out of 180 ICT Service Standards were achieved—a result of 90 per
cent. This is a three per cent reduction on the 2017–18 result. A combination of
factors contributed to certain ICT Service Standards not being achieved at several
points throughout the year—in particular, the occurrence of a major ICT incident on
17 October 2018 that impacted most ICT Service Standards. The outage resulted from
the failure of a critical ICT infrastructure capability, namely the Domain Name Server
(DNS) system. Underlying ICT services continued to function but were uncontactable
on the parliamentary network due to the nature of the outage. ICT teams responded to
the incident until the service was restored on 18 October 2018. This incident resulted in
only nine of 15 Service Standards being met for the month of October 2018, including
Chamber Services, which were adversely impacted due to the outage occurring on a
sitting day. As a direct response to this incident, the DNS platform used by DPS was
replaced with an alternative solution providing improved resiliency.
ICT teams also responded to a cyber security incident in February 2019. As part of this
response, remediation action was taken to force a password reset for all parliamentary
computing network accounts. This activity resulted in a significantly higher volume of
calls being placed to the 2020 Service Desk for password resets and to report ancillary
issues related to the incident. Despite this, only the percentage of calls answered in 30
seconds Service Standard was not met for the month of February.
Figure 9: Average ICT Service Standards levels
Performance criterion 7—Design Integrity Performance
Table 12: Performance criterion 7—Design Integrity Performance
| Effective stewardship of Australian Parliament House
|
| Performance Measure
|
Target
|
Result
|
| 19. The level at which the design integrity process
is functioning |
Effective |
Achieved |
| 20. The extent and effectiveness of consultation with moral
rights administrators and DPS regarding the process
for design integrity and moral rights matters |
Effective |
Achieved |
Criterion source: Program 1, 2018–19 Portfolio Budget Statement, p11; Program 1, 2018–19
Corporate Plan, p31
Methodology
Measure 19:
- The Design Integrity and Archives Unit (DIAU) undertakes a qualitative assessment of the level of effectiveness of the consultation processes carried out both within DPS and with Ms Pamille Berg AO Hon FRAIA and Mr Harold (Hal) Guida LFRAIA AIA, joint moral rights administrators of Mr Romaldo Giurgola AO, the recognised principal architect of Australian Parliament House.
Measure 20:
- The DIAU provides secretariat support for quarterly design integrity meetings and
other meetings (as needed) and facilitates consultation between DPS staff and
the moral rights administrators. The assessment of how effective the process has
been is based on an analysis of the numbers and types of interactions on important
capital works and maintenance projects between DPS staff and Ms Berg and
Mr Guida. DPS also formally seeks the views of the moral rights administrators
regarding the effectiveness or otherwise of our consultation with them on design
integrity and moral rights matters. This provides an important external measure of
the effectiveness of DPS’ consultation with these key stakeholders.
Analysis
Overall, the design integrity process was assessed as effective. During 2018–19,
Ms Berg and Mr Guida attended quarterly design integrity meetings with DPS senior
staff and gave three all-staff presentations on the design intent of the architecture
and art in relation to the Foyer, Members Hall and Senate Chamber (respectively). In
addition, more than 10 ad hoc face-to-face meetings were arranged with staff and one
or both of the moral rights administrators on various design intent matters.
The DIAU also participated in numerous meetings and provided advice on a wide range
of issues, including (but not limited to):
- major capital works, including, for example, kitchens infrastructure upgrades,
accessible bathrooms, working at heights, lighting and lift upgrades
- furniture, fittings, fixtures and furnishings
- accessibility matters
- information, communication and telecommunication issues, and
- landscape and gardening.
Design integrity continues to be an important agenda item at fortnightly Executive
Committee meetings and the DIAU participates in many cross-departmental fora
and project board meetings. Feedback from within the organisation has highlighted
the collaboration between the DIAU and other stakeholders is continuing to improve,
particularly in relation to the early engagement in projects which may have an impact
on the design intent of the building. During 2017–18, new consultation protocols
were developed and in April 2019 these protocols were formalised in the form of a
Management of Design Integrity Framework.
A major goal for DPS remains the ongoing consultation and liaison with the
moral rights administrators from the earliest possible stage in capital works and
maintenance projects. In responding to a request for feedback, including on how the
design integrity consultation process may be improved over coming years, the joint
moral rights administrators have collectively indicated the process is working very
well. They have remarked that as the consultation process has matured over the past
few years, and with the engagement of an architectural historian, more proactive
engagement by DPS in seeking their views on design integrity matters has occurred.
This in turn has resulted in efficiency gains and better design solutions. Further, the
joint moral rights administrators have indicated that consultation has reached a good
balance resulting in efficient provision of advice and mutual respect being accorded to
the ideas being discussed.
Performance criterion 8—Building Condition Rating
Table 13: Performance criterion 8—Building Condition Rating
| Effective stewardship of Australian Parliament House
|
| Performance Measure
|
Target
|
Result
|
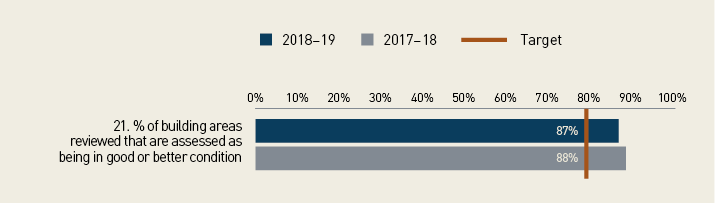
| 21. % of building areas reviewed that are assessed as
being in good or better condition |
80% |
Achieved |
Criterion source: Program 1, 2018–19 Portfolio Budget Statement, p11; Program 1, 2018–19
Corporate Plan, p31
Figure 10: % of building areas reviewed that are assessed as being in good or
better condition
Methodology
Measure 21:
- DPS measures the Building Condition Rating (BCR) by the percentage of building
areas reviewed that are assessed as being in good or better condition.
The BCR measures the current condition of building fabric within Parliament House,
expressed as a percentage of the original condition. The BCR is determined by a visual
inspection of the building and fabric surfaces for deterioration and damage caused by
general wear and tear.
Analysis
In 2018–19, the performance measure result was 86.67 per cent, which represents a
decrease of 1.44 per cent compared to 2017–18. The minor decrease is attributed to:
- Ministerial furniture finishes to both the executive and staff areas showing signs
of deterioration
- external concrete and stone facades requiring cleaning
- stone paving sets in courtyards along the curved walls requiring resetting due
to movement
- mortar and sealant jointing to paving slabs requiring replacement
- previously refurbished suites starting to show signs of wear in carpet and
painted surfaces, and
- ensuite and toilet floor tiles delaminating in various areas throughout the building.
In response to results identified through the BCR, DPS Maintenance Services
undertook activities to address the performance decrease by implementing
the following:
- an increased focus on ongoing refurbishment of Ministerial Suites, including
patch and paint of damaged walls and refurbishment of the global furniture within
the suites
- completion of external concrete and stone facade cleaning to priority areas,
including the Ministerial courtyard and internal courtyards
- resetting the stone paving sets and replacing the stonework mortar and sealant
jointing in courtyards
- improved maintenance painting program for general circulation areas and suites,
and
- a schedule of ongoing tiling works to ensuites and toilets to address delaminating
of the floors in these areas.
Performance criterion 9—Engineering Systems Condition Rating
Table 14: Performance criterion 9—Engineering Systems Condition Rating
| Effective stewardship of the Australian Parliament House
|
| Performance Measure
|
Target
|
Result
|
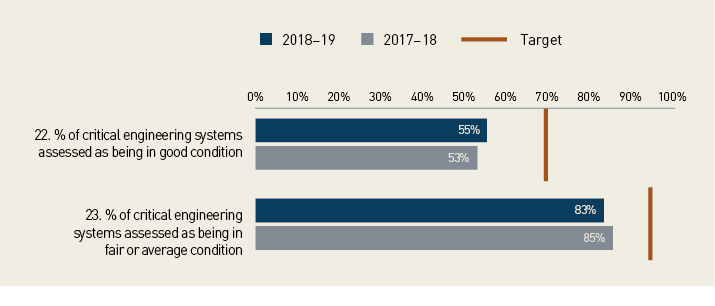
| 22. % of critical engineering systems reviewed that are
assessed as being in good or better condition |
70% |
Not Achieved |
| 23. % of critical engineering systems reviewed that are
assessed as being in fair or average condition |
95% |
Not Achieved |
Criterion source: Program 1, 2018–19 Corporate Plan, p31
Figure 11: Critical engineering systems
Methodology
Measure 22–23:
- The Engineering Systems Condition Rating (ESCR) measures the operation and condition of the engineering systems in Parliament House against the expected decline of those systems through their life cycle. The asset performance assessment system currently considers three key factors:
- physical condition
- operating condition, and
- obsolescence.
Analysis
The 55 per cent of critical engineering systems rated as being in good or better
condition represents a slight improvement from the 53 per cent result for 2017–18.
While this year’s result is 15 per cent below the target, this result in part reflects
the age of the Parliament House engineering systems and infrastructure. Delays in
previous years to the delivery of capital works projects in the replacement and upgrade
of the ageing infrastructure have also contributed. Improvements will be realised
over the next five years as packages of capital works are delivered within each system
category. A review of rankings for individual system categories shows that the condition
of the engineering systems, including building management, broadcasting, electrical,
hydraulics, and heating ventilation and air conditioning systems, are having an adverse
impact on results.
The 83 per cent of engineering systems rated as being in fair or better condition
is 12 per cent below the target of 95 per cent and represents a slight decline from
the 85 per cent result for 2017–18. This is a result of the condition of the area main
switchboards, emergency generation systems, air handling units, domestic cold water
meters, hot water network, building management system, lifts, kitchen equipment and
wiring infrastructure which have yet to be impacted by the delivery of projects under
the capital works program.
Kitchen equipment in the Great Hall, which was rated as ‘failed condition’—the lowest
rating—will be replaced in 2019–20 as part of a capital works project. The other
subsystems rated as ‘poor’ are included in a current or proposed project in the Capital
Works Plan for renewal or replacement. For example, 22 of the 42 lifts in the building
were rated as being in poor condition and they are being updated as part of an ongoing
capital works project; however, overall the lifts in the building received a 33 per cent
increase as the capital works project delivers improvements. Another example is the
lighting controllers which are also being replaced as part of a capital works project.
In 2018–19, significant upgrades through capital works projects have been made
to subsystems, such as replacements to boilers and chillers. However, these are
subcomponents of the engineering systems and overall improvements in these
particular systems have not yet been realised using the ESCR. Under this performance
criterion, the overall rating for the engineering systems will be achieved when a
majority of its components receive a positive rating on the ESCR.
Performance criterion 10—Landscape Condition
Table 15: Performance criterion 10—Landscape Condition
| Effective stewardship of the Australian Parliament House
|
| Performance Measure
|
Target
|
Result
|
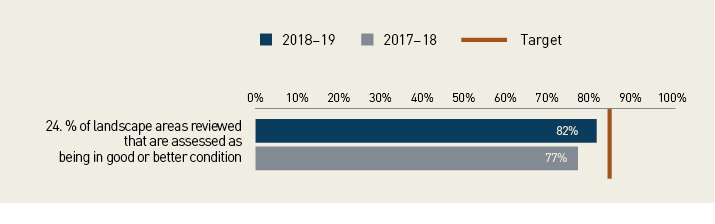
| 24. % of landscape areas reviewed that are assessed as
being in good or better condition |
85% |
Not Achieved |
Criterion source: Program 1, 2018–19 Portfolio Budget Statement, p11; Program 1, 2018–19
Corporate Plan, p31
Methodology
Measure 24:
- The Landscape Condition Rating (LCR) measures the current condition of the
landscape surrounding Parliament House. The LCR is expressed as a percentage
and is measured annually. The assessment takes into account variables such
as the intended purpose, life cycle, planned maintenance levels and seasonal
variations. The methodology is designed to give a fair representation of the overall
landscape condition.
Figure 12: % of landscape areas reviewed and assessed as being in good or
better condition
Analysis
The target for the LCR rating is 85 per cent. For the year 2018–19, the rating was
82.13 per cent. The LCR rating was 5.4 per cent higher than the 2017–18 year but is
still 2.87 per cent lower than the target.
The 2018–19 result can be largely attributed to the 30 per cent plant losses sustained
throughout the Senate side gardens and the waterproofing issues with the Members
and Guests terrace garden. Over the 2019–20 reporting period, DPS plans to continue
to replace plants that are not thriving across Parliament House. We will also deliver a
structured soil project on the Senate side that will lead to improved soil quality. DPS is
confident this will result in overall improvements to the plant and tree conditions and
see a continuing improvement in the LCR, with the target being exceeded in 2019–20.
Performance criterion 11—Security
Table 16: Performance criterion 11—Security
| Effective stewardship of the Australian Parliament House
|
| Performance Measure
|
Target
|
Result
|
| 25. % of security incidents that are handled in accordance
with policy and process |
100% |
Not Achieved |
| 26. % of Parliamentary Security Service Officers compliant
with mandatory training requirements |
100% |
Not Achieved |
Criterion source: Program 1, 2018–19 Portfolio Budget Statement, p11; Program 1, 2018–19
Corporate Plan, p31
Methodology
Measure 25:
- Incident reports are used by the Security Branch to document information on,
and provide management visibility of, a range of events and interactions involving
Parliamentary Security Service (PSS) officers. A security incident is an incident
that impacts on the integrity of the security arrangements of Parliament House.
Security incidents are analysed to determine if the response by PSS was in
accordance with DPS policy and procedure. The result is the percentage of
responses that comply with DPS policy and procedure.
Measure 26:
- The mandatory training for PSS officers is Initial Security Training (IST) and
Competency Maintenance Training (CMT). IST is a six week program providing
new recruits the basic training they require to fulfil their roles and obligations as a
PSS officer, covering topics such as communication, access control and screening.
PSS officers are not allowed on duty until they have completed IST.
- The CMT is an ongoing training requirement. It covers areas such as First Aid,
Operational Safety Training (OST) and parliamentarian recognition. All areas have
specific requalification windows which are tracked by the Security Branch Learning
and Development Coordinator. The result is calculated as at 30 June each year.
Analysis
The target for correct handling of security incidents is 100 per cent. For the year
2018–19, the actual achievement was 94.54 per cent. While this did not compromise
the security operation function, factors such as human error prevented the target
from being achieved. The objective is to document all security incidents and to identify
where the response by a PSS officer was not in compliance with operating policies
and procedures. When the cause of non-compliance is identified, it is addressed
by way of training updates or recommended changes to security procedure as
considered necessary.
The target for compliance with mandatory security training is 100 per cent. For
2018–19, the actual achievement was 87 per cent. Completion of training in the
required time frame continues to be affected by leave (particularly medical and
unscheduled leave) and operational reasons (such as parliamentary sittings), which
reduce the ability to assign PSS officers to training. In addition, the percentage of
PSS officers compliant with mandatory security training requirements decreased this
year as the delivery of CMT was postponed whilst the department aligned its DPS
OST, formerly Defensive Tactics Training, with the standards applied by the Australian
Federal Police and transitioned to an in-house training model.
Performance criterion 12—Parliament House works program
Table 17: Performance criterion 12—Parliament House works program
| Effective delivery of the Australian Parliament House Works Program
|
| Performance Measure
|
Target
|
Result
|
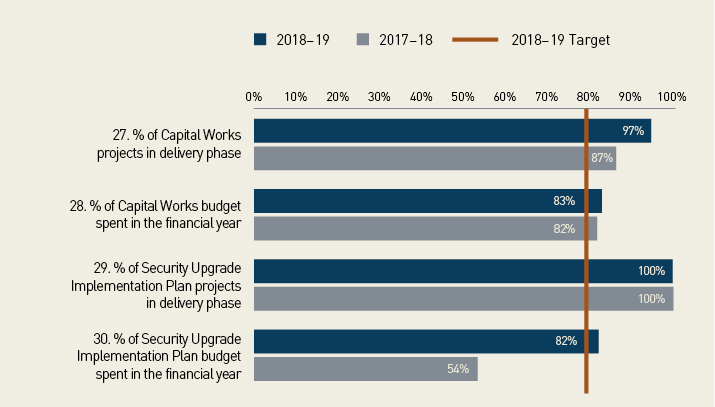
| 27. % of Capital Works Branch projects in delivery phase |
80% |
Achieved |
| 28. % of Capital Works Branch budget spent in the
financial year |
80% |
Achieved |
| 29. % of Security Upgrade Implementation Plan projects in
delivery phase |
80% |
Achieved |
| 30. % of Security Upgrade Implementation Plan budget
spent in the financial year |
80% |
Achieved |
Criterion source: Program 1, 2018–19 Portfolio Budget Statement, p11; Program 1, 2018–19
Corporate Plan, p31
Figure 13: Parliament House Works Program KPIs
Methodology
Measure 27:
- Number of capital works projects in delivery phase divided by number of capital
works projects planned.
Measure 28:
- The actual amount spent on capital works projects divided by the total budget.
Measure 29:
- Number of Security Upgrade Implementation Plan (SUIP) projects in delivery phase
divided by number of Security Upgrade Implementation Plan projects planned.
Measure 30:
- The actual amount spent on Security Upgrade Implementation Plan projects
divided by the total budget.
A standard industry measure of project success is delivering on time and on budget.
Given the restrictions of sitting periods and other parliamentary activities, project
time frames have to be regularly adjusted. This makes it difficult to define a consistent
measure of whether projects are delivered on time. Therefore, DPS is tracking the
number of projects in delivery compared to the planned number of projects. Combined
with tracking whether DPS is on budget, this provides a picture of whether the Capital
Works Program and SUIP are successfully adapting to the changing requirements and
managing to use the annual budget.
Analysis
The 2018–19 year was very productive for the Capital Works Program, with all four
targets achieved. Good progress was made on both the physical and electronic
components of the security works. The perimeter fencing construction activities were
completed with only the remedial works on nearby landscaping remaining. Work on
the Senate, House of Representatives and main public entrances progressed more
slowly than expected; in part because of poor performance and eventual liquidation of
a subcontractor and the consequent delays while a new subcontractor was engaged to
complete the works.
The roll-out of electronic security measures—including improved Closed Circuit
Television coverage and the Electronic Access Control System (EACS) for selected
areas—is substantially complete with a small amount of EACS installation and
testing remaining.
The non-security works program accelerated dramatically in 2018–19. Significant
improvements were made to the climate control system with major upgrades to plant
and the roof structure to rectify water ingress, including the Senate Chamber skylight.
Improvements were also made to the electrical network, lifts and the Emergency
Warning Intercommunication System.
Footnotes:
This is a new performance measure in 2018–19.
This is a new performance measure in 2018–19.
The target for KPI 11 was incorrectly reported as 90 per cent in 2018–19 DPS Corporate Plan.
This is a new performance measure in 2018–19.
This is a new performance measure in 2018–19.
This is a new performance measure in 2018–19.
KPI 22 wording was incorrectly published in the 2018–19 Corporate Plan with the text ‘or
better’ omitted.