DPS receives departmental and administered operating and capital funding as well as funds through third-party drawing rights.
Details of the DPS appropriations, programs and an explanation of the results are provided below:
Table 1: Resource Statement, 2018–19
| Department of Parliamentary Services
|
Actual Available Appropriation for 2018–19
|
Payments made 2018–19 |
Balance Remaining 2018–19 |
|
|
$’000 |
$’000 |
$’000 |
|
|
(a) |
(b) |
(a) - (b) |
| Ordinary Annual Services
|
| Departmental Appropriation
|
|
|
|
|
| Ordinary annual services |
|
190,218 |
161,089 |
29,129 |
| Total |
|
190,218 |
161,089 |
29,129 |
| Administered expenses |
|
|
|
|
| Outcome 1 |
|
9,490 |
4,815 |
4,675 |
| Total |
|
9,490 |
4,815 |
4,675 |
| Other services |
| Departmental non-operating |
|
|
|
|
| Non-operating |
|
- |
- |
- |
| Total |
|
- |
- |
- |
| Administered operating |
|
|
|
|
|
Administered assets and liabilities
|
|
123,959 |
73,317 |
50,642 |
| Total |
|
123,959 |
73,317 |
50,642 |
| Total other services (B) |
|
123,959 |
73,317 |
50,642 |
| Total resourcing and payments (A+B) |
|
323,667 |
239,221 |
84,446 |
Table 2: Expenses by Outcome, 2018–19
Outcome 1: Support the functions of
Parliament and parliamentarians
through the provision of professional
services, advice and facilities and
maintain Australian Parliament House
|
Budget 2018–19
|
Actual expenses 2018–19 |
2018–19 |
|
|
$’000 |
$’000 |
$’000 |
|
|
(a) |
(b) |
(a) - (b) |
| Program 1.1: Parliamentary Services
|
| Departmental Expenses
|
|
|
|
|
| Departmental annual appropriations |
|
163,774 |
161,089 |
2,685 |
| Total for Program 1.1 |
|
163,774 |
161,089 |
2,685 |
| Program 1.2: Parliament House Works Program
|
| Administered expenses |
|
|
|
|
| Administered annual appropriations |
|
6,249 |
4,815 |
1,434 |
| Administered assets and liabilities |
|
45,426 |
73,317 |
-27,891 |
| Total for Program 1.2 |
|
51,675 |
78,132 |
-26,457 |
| Total expenses for Outcome 1 |
|
215,449 |
239,221 |
-23,772 |
Departmental operating and capital results
DPS’ operating result for 2018–19 was a deficit of $1.9 million. This result excludes the impacts of depreciation and amortisation ($20.2 million) for which the department is not funded. The operating result includes the impact of bond rate reductions on the value of the department’s leave provisions (approximately $1.8 million) for which the department cannot reliably budget.
The total departmental expenses excluding depreciation and amortisation were
$141.9 million. This consisted of $94.0 million in employee expenses, $47.8 million in supplier costs and $0.09 million in write downs and loss on sale of assets. This was funded by $126.3 million in revenue from government and $13.7 million in own source revenue.
Figure 1: Departmental Operating Expenses by
Functional Area
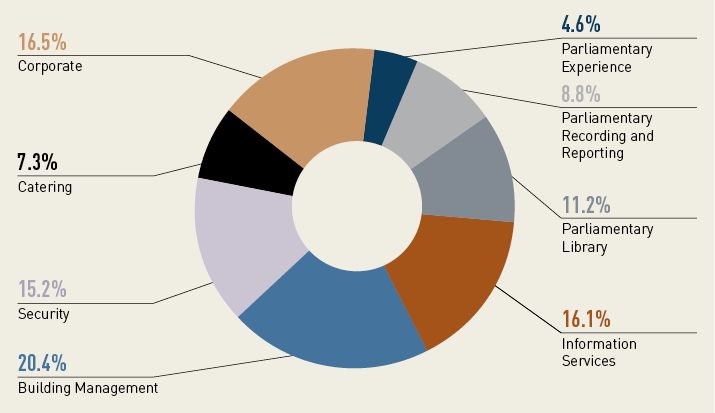
Departmental capital is used to deliver a program of work in support of the work of parliamentarians, occupants of the building and visitors to Parliament House. It incorporates activities relating to technology, the Parliamentary Library and parliamentary experience.
The departmental capital spend for 2018–19 was $17.6 million. This is $2.0 million less than the $19.6 million in departmental capital appropriated for 2018–19.
Administered operating and capital results
The administered activities of the department deliver a building works program that maintains Parliament House as a safe and accessible workplace and public building. It incorporates activities relating to the building or art within the building. The administered program also includes the Australian Parliament House Security Upgrade project budget measure which was originally appropriated in 2014–15.
DPS spent $77.5 million in administered capital and $9.7 million in administered operating in 2018–19 (excluding depreciation and amortisation). The administered capital expenditure was $32.1 million higher than estimates at 2018–19 budget. A movement of funds was sought and approved during the 2018–19 financial year.
Third party drawing rights
DPS has access to the Department of Finance’s appropriation for the purposes of providing infrastructure and communications technology services to electorate offices and former Prime Ministers, and photographic services to Parliament. DPS drew down $22.2 million from the Department of Finance’s appropriation to deliver these services. This access is in accordance with the Parliamentary Business Resource Act 2017 (PBR Act).
Footnotes:
Appropriation (Parliamentary Departments) Act (No.1) and (No.2) 2018–19.
This includes prior
year departmental appropriation, capital and section 74 relevant agency receipts.
Includes an amount of $19.6 million in 2018–19 for the Departmental Capital Budget.
For accounting purposes this has been designated as ‘contributions by owners’.
Includes Appropriation (Parliamentary Departments) Act (No.1) and (No.2) 2018–19,
less appropriations that lapsed during the year.
Full year budget, including any subsequent adjustment made to the 2018–19 budget at
Additional Estimates.
Departmental appropriation combines ordinary annual services and retained revenue receipts
under section 74 of the Public Governance, Performance and Accountability Act 2013.