At 30 June 2017, the Library’s workforce comprised:
- Office of the Parliamentary Librarian—11 employees (10.1 FTE)
- Library Collections and Databases Branch—52 employees (50.6 FTE), and
- Research Branch—92 employees (83 FTE).
During 2016–17, the Library workforce:
- increased in number from 145 to 155 employees, and in FTE from 135.7 (as at 30 June 2016) to 143.6 (as at 30 June 2017), 32 (or 21 per cent) of whom were non-ongoing, and
- had a median age of 44 years (steady from in 2016).
Age profile
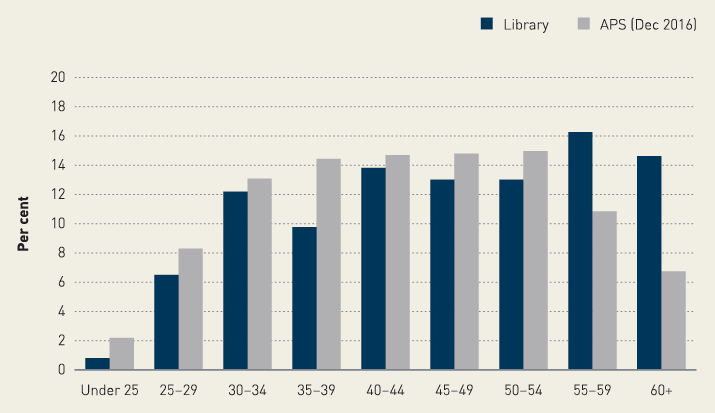
At 30 June 2017, 31 per cent of the Library’s ongoing employees were aged 55 years and over. A further 26 per cent will move into that age cohort within the next 10 years. As can be seen in Figure 8 below, the age profile of the Library’s ongoing employees remains somewhat older than that of the Australian Public Service (APS).
Figure 8: Age profile of ongoing staff

The Library’s relatively older age profile has been evident for some years, but is considerably less pronounced than it was a decade ago; the proportion of employees aged 45 and over has fallen from 71 per cent in 2007 and has been steady at 57 per cent for 2016 and 2017.
Classification
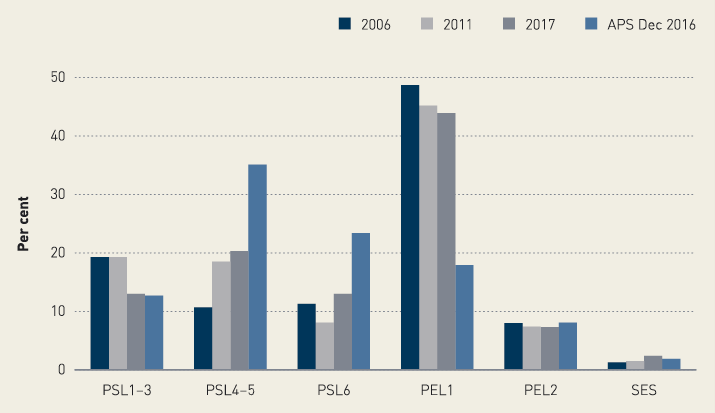
Given the nature of much of the work undertaken in the Library, the classification profile overall is concentrated at PEL 1, with 44 per cent of ongoing employees being at this level (the majority of whom are in Research Branch). In contrast, only 18 per cent of ongoing employees in the APS are at the equivalent EL 1. However, over time, there has been an increase in the proportion of Library employees at PSL 4–5 and PSL 6, as shown in Figure 9 below. This shift reflects the Library’s growing focus on developing potential career paths for less experienced employees to ensure continuity of skills and opportunities to expand corporate knowledge. In Research Branch, an additional benefit is that it enables senior researchers to concentrate on more complex work.
Figure 9: Classification profile of Library staff

As shown in Figure 9 above, the proportion of employees at middle management (PEL 2) is slightly below the APS average.
Another measure of classification profile is span of control; at June 2017, the Library had 12.3 employees at lower levels for each PEL 2, compared with 11.1 for the APS.
Employment status and gender
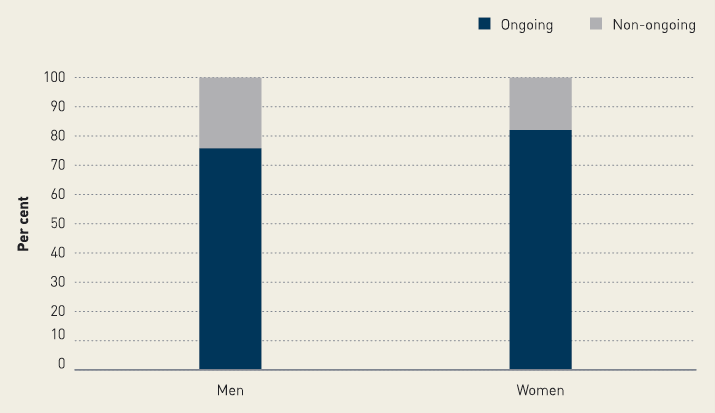
As noted earlier, the Library’s non-ongoing workforce at June 2017 accounted for 21 per cent of all employees, up four percentage points from the previous year. Non-ongoing employees are generally engaged to replace staff on long leave, to meet demand in peak periods, and while recruitment processes are under way. Using fixed-term positions (one or two years) also allows flexibility to redirect resources according to business needs as new areas of interest to the Parliament emerge or as the level of the Library’s funding waxes and wanes.
Figure 10: Employment status by gender for Library staff

The proportion of non-ongoing employees in the Library is higher than in the APS (12 per cent), reflecting the sessional nature of many of our work patterns.
Having surge capacity is important to allow us to meet client demands at peak periods, particularly at the Federal Budget period. This year, the Library continued to refresh its temporary employment register to support this demand. The Library also participated in a number of placement programs for academic courses related to the Library’s needs, and this has helped raise the Library’s profile as an employer of choice.
The Library has a similar gender profile to that of the APS, with 59 per cent of ongoing employees being women—the same proportion as in the APS. For non-ongoing employees, the Library has a much lower proportion of women (50 per cent compared with the APS 63 per cent).
Recruitment
During 2016–17, there were 36 new external employees recruited—eight were ongoing and the remainder were engaged on a fixed-term or sessional basis.
- Research Branch recruited 23 new employees: four ongoing and 19 non-ongoing. All sections but one recruited new employees, with seven in Law and Bills Digests, five each in Economics and Social Policy, three in Statistics and Mapping, two in Politics and Public Administration, and one in Science, Technology, Environment and Resources. Foreign Affairs, Defence and Security did not recruit any new employees.
- Library Collections and Databases Branch recruited 10 new employees: two ongoing (one each in Central Enquiry Point and a Library Innovation Officer) and the others on fixed-term or intermittent non-ongoing contracts in Collection Management and Database and Media Services.
- The Office of the Parliamentary Librarian recruited three new employees: two ongoing (to replace permanent staff who had transferred to other agencies) and one non-ongoing (to replace a staff member on extended leave).
Separations
Thirty-one staff left the Library during 2016–17: 13 were ongoing employees, and the remainder were non-ongoing on fixed-term or irregular/intermittent contracts. Of the non-ongoing separations, nine had been engaged during the year on short-term contracts.
For all staff, the separation rate was 20 per cent, a slight reduction from 21 per cent the previous year. For ongoing staff, the separation rate of 11 per cent was somewhat higher than that for the APS (7 per cent in 2016).
The reasons for separations were:
- age retirement (six employees)
- end of contract (11 employees)
- end of temporary transfer (two employees)
- transfers (five employees)
- resignation (six employees), and
- invalidity retirement (one employee).
The following table shows separations for ongoing and non-ongoing employees by branch during 2016–17.
Table 24: Separation by organisational unit
| Separation method |
Branch |
Ongoing |
Non-ongoing |
Total |
| Age retirement |
Research |
3 |
1 |
4 |
| Library Collections and Databases |
2 |
|
2 |
| End of contract or temporary transfer from APS |
Research |
|
8 |
8 |
| Library Collections and Databases |
|
3 |
3 |
| Office of the Parliamentary Librarian |
|
2 |
2 |
| Permanent transfer to APS or Parliamentary Service |
Research |
4 |
|
4 |
| Office of the Parliamentary Librarian |
1 |
|
1 |
| Resignation |
Research |
1 |
2 |
3 |
| Library Collections and Databases |
1 |
2 |
3 |
| Invalidity retirement |
Library Collections and Databases |
1 |
|
1 |
Footnotes:
Department of Parliamentary Services Annual Report and Financial Statements 2008–09, p41.
APSC, APS Statistical Bulletin December 2016, Table 11.
Ibid, Table 11
Ibid, Table 1
Ibid, Table 1
Ibid, Tables 10 and 45.