Appendix A: Environmental management
DPS reports annually on elements of environmental performance, in line with the Environment Protection and Biodiversity Conservation Act 1999 (EPBC Act), for the management of resources for which it is responsible.
DPS also reports under:
- the Energy Efficiency in Government Operations (EEGO) Policy
- the National Environment Protection Measures (Implementation) Act 1998
- the National Pollutant Inventory (NPI).
Ecologically sustainable development
The objective of Ecologically Sustainable Development (ESD) is defined as ‘development that improves the total quality of life, both now and in the future, in a way that maintains the ecological processes on which life depends’20.
DPS reports annually on ESD through this report.
Identification, management and monitoring of environmental impacts
DPS aims to ensure that the vital functions of Parliament House operate effectively, while minimising resource consumption and waste production by:
- monitoring environmental performance
- implementing programs and projects to improve environmental outcomes
- developing plans to improve environmental sustainability.
Many activities at Parliament House—including maintenance, engineering, landscaping, ICT, catering and office-based services—have the potential to affect the environment through energy and water consumption, greenhouse gas emissions and waste generation. DPS works to improve outcomes in these areas in a number of ways.
In 2014–15, actions included:
- completing a Building Condition Assessment Report to inform infrastructure upgrades
- upgrades and improvements to lighting and air-conditioning
- upgrades to ICT equipment to improve efficiency, air quality, and reduce consumables, and
- progressing the Lake Water Supply Project to reduce potable water usage in the landscape.
DPS incorporates environmental guidelines and checklists in the procurement of products and services and in the planning and delivery of projects, including consideration of:
- whole-of-life principles
- sustainable procurement principles
- reuse and recycling of materials
- energy, water and waste minimisation.
20National Strategy for Ecologically Sustainable Development 1992
Communication and promotion
DPS provides information on its environmental performance and promotes sustainability initiatives through the APH website, internal circulars and departmental newsletters. DPS encourages participation in annual environmental events such as National Recycling Week.
Environmental performance
Water consumption
Total water consumption for 2014–15 was 187,300kL, representing a decrease of 2.7 per cent on the 192,463kL consumed the previous year. Landscape water consumption decreased from 114,587kL in 2013–14 to 99,269kL in 2014–15, representing a decrease of 13 per cent. Annual water consumption for Parliament House is shown in Figure 16.
Figure 16: Annual water consumption 2005-15
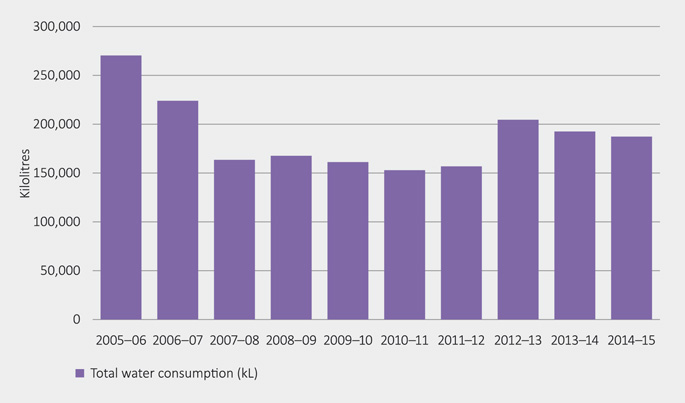
Figure 16 shows water consumption for 2014–15 has decreased slightly compared to the previous two years. This is attributable to higher than average rainfall during the summer period which meant less water for irrigation was required.
Figure 17 shows a breakdown of water use during 2014–15.
Figure 17: Water use during 2014-15
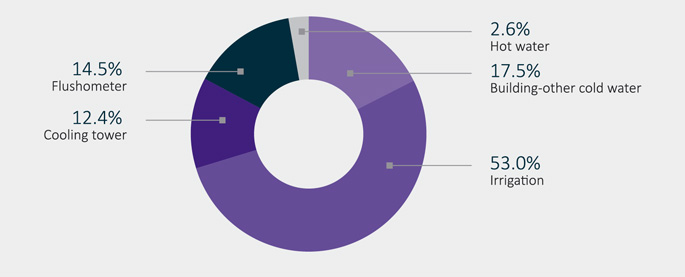
Building water consumption in 2014–15 was 88,031KL, an increase of 13 per cent on 77,876KL consumed the previous year. The increase in building water use was mainly due to the reactivation of additional water features from June 2014, and comparatively less water consumed in 2013–14 as a result of the federal election, when the building was less frequently occupied.
Water saving initiatives
Lake water supply initiative
The ongoing reliance on potable (high-quality drinking) water for maintaining the Parliament House landscape is expected to be problematic for DPS in the coming years as water utility costs increase and drier weather conditions are expected to become more frequent, resulting in higher water consumption.
A feasibility study completed in late 2014 concluded that water sourced from Lake Burley Griffin could provide a safe and reliable alternative water supply for landscape irrigation with a favourable return on investment. Landscape irrigation at Parliament House accounts for 50–60 per cent of total water use—approximately 110,000KL per annum.
An application for a Water Access Entitlement was successfully lodged with the ACT Government, which allows DPS to extract 115,000KL of water annually from the lake. Further work on the detailed design and documentation of an infrastructure solution will be completed in 2015.
Energy consumption
In 2014–15, energy consumed at Parliament House and by vehicles managed by DPS was 139,169 GJ, representing an increase of 1.5 per cent from the previous year. Electricity consumption increased by 3.3 per cent, natural gas consumption decreased by 1.5 per cent, diesel fuel energy (non-transport) increased by 5 per cent, and energy for DPS vehicles decreased by 22 per cent compared with 2013–14.
Table 45 shows energy consumption by the Parliament House building and DPS vehicles.
Building energy use comprises:
- natural gas for heating, general hot water and in kitchens
- electricity to power office lighting, mechanical services, lifts, cooling and ICT equipment
- a small amount of diesel mainly used for testing the emergency backup generators.
Table 45: Energy consumed at Parliament House and by DPS transport
|
Indicator
|
Energy Consumption (GJ)
|
|
|
2012–13
|
2013–14
|
2014–15
|
|
Parliament House building1
|
142,226
|
136,450
|
138,669
|
|
Transport–passenger vehicles
|
644
|
261
|
199
|
|
Other transport2
|
424
|
383
|
301
|
|
Total energy consumption
|
143,294
|
137,094
|
139,169
|
1Includes electricity, natural gas and diesel (non-transport).
2Includes LPG, diesel and petrol used for maintenance and loading dock vehicles.
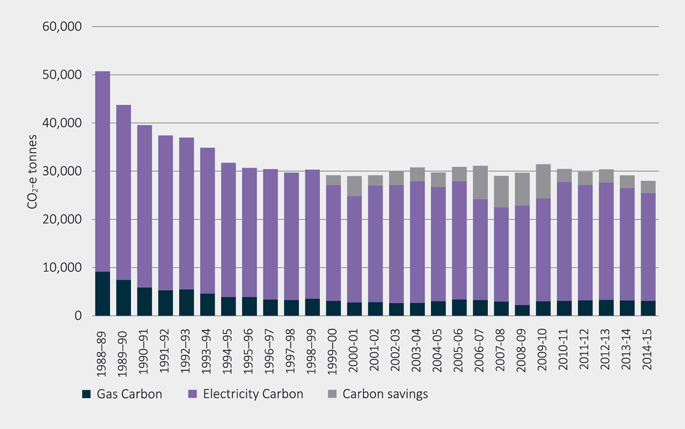
Figure 18: Annual electricity and gas consumption from 2005-06 to 2014-15
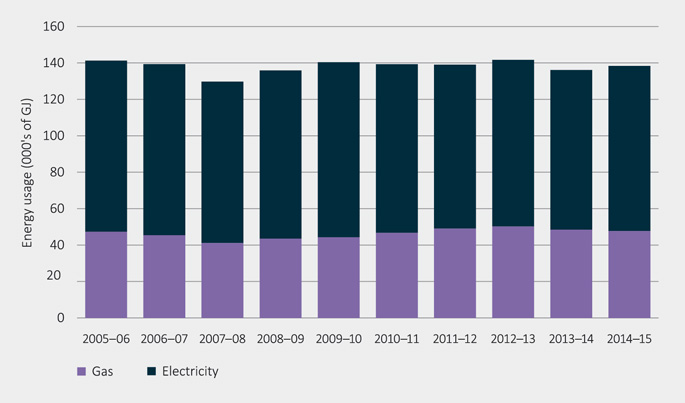
Electricity, gas and diesel consumption
Figure 18 shows Parliament House electricity and gas usage in 2014–15 was consistent with previous years—only slightly above the average consumption of 138 mega joules over the past 10 years. Energy use in 2014–15 was comparatively higher than 2013–14 due to the 2013 federal election, when building occupancy rates and associated energy use is typically lower.
In 2014–15, a fault with the building’s small central electric chiller—typically used for cooling the building during off-peak periods—meant a larger chiller was in operation, contributing to the 3.3 per cent increase in electricity consumption.
Transport energy use
In 2014–15, there was a 22 per cent reduction in energy use associated with DPS vehicles (e.g. gardening, maintenance and logistics vehicles) compared with 2013–14. The DPS Executive Vehicle Scheme was abolished in 2014–15. Other transport energy was also lower, consisting of fuel and gas used in DPS maintenance and loading dock vehicles, many of which operate on electric power to reduce emissions.
Energy saving initiatives
Building Condition Assessment Report
In 2014–15, DPS completed a major Building Condition Assessment to guide strategies and actions for building refurbishments, upgrades and maintenance over the coming years. Strategies will be developed to ensure future building assets, equipment, and engineering support systems are reliable, efficient and contribute to improved environmental outcomes where possible.
A major equipment upgrade planned for 2015­–16 is the replacement of two large central chillers used for cooling the building. The existing 25-year-old chillers will be upgraded to energy-efficient models—completing the chiller upgrade program which commenced in 2010.
In 2014–15, DPS is trialling the use of carbon dioxide (CO2) sensors connected to the air-conditioning system. By monitoring the CO2 levels, the external air louvres can be closely controlled to optimise fresh air in the building and reduce energy wastage from over-heating and over-cooling.
Lighting
Since Parliament House opened in 1988, DPS Electrical Services has employed a continuous program of lighting upgrades to ensure more energy-efficient technology is introduced into the building in a timely manner. With over 35,000 lights and 400 different types, DPS is continually reviewing and trialling new lighting technology to improve efficiency and reliability, while also ensuring the building heritage and design aspects are considered.
In 2014–15, DPS performed the following lighting upgrades and trials:
- approximately 250 internal ‘PAR 38’ flood lights (used for artwork and wall lighting) upgraded to energy-efficient LED technology
- further upgrades to bathroom and toilet lights with LED technology
- gradual upgrade of compact fluorescent lamps with LED technology
- trialling of LED technology on:
- external sloping wall lights (Forecourt)
- internal ‘PAR 56’ flood lights (used in high roof lighting)
- Senate lounge areas and swimming pool.
Compared to compact fluorescent lamps—which make up the majority of lights at Parliament House—LED lighting typically requires half the power, has six times the life expectancy, and contains no toxic mercury.
ICT Sustainability
In 2014–15, DPS replaced ageing ICT desktop equipment in the building with more energy efficient technology and completed an audit of all DPS-owned printing devices with a view to identifying efficiencies.
In 2014–15, DPS installed approximately 1,800 new energy-efficient LED computer monitors to replace less efficient LCD monitor technology, and installed 1,700 new desktop computers with improved environmental performance.
In 2014–15, an audit of 270 DPS print devices was completed to identify efficiencies. In 2015, the fleet will be upgraded through a new managed print service which will have positive environmental benefits, including:
- rationalisation and consolidation of printers (reduction in energy)
- greater energy efficiency
- reduction in paper consumption through default double-sided printing
- ‘Follow-me’ printing which will reduce paper wastage (future option)
- reduced ink cartridge wastage through improved monitoring and management
- improved air-quality through lower emissions plastics.
Recycling and waste management
Parliament House waste is generated from a diverse range of activities within the building. Quantities and types of waste fluctuate throughout the year depending on building occupancy, sitting patterns, construction projects, office refurbishments, and election reshuffles.
DPS provides facilities to recycle paper, cardboard, printer cartridges, lamps, used oil, grease, batteries, landscape material, metal, organic food waste and co-mingled waste.
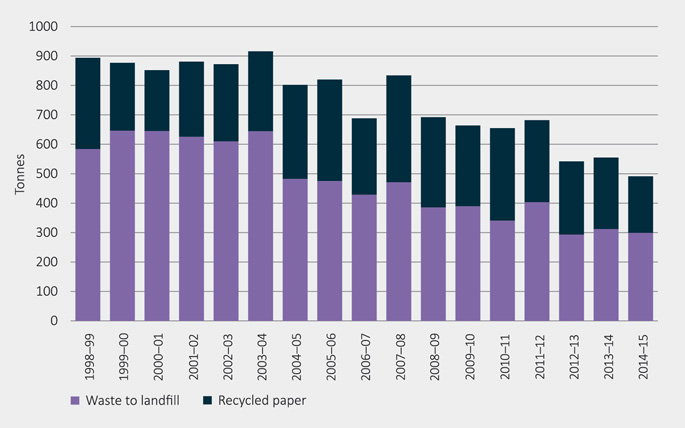
In 2014–15, the amount of general waste (excluding construction waste) sent to landfill was 299 tonnes. This is a decrease of 4 per cent compared with the 312 tonnes sent in 2013–14.
In 2014–15, a total of 192 tonnes of paper was recycled—a decrease of 21 per cent compared with the 243 tonnes in 2013–14. The amount of paper and cardboard recycled varies annually depending on purchasing requirements, parliamentary business and other building activity. Digital device usage has likely contributed to reduced paper consumption and recycling quantities.
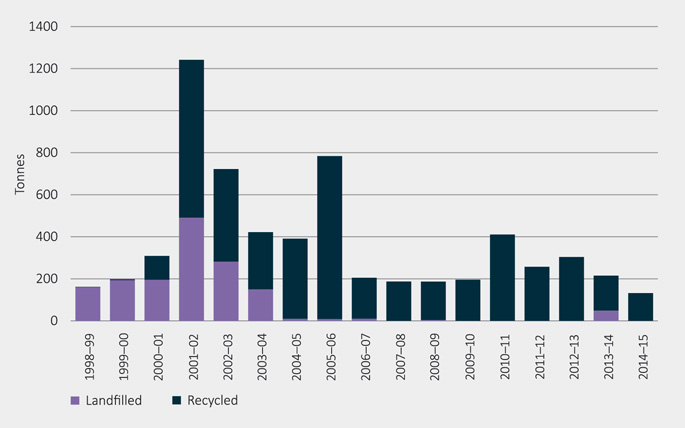
General (landfill) waste and paper waste are the highest components of waste generated at Parliament House, and in 2014–15, the total amount from these two streams was 491 tonnes—the lowest since the building opened and a 55 per cent reduction since 1988–89.
Construction waste is managed under project contracts and where possible and appropriate, construction materials are reused, recycled or disposed of in an environmentally friendly manner.
Figure 19 shows annual waste disposed to landfill and paper recycled.
Figure 19: Annual waste disposed to landfill and paper recycled
The preferred method for disposing of green landscape waste at Parliament House is to chip the material on site and re-use it in the gardens. When waste generated in the landscape cannot be chipped on site the material is taken off site to be recycled or sent to landfill. During 2014–15, 132 tonnes of landscape waste was sent for recycling. No landscape waste was sent to landfill.
Figure 20 shows annual trends in landscape waste and recycling rates.
Figure 20: Annual quantity of landscape waste (tonnes)
Co-mingled and organic waste recycling
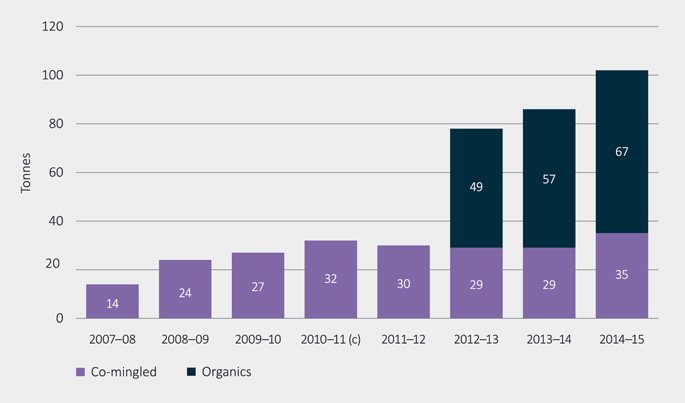
Co-mingled waste includes metal cans, glass bottles, milk cartons and plastic which is collected in a common bin. During 2014–15, a total of 35 tonnes of co-mingled waste was collected and recycled, an 18 per cent increase compared to the amount collected and recycled in 2013–14.
DPS collects organic food waste from catering operations in the building for recycling at a local worm farm. Since being introduced in 2012, the initiative has helped reduce the burden on ACT landfill sites and reduce emissions (methane) caused by the breakdown of food waste.
During 2014–15, a total of 67 tonnes of organic waste was diverted from landfill and converted into garden compost material using the worm farm—an increase of 18 per cent on the 57 tonnes collected in 2013–14. Figure 21 illustrates annual co-mingled and organic recycling rates.
Figure 21: Annual co-mingled and organic waste recycled (tonnes)
Emissions and effluents
Greenhouse gas emissions
During 2014–15, a total of 25,505 tonnes of carbon dioxide equivalent (CO2e) was generated from Parliament House operations, representing a four per cent decrease from 2013–14. Electricity and gas consumption at Parliament House comprised 99 per cent of total greenhouse gas emissions (25,446 tonnes CO2e). The reduction in emissions from 2013–14 is attributed to changes in National Greenhouse Accounts Factors which are published annually. In 2014–15, lower emissions were generated from electricity production in NSW and ACT.
In 2014–15, greenhouse gas emission offsets included 2,487 tonnes CO2e from 10 per cent accredited green power purchased through the whole-of-government electricity contract, and a further 56 tonnes CO2e from clean electricity generated from the roof-top solar panels at Parliament House.
Table 46 shows the breakdown of emissions within various categories.
Table 46: Parliament House emissions (direct and indirect, including passenger and operational vehicle fleets)
|
Emission category
|
Comment
|
2012–13 (tonnes CO2e)
|
2013–14 (tonnes CO2e)
|
2014–15 (tonnes CO2e)
|
|
Scope 1
|
Emissions at the source of the activity (for example, emitted from gas and fuels used at Parliament House and by vehicles)
|
2,684
|
2,548
|
2,504
|
|
Scope 2
|
Emissions generated elsewhere (for example, by the power plants that produce the electricity used at Parliament House)
|
20,371
|
19,533
|
19,374
|
|
Scope 3
|
Indirect emissions, meaning emissions generated during the delivery of electricity, gas and fuel to Parliament House, over which DPS has little control
|
4,665
|
4,473
|
3,627
|
|
Scopes 1 and 2 total
|
DPS has direct responsibility for these emissions
|
23,055
|
22,081
|
21,878
|
|
Total net emissions (Scopes 1, 2 and 3)
|
Direct and indirect emissions including offsets
|
27,720
|
26,554
|
25,505
|
Figure 22: Annual greenhouse gas emissions from electricty and gas, and carbon savings from purchase of accredited green power and on-site solar panels.
Emission reductions from recycling
In 2014–15, DPS diverted 67 tonnes of organic food waste from landfill to a local recycling facility—equivalent to reducing lifetime landfill CO2 emissions by 107 tonnes.21
Ozone-depleting substances
Parliament House uses refrigerants that contain ozone-depleting substances. These are used for chillers, cool rooms and refrigerators. DPS is reducing the requirement for ozone-depleting gases through timely replacement of older equipment with equipment that uses environmentally safer refrigerants.
In 2014–15, all refrigerants purchased were free of ozone depleting substances.
Air pollutants
The combustion of natural gas at Parliament House for heating, hot water and cooking purposes generates oxides of nitrogen (NOx), oxides of sulphur (SOx) and other air pollutants. DPS reports annually on these emissions to the National Pollution Inventory (www.npi.gov.au).
Discharges to water
Sewage from Parliament House is required, under a trade waste agreement, to be equivalent to domestic strength (a domestic equivalent is a concentration or level the same as would be found in household waste water). To ensure these requirements are met, the following facilities are in place:
- a grease trap on each kitchen drain
- a coalescing plate filter on the vehicle wash-down bay (to prevent oil from entering the sewer)
- a system to remove paint solids from paint brush washing facilities before they enter the sewer.
Significant spills of chemicals, oils and fuels
In 2014–15, there were no significant spills of chemicals, oils or fuels from Parliament House.
21Conversion factor equals 1.6 tonnes CO2 per tonne of solid food waste—National Greenhouse Accounts (NGA) Factors (2013–14).
Appendix B: Advertising and market research
In accordance with Section 311A of the Commonwealth Electoral Act 1918, DPS annually reports expenditure on advertising and market research. Expenditure by DPS in 2014–15 was as follows:
Table 47: Advertising costs
|
Description
|
Cost (GST exclusive) 2014–15
|
|
Dentsu Mitchell
|
$29,864.43
|
|
Adcorp Australia Pty Ltd
|
$314.80
|
|
Australian Public Service Commission
|
$11,245.00
|
|
National Capital Educational Tourism Project
|
$1,000.00
|
During 2014–15, DPS did not conduct any government advertising campaigns.
Appendix C: Legal services expenditure
Table 48: Legal services expenditure
|
Description
|
cost (excluding GST) 2014–15
|
|
Total external legal services expenditure
|
$263,406.75
|
|
Total internal legal services expenditure
|
$616,522.64
|
|
Total legal services expenditure
|
$879,929.39
|
Appendix D: Disability reporting
Since 1994, Commonwealth departments and agencies have reported on their performance as policy adviser, purchaser, employer, regulator and provider under the Commonwealth Disability Strategy.
In 2007–08, reporting on the employer role was transferred to the Australian Public Service Commission’s State of the Service Report and the APS Statistical Bulletin. These reports are available at http://www.apsc.gov.au/. From 2010–11, departments and agencies have no longer been required to report on these functions.
The Commonwealth Disability Strategy has been superseded by the National Disability Strategy 2010–2020, which sets out a 10-year national policy framework to improve the lives of people with disability, promote participation and create a more inclusive society. The National Disability Strategy 2010–2020 can be found at www.dss.gov.au.
Appendix E: Correction of material errors in previous annual report
Inside front cover, Image caption
Should read ‘Courtesy of the artist, Anne Zahalka’ and not ‘Parliament House Art Collection’.
Page 78, Image caption
Should read ‘Parliamentary Library Collection’ and not ‘Parliament House Art Collection’.
Pages 158, 242 and 262, Image captions
Should read ‘Courtesy of the artist, Anne Zahalka’ and not ‘Parliament House Art Collection’.