Sustainability
Sustainability reporting pilot and the Global Reporting Initiative
Sustainability reporting involves the expansion of traditional reporting to include all aspects of an organisation's economic, environmental, social and governance performance. DPS is pleased to have participated, together with a small number of other agencies, in the sustainability reporting framework pilot for both the 2011–12 and 2012–13 reporting periods. DPS was selected for the pilot as an agency that was already using the Global Reporting Initiative (GRI) to report environmental performance. The GRI framework uses an internationally-developed set of environmental indicators to measure performance. Information about the GRI is available at www.globalreporting.org.
Summary of performance
Table 5.1 is a summary of economic, employment and environmental data collected by DPS for 2012–13. Detailed explanations about DPS's performance in these areas are included in the relevant sections of the report.
Table 5.1—Summary of performance
|
Indicator
|
2011–12
Result
|
2012–13
Result
|
|
Economic15
|
|
Operating Statement
|
|
Total expenditure
|
$132.364m
|
$136.902m
|
|
Total own source income
|
$6.560m
|
$6.964m
|
|
Total net cost of service
|
$125.804m
|
$129.938m
|
|
Economic Viability
|
|
Total assets
|
$144.087m
|
$131.130m
|
|
Total liabilities
|
$26.162m
|
$28.983m
|
|
Employment
|
|
Number of staff employed
|
848
|
832
|
|
Total employee expenditure
|
$66.668m
|
$67.809m
|
|
The diversity of the workforce16
|
|
Women (% of the total workforce)
|
37.97%
|
38.22%
|
|
People with a disability (% of total workforce)16
|
0.24%
|
0.36%
|
|
Aboriginal and Torres Strait Islander (% of total workforce)16
|
0.59%
|
0.48%
|
|
Staff with English as a second language (% of total workforce)16
|
8.73%
|
8.53%
|
|
Staff health and wellbeing
|
|
Work health and safety (WHS) incident reports
|
74
|
65
|
|
Number of health and safety representatives
|
28
|
25
|
|
Training and education
|
|
Percentage of staff undertaking supported studies
|
4.36%
|
3.73%
|
Table 5.1—Summary of performance (continued)
|
Indicator
|
2011–12
Result
|
2012–13
Result
|
|
Environmental
|
|
Office energy use17
|
|
Total office tenant light and power electricity consumption (kWh)
|
N/A
|
See footnote
|
|
Total office tenant light and power energy consumption (MJ)
|
N/A
|
See footnote
|
|
Office tenant light and power energy use per FTE (MJ/FTE)
|
N/A
|
See footnote
|
|
Office tenant light and power energy use per square metre (MJ/m2)
|
N/A
|
See footnote
|
|
Base/central building energy consumption (MJ)18
|
139,349,046
|
142,225,999
|
|
Base/central building energy consumption per square metre (MJ/m2)
|
917
|
936
|
|
Greenhouse emissions attributed to office tenant light and power and base/central building energy use (T CO2e)
|
27,17719
|
27,643
|
|
Green power purchased (kWh)20
|
2,554,263
|
2,599,926
|
|
Vehicle fleet21
|
|
Total number of fleet vehicles
|
33
|
15
|
|
Average green vehicle rating of fleet
|
10.97
|
10.90
|
|
Total fuel purchased (kL)
|
48.1
|
18.6
|
|
Total distance travelled (km)
|
450,752
|
180,537
|
|
Average fuel consumption of fleet vehicles (l/100km)
|
11.39
|
10.31
|
|
Total direct greenhouse emissions of fleet (T CO2e)
|
107.96
|
44
|
Table 5.1—Summary of performance (continued)
|
Indicator
|
2011–12
Result
|
2012–13
Result
|
|
Greenhouse Emissions
|
|
Total greenhouse emissions (T CO2e)
|
27,264
|
27,720
|
|
Total greenhouse emissions per FTE (T CO2e/FTE)
|
23.46
|
26.27
|
|
Air Travel22
|
|
Total number of flights
|
2,622
|
785
|
|
Total distance of flights (km)
|
2,628,009
|
580,464
|
|
Potable water consumption
|
|
Total potable water use (kL)
|
156,853
|
204,547
|
|
Potable water use per FTE (kL/FTE)23
|
134.99
|
197.52
|
|
Potable water use per square metre (kL/m2)
|
1.03
|
1.35
|
|
Resource efficiency and waste
|
|
Office paper purchased by FTE (A4 reams/FTE)
|
20.10
|
4.9622
|
|
Percentage of office paper purchased with recycled content
|
61%
|
96%22
|
|
Office paper recycled (tonnes)24
|
279
|
249
|
|
Total waste produced (tonnes)25
|
72126
|
621
|
|
Total waste produced per FTE (Kg/FTE)
|
0.6226
|
0.60
|
|
Percentage of waste diverted from landfill
|
44%
|
53%
|
Governance
Introduction
The President of the Senate and the Speaker of the House of Representatives have joint powers in relation to DPS that are similar, but not identical, to those of a Minister administering an executive department. Parliamentary departments are distinct from government departments, in that they serve the Parliament, not the Government, and operate under the Parliamentary Service Act 1999 (the Act), not the Public Service Act 1999. The Presiding Officers are assisted by the Joint House Committee, the Joint Standing Committee on the Parliamentary Library (parliamentary committees), and the Security Management Board, the Heritage Advisory Board, the Parliamentary Information and Communication Technology Advisory Board and the Art Advisory Committee. The role of each of these committees is outlined below.
Committees advising the Presiding Officers
Joint House Committee
The Joint House Committee (JHC) is comprised of the members of the House Committees of the Senate and the House of Representatives. Members of those committees are appointed under Senate Standing Order 21 and House of Representatives Standing Order 218 respectively. Currently, when these two committees meet jointly as the Joint House Committee, the senior Presiding Officer is the Chair.
The joint committee first met on Wednesday 26 June 1901, at which time it was resolved that the JHC would take over responsibility for various maintenance and facilities services (at that time, located in the Victorian Parliament House, Melbourne) and 'such other matters as tend to the convenience of Members of Parliament'. Under current standing orders, the respective House committees may consider any matter relating to the provision of facilities in Parliament House referred to it by that chamber or its Presiding Officer.
Membership of the JHC at 30 June 2013 was:
Senator the Hon. John Hogg (Chair)
Ms Anna Burke MP
Senator the Hon. Bill Heffernan
Senator Anne McEwen
Senator Stephen Parry
Senator Glenn Sterle
The Hon. Warren Entsch MP
The Hon. Joel Fitzgibbon MP
Mr Steve Georganas MP
Mr Chris Hayes MP
Mr Ewen Jones MP
Mr Michael McCormack MP
The JHC met three times in 2012–13 and considered a range of issues, including:
- Review of ICT in Parliament House;
- the Senate Inquiry into the Performance of DPS;
- DPS's Budget;
- parking in the Parliamentary Precincts;
- the electricity contract;
- water costs;
- Security staff;
- Health and Recreation Centre opening hours; and
- airconditioning settings throughout Parliament House.
Joint Standing Committee on the Parliamentary Library
Information about the role and functions of the Joint Standing Committee on the Parliamentary Library, including its terms of reference, can be found under the heading 'Joint Standing Committee on the Parliamentary Library' in Part 4 of this report.
Parliamentary Information and Communication Technology Advisory Board
The Parliamentary ICT Advisory Board (PICTAB) was established from a recommendation of the Roche Report to oversee the development and progress of the parliamentary ICT Strategic Plan and to provide guidance to the CIO on strategic objectives and outcomes.
The Board consists of eight representatives from the following:
- Department of Parliamentary Services (chair);
- Government;
- Opposition;
- Minor party/independent;
- Department of the Senate;
- Department of the House of Representatives;
- Parliamentary Budget Office; and
- Parliamentary Service Commissioner.
PICTAB met four times in 2012–13.
Art Advisory Committee
The Art Advisory Committee (AAC) assists the Presiding Officers in selecting artworks for the Parliament House Art Collection (PHAC) that express the diversity of cultures, character and identities in Australia. Members of the AAC are:
- the Presiding Officers;
- the Deputy President;
- the Deputy Speaker; and
- the Secretary, DPS.
AAC meetings are also attended by an independent art adviser from the National Gallery of Australia. The AAC's terms of reference are to:
- provide guidance on the Rotational Collection Acquisition Policy, and set short-term priorities for acquisitions;
- assess acquisition proposals in accordance with the acquisition policy and priorities; and
- provide advice on other matters relating to the display and management of artworks in the PHAC as considered necessary by the Presiding Officers.
The AAC met once during 2012–13.
Heritage Advisory Board
The Parliament House Heritage Advisory Board (HAB) was established by the Presiding Officers on 23 November 2011. The primary function of the Board is to provide advice to the Presiding Officers on the heritage management of Parliament House.
Membership of the HAB is as follows:
- the Secretary, DPS (Chair);
- the Usher of the Black Rod; and
- the Serjeant-at-Arms.
The HAB met eight times during 2012–13. The HAB agreed that a Conservation Management Plan (CMP) for Parliament House be developed and a submission was made to the Presiding Officers who supported the recommendation. The preparation of a companion document of Design Principles was also endorsed. This document will become a permanent record of the core concepts and principles that informed and guided the design of Parliament House.
The HAB also endorsed the establishment of an independent Expert Advisory Panel (EAP) to help guide the preparation of the Design Principles and CMP, using a best practice approach to ensure that a practical document is prepared that will retain the heritage significance of the building while managing change. The first meeting of the EAP is planned for July 2013.
The HAB discussed a range of cross-cutting issues, including agreement for the two chamber departments and DPS to work to establish common policies for the management of assets and items of heritage and cultural significance.
Security Management Board
The Security Management Board (SMB) was established pursuant to section 65A of the Act. The function of the SMB is to provide advice to the Presiding Officers on security policy, and the management of security measures, for Parliament House.
Membership of the SMB is as follows:
- the Secretary. DPS (Chair);
- the Usher of the Black Rod; and
- the Serjeant-at-Arms.
The Assistant Parliamentary Budget Officer (on behalf of the Parliamentary Budget Officer) was also a member of the SMB from 2 August 2012 to 29 June 2013 when the Act was amended to remove the requirement for the Parliamentary Budget Officer to be represented.
DPS committees
Executive Committee
The Secretary is assisted in the management of the department by the Executive Committee, which in 2012–13 comprised the Parliamentary Librarian and members of the senior Executive staff. The committee considers the development and implementation of the DPS governance framework and associated processes, including financial planning and budgeting, performance, risk management, business planning and organisation issues.
Audit Committee
The DPS Audit Committee's objective is to provide independent assurance and assistance to the Secretary on DPS's risk, control and compliance framework, and on its financial statements responsibilities.
The independent Chair of the Audit Committee, Mr William Laurie, retired from the committee in December 2012. An appropriate replacement was sought, and Mr Michael Harris assumed the duties of Committee Chair in July 2013.
To further strengthen the committee, a second independent member, Mr Darren Box, was appointed in June 2013.
During 2012–13, the following DPS employees served as management appointments to the Audit Committee:
- Mr David Kenny (Deputy Secretary), until September 2012;
- Dr Dianne Heriot (Parliamentary Librarian), whose existing appointment was renewed in February 2012;
- Ms Eija Seittenranta (Chief Information Officer), who was appointed in April 2013;
- Ms Karen Greening (Assistant Secretary, Content Management Branch), who was appointed in November 2012;
- Ms Bronwyn Graham (Assistant Secretary, Building Services Branch), until October 2012; and
- Ms Judy Tahapehi (Director, Strategy and Communication), until February 2013.
Representatives of the Australian National Audit Office and DPS's contracted internal auditors attend Audit Committee meetings, providing information and advice to committee members. The contract for provision of internal audit services was tendered in 2012–13, and the successful tenderer—KPMG—commenced in March 2013.
Seven internal audits were considered by the committee during 2012–13, covering a range of DPS systems, management and governance processes. A full list of internal audits considered by the Committee is provided at table 5.2.
Table 5.2—Internal audits considered by the Audit Committee in 2012–13
|
Audit Title
|
|
HR Workforce Planning and Recruitment
|
|
Follow-up review of internal audit implementations
|
|
DPS IT security review
|
|
Financial processing review
|
|
Financial processing—fringe benefits tax
|
|
Asset stocktakes
|
|
Follow-up review of major procurement and tendering
|
Audits conducted during the reporting year made a number of recommendations directed at enhancing efficiency and effectiveness. The committee monitors implementation of the recommendations.
The DPS Audit Committee normally meets once each quarter, with an additional meeting to consider DPS financial statements. In 2012–13, the committee met three times, with the retirement of the chair in December 2012 suspending normal operations pending the appointments of the new chair and additional independent member. Member attendance at meetings in 2012–13 is set out in table 5.3.
Other governance matters
Risk management
DPS participated in the Comcover 2013 Risk Management Benchmarking Survey, which measured risk management maturity across ten elements. DPS met or exceeded its nominated target level for most elements, achieving a maturity level of 'Top Down' 27. The Top Down rating is a strong result achieved during a period of substantial structural change, and means the following characteristics are demonstrable across the department:
- The DPS risk management strategy and policy is established and understood across the department;
- The DPS risk policy has clear links to strategic objectives and operational business plans, articulating accountability for managing risk;
- DPS's risk appetite and tolerance level is clearly defined, and guidance is communicated to staff enabling an understanding of departmental risk limits as well as processes for assessing and managing risk; and
- DPS has a formal governance structure and process for the assessment and approval of risks associated with the development of new polices, programs and/or services.
Table 5.3—Audit Committee attendance
|
Member
|
Position
|
Meeting attendance
|
|
attended
|
out of
|
|
Mr Will Laurie
|
External Chair
|
3
|
3
|
|
Mr David Kenny
|
Deputy Secretary
|
2
|
2
|
|
Dr Dianne Heriot
|
Parliamentary Librarian
|
2
|
3
|
|
Ms Eija Seittenranta
|
Chief Information Officer
|
0
|
0
|
|
Ms Bronwyn Graham
|
Assistant Secretary, Building Services Branch
|
1
|
2
|
|
Ms Karen Greening
|
Assistant Secretary, Content Management Branch
|
1
|
1
|
|
Ms Judy Tahapehi
|
Director, Strategy and Communication
|
3
|
3
|
|
Mr Darren Box
|
Independent Member
|
0
|
0
|
Areas of improvement identified in the survey include:
- Business Continuity and Disaster Recovery;
- Risk Profiling and Reporting; and
- Resourcing.
Table 5.4 shows the summary of scores since 2010 and the 2013 Maturity levels.
The reduced rating in 2013 reflected the rate and scope of organisational change.
Risk assessments continued to be carried out in 2012–13 at the request of Branches, including a risk assessment on the degradation of the Verde Issorie cladding on the outside of the building and a fraud risk assessment.
DPS also continued to provide risk management training in 2012–13. Risk Management Fundamentals workshops for DPS staff were held in September 2012 and May 2013.
Heritage management
DPS's Heritage team has provided advice on refurbishments within the building, to internal stakeholders, and on moral rights considerations. It continues to undertake heritage assessments of significant Parliament House items as well as items planned for disposal. The Heritage team assisted in creating Australia's Parliament House—more than 25 years in the making! chronology that celebrates milestones in the Parliament, and gave presentations to university students, scholars and visiting dignitaries throughout the year. Independent external heritage expertise was also sought to assist DPS in developing policy and processes for heritage management.
DPS has increased its heritage capabilities and expertise, with a new position, Director Heritage, appointed in April 2013. The Director Heritage has formal training and a depth of experience in cultural heritage management.
For information about the Heritage Advisory Board and the Expert Advisory Panel, see the section 'Committees advising the Presiding Officers' in this Part.
Table 5.4—Summary of Scores and Maturity Levels—Comcover Risk Management Survey
|
Survey Item
|
2010 Score
|
2011 Score
|
2012 Score
|
2013 Score
|
2013 Maturity
|
|
Department of Parliamentary Services result
|
5.9
|
7.0
|
7.2
|
6.7
|
Top Down
|
|
Total Population Average result
|
6.3
|
6.4
|
6.6
|
6.8
|
Top Down
|
|
Individual Peer Group Average result
|
6.0
|
5.9
|
6.4
|
6.7
|
Top Down
|
|
Community of Practice Average result
|
N/A
|
6.5
|
6.6
|
6.5
|
Top Down
|
|
Self-Selected Peer Group Average result
|
N/A
|
6.7
|
6.9
|
7.1
|
Structured
|
Fraud control
During 2012–13, DPS undertook a fraud risk assessment and prepared a new Fraud Control Plan that includes the content required by the Commonwealth Fraud Control Guidelines. The fraud risk assessment is being reviewed to ensure it reflects the current fraud risk profile.
In 2012–13, two reports of suspected fraud were made to the DPS Executive. One report concerned falsification of records while the other related to theft and falsification of documentation. These matters are the subject of investigation.
Ethics
Ethical matters arose out of evidence given by DPS to the Senate Finance and Public Administration Committee in 2011–12 regarding disposal of assets. DPS addressed these issues by instigating a Code of Conduct investigation and a review into disposal processes. DPS has taken steps to ensure that all future information provided to the Committee is accurate and comprehensive.
The Finance and Public Administration Committee also raised other issues with DPS such as alleged bullying and harassment and selection processes within DPS. DPS has in place policies, procedures and a structure to mitigate these issues. Bullying and harassment prevention measures are detailed below.
The DPS Audit Committee assists the Executive in its monitoring of ethical standards with an annual ethics 'health check'.
As a consequence of the Finance and Public Administration Committee's inquiry into the performance of DPS, Comcare undertook a bullying and harassment audit of DPS. The audit provided a number of recommendations.
In response to the audit, DPS has implemented a range of measures to address bullying and harassment, including:
- conducting risk assessments for the prevention of bullying across DPS;
- implementing control measures to effectively and practicably eliminate or minimise the potential for any workplace bullying identified in risk assessments;
- reminding staff that DPS funds an Employee Assistance Program (EAP) through Davidson Trahaire Corpsych;
- encouraging supervisors and managers to make use of the ManagerAssist service offered through the EAP; and
- revamping and significantly increasing the department's Harassment Contact Officer (HCO) network (by a factor of around 3) to provide employees with better access to HCOs at a variety of levels—and in most areas—of DPS.
Employees also attend training programs every two years that are specifically related to bullying and harassment, professionalism in the Parliamentary Service, and Fraud and Ethics Awareness training. In 2012–13, 353 attendances were recorded for these training programs.
Corporate Plan
The DPS Corporate Plan confirms a new mission, key result areas, signposts of success, priorities and how we work as a Department to achieve our results. The plan is shown at figure 7 and is publicly available on the Parliament House website.
Business Continuity Management
In order to ensure continuity of services to its clients, DPS has identified 20 critical services that are listed under the following three major areas of impact:
- services to the Parliament;
- services relating to the building; and
- services to support DPS activities.
Each has a plan that identifies what arrangements will be put in place in the event of an interruption to business.
During 2012–13, a high-level business continuity plan, outlining the arrangements for dealing with an incident or incidents that affect the ability of DPS to provide normal services, was approved and made available to all staff via the DPS Intranet.
Fraud control certification text description
Figure 7—DPS Corporate Plan 2012–14
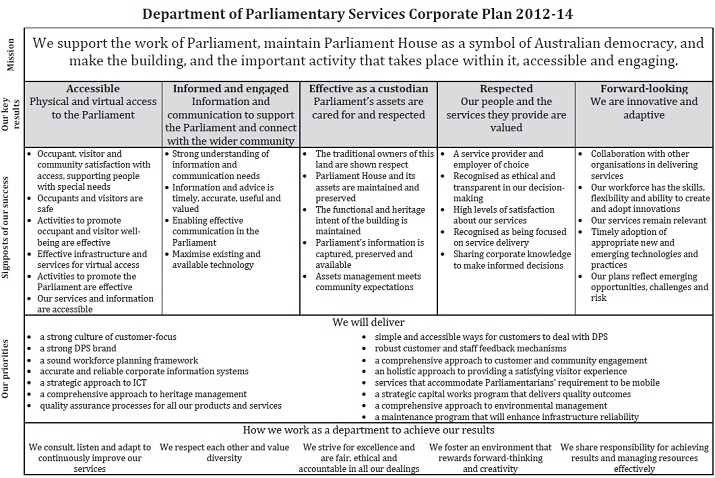
DPS Corporate Plan text description
HR Services
Staffing, salary and classification structures
Remuneration for Senior Executive Service (SES) employees
The remuneration and other conditions of service for SES employees are governed by a determination made pursuant to section 24 of the Act. The level of remuneration and, in some instances, the conditions attaching to remuneration varies. In general terms, salary increases provided to SES employees depend upon a rating of 'effective' or higher as assessed through the SES performance management arrangements. Table 5.5 sets out the base salary ranges for SES employees.
The remuneration of the Secretary and the Parliamentary Librarian is set by the Presiding Officers after consultation with the Remuneration Tribunal.
Performance-based salary advancement for non-SES staff
For non-SES staff, salary advancement is based on performance assessment as required by the Department of Parliamentary Services Enterprise Agreement 2011 (the Agreement).
The Agreement provides for salary advancement within a salary range subject to the achievement of an overall rating of 'effective' or higher through the performance management arrangements.
In 2012–13, a total of 682 DPS employees (82 per cent) participated in performance reviews and career development feedback.
Salary increases under the enterprise agreement
A salary increase of 3 per cent was paid on 1 July 2012, as allowed for under the Agreement.
Table 5.5—Base SES salary ranges as at 30 June 2013
|
SES Level
|
Non-total remuneration package
|
Total remuneration package
|
|
Band 1
|
$155,750 – $179,510
|
$206,420 – $233,580
|
|
Band 2
|
|
$256,000 – $296,960
|
Overview of classification structures
Table 5.6 sets out the non-SES classifications and salary ranges for DPS staff as at 30 June 2013.
Staff progress annually through the salary range in 3.5 per cent increments, subject to effective performance.
Table 5.7 sets out staff numbers (headcount) as at 30 June 2013. Staff numbers include inoperative staff, ie those on more than 12 weeks' leave without pay from DPS.
Management of human resources
Introduction
During 2012–13, the HR Services Section (HRS) developed a series of strategies to improve workplace behaviour and conduct, complaints management and recruitment. All the actions resulting from the strategies are being monitored and reported monthly to the DPS Executive, and will continue to be the focus in the new financial year.
HRS also recruited 35 staff to establish the new Parliamentary Budget Office (PBO) by May 2013. HRS also provided advice to the PBO on workplace relations and WHS matters.
Workforce planning, staff retention and turnover
DPS Workforce composition
The DPS workforce headcount figure reduced by 16 employees during 2012–13. At 30 June 2013, there were 832 employees, compared with 848 at June 2012.
Table 5.6—Classification and salary ranges as at 30 June 2013
|
Classification
|
Salary range
|
|
Parliamentary Service Level 1
|
$46,097 – $53,687
|
|
Parliamentary Service Level 2
|
$54,762 – $58,789
|
|
Parliamentary Service Level 3
|
$60,097 – $62,801
|
|
Parliamentary Service Level 4
|
$64,056 – $69,605
|
|
Parliamentary Service Level 5
|
$70,996 – $76,167
|
|
Parliamentary Service Level 6
|
$77,690 – $87,317
|
|
Parliamentary Executive Level 1
|
$94,543 – $107,944
|
|
Parliamentary Executive Level 2
|
$110,102 – $130,553
|
Table 5.7—Staff numbers at classification level as at 30 June 2012
|
Classification
|
Ongoing
Full Time
|
Ongoing
Part Time
|
Non-Ongoing Full Time
|
Non-Ongoing Part Time
|
Casual
|
Total
|
|
F
|
M
|
F
|
M
|
F
|
M
|
F
|
M
|
F
|
M
|
F
|
M
|
Total
|
|
Apprentice 1/2
|
|
|
|
|
|
1
|
|
|
|
|
0
|
1
|
1
|
|
Apprentice 2/3
|
|
|
|
|
|
|
|
|
|
|
0
|
0
|
0
|
|
PSL1/2
|
8
|
68
|
6
|
27
|
|
|
|
|
|
29
|
14
|
124
|
138
|
|
PSL1/2/3
|
|
4
|
|
|
|
|
|
|
|
|
0
|
4
|
4
|
|
PSL2/3
|
|
28
|
|
|
|
1
|
|
1
|
|
|
0
|
30
|
30
|
|
PSL4/5
|
5
|
5
|
2
|
|
|
|
1
|
|
|
|
8
|
5
|
13
|
|
PSL5/6
|
18
|
11
|
18
|
6
|
|
|
|
|
3
|
|
39
|
17
|
56
|
|
PSL1
|
1
|
9
|
|
|
|
|
|
|
7
|
4
|
8
|
13
|
21
|
|
PSL2
|
12
|
15
|
19
|
8
|
|
1
|
1
|
3
|
3
|
6
|
35
|
33
|
68
|
|
PSL3
|
14
|
26
|
4
|
|
1
|
|
|
|
14
|
6
|
33
|
32
|
65
|
|
PSL4
|
26
|
47
|
7
|
4
|
2
|
3
|
|
1
|
4
|
8
|
39
|
63
|
102
|
|
PSL5
|
10
|
35
|
7
|
1
|
|
1
|
|
|
1
|
|
18
|
37
|
55
|
|
PSL6
|
23
|
57
|
8
|
3
|
3
|
2
|
1
|
|
4
|
|
39
|
62
|
101
|
|
PEL1
|
40
|
55
|
12
|
3
|
3
|
3
|
1
|
2
|
|
1
|
56
|
64
|
120
|
|
PEL2
|
19
|
23
|
1
|
|
|
2
|
|
|
|
1
|
20
|
26
|
46
|
|
SES 1
|
5
|
3
|
|
|
1
|
|
|
|
|
|
6
|
3
|
9
|
|
SES 2
|
1
|
|
|
|
|
|
|
|
|
|
1
|
0
|
1
|
|
Parliamentary Librarian
|
1
|
|
|
|
|
|
|
|
|
|
1
|
0
|
1
|
|
Secretary
|
1
|
|
|
|
|
|
|
|
|
|
1
|
0
|
1
|
|
Total
|
184
|
386
|
84
|
52
|
10
|
14
|
4
|
7
|
36
|
55
|
318
|
514
|
832
|
Of the 832 employees, 706 were ongoing and 126 non-ongoing. Ongoing employment accounts for 85 per cent of total DPS employment, non-ongoing workforce accounts for 15 per cent. Non-ongoing employees are engaged for irregular or intermittent duties (11 per cent) or for a specified term (4 per cent) to accommodate the sitting patterns of the Parliament.
In 2012–13, men comprised 62 per cent of the workforce and women 38 per cent. There was no change in gender representation from the preceding year.
Employee Separations
There were 112 employee separations during 2012–13, a decrease from the 133 separations in the previous year. The overall separation rate from DPS was 13.5 per cent, down 2.2 per cent from 15.7 per cent during 2011–12.
The strongest growth in separations was in the cessation of temporary employment contracts which increased from 20 per cent in 2011–12 to 30 per cent in 2012–13. Resignations fell from 28 per cent to 23 per cent this year; as did age retirements (which fell from 19 per cent to 15 per cent) and redundancy retirements (which fell from 17 per cent to 16 per cent). Promotions/transfers accounted for 13 per cent of separations. There was one invalidity retirement and one termination of employment in 2012–13.
Employees aged 55 years and over (29 per cent) represented the highest proportion of employee separations, followed by 45-54 years (24 per cent), 25-34 years (21 per cent), 35–44 years (17 per cent); and under 25 years (9 per cent). Those employees aged 55 years and over primarily separated through age retirement (17 employees—52 per cent), redundancy retirements (7 employees—21 per cent) and end of contracts (7 employees—21 per cent).
There were 18 redundancy retirements during 2012–13.
Men accounted for 60 per cent of the total staff separation from DPS during 2012–13, up from 50 per cent in the previous year.
Table 5.8 shows employee separation by age and gender
Table 5.9 shows the total DPS staff separation figures since 2010–11.
Table 5.8—Employee separation by age and gender
|
Age Group
|
Female
|
Male
|
Total
|
|
Under 25 years
|
3
|
7
|
10
|
|
25–34 years
|
10
|
13
|
23
|
|
35–44 years
|
6
|
13
|
19
|
|
45–54 years
|
19
|
8
|
27
|
|
55 years & over
|
7
|
26
|
33
|
|
Total
|
45
|
67
|
112
|
|
% of workforce leaving by gender
|
40%
|
60%
|
|
Table 5.9—Staff retention and turnover statistics
|
2010–11
|
2011–12
|
2012–13
|
|
Staff numbers
|
847
|
848
|
832
|
|
Staff separations (total)
|
118
|
133
|
112
|
|
Turnover
|
14%
|
15.7%
|
13.5%
|
|
Separations By Type
|
|
Transfers/promotions
|
26
|
18
|
14
|
|
Resignations
|
38
|
37
|
26
|
|
Age retirements
|
17
|
25
|
17
|
|
Invalidity retirements
|
1
|
2
|
1
|
|
Voluntary redundancy retirements
|
11
|
23
|
18
|
|
Terminations
|
0
|
0
|
1
|
|
Death
|
0
|
1
|
0
|
|
End of temporary contract
|
24
|
27
|
34
|
|
End of temporary transfer
|
1
|
0
|
1
|
|
Exit Interviews
|
|
Interviews held
|
37
|
31
|
24
|
|
Participation rate
|
31%
|
23%
|
22%
|
Employee Commencements
During 2012–13, the total number of employee commencements decreased by 4.5 per cent, after increasing by 4.7 per cent in 2011–12. This year there were increases in employee headcount figures at the PSL3, PSL5, PSL6, PEL2 and SES1 and 2 classifications. A growth in leadership positions within DPS arose principally in response to Inquiry findings and the Roche Review on ICT.
The biggest reduction by section occurred in the Parliamentary Security Service (PSS), which had a 6 per cent net decrease (9 employees) in its PSL1–2 workforce. At the time of this report, DPS was undertaking a recruitment drive to recruit PSS PSL1–2s using the Australian Public Service Commission's Independent Selection Advisory Committee services.
There were 96 commencements in 2012–13, of which 30 were ongoing employees and 66 were non-ongoing employees.
As table 5.11 shows, commencement ages were broadly spread.
Women accounted for 47 per cent of recruitment, the same as last year's figures.
Tables 5.10 and 5.11 show employee commencements by year and age/gender respectively.
Recruitment
A program of recruitment process improvement activities was scoped for implementation in 2012–13 and 2013–14. These activities include reviewing current recruitment policy, guidelines and manual forms to reflect more contemporary public sector recruitment processes. It is anticipated that these improvement activities will streamline and improve recruitment, thus reducing the time taken to recruit staff. The proposed implementation of e-recruitment will further streamline the process and reduce time to recruit staff.
All DPS Selection Advisory Committee (SAC) members are now required to declare conflicts of interest prior to reviewing and short-listing individual applications and are required to attend training in staff selection. In 2012–13, thirty nine employees attended SAC training and new SAC refresher training was piloted in June 2013. This will be offered to DPS SAC members and other employees in 2013–14.
Staff development and training
HRS organises a range of corporate training in line with the DPS Corporate Learning Pathway. The pathway provides a distinctive developmental focus for leadership, management and employee responsibility training, and is integrated into DPS's induction, probation, performance management and career development processes.
Following the expiry of the DPS training services panel in March 2013, DPS joined the Department of Industry, Innovation, Science, Research and Tertiary Education multi-use service panel in April 2013.
Table 5.10—Staff commencements
|
2010–11
|
2011–12
|
2012–13
|
|
Commencements
|
96
|
136
|
96
|
|
Commencement rate
|
11.3%
|
16%
|
11.5%
|
Table 5.11—Staff commencements in 2012–13 by age/gender
|
Female
|
Male
|
Total
|
|
Under 25 years
|
7
|
6
|
13
|
|
25-34 years
|
7
|
17
|
24
|
|
35-44 years
|
7
|
14
|
21
|
|
45-54 years
|
16
|
5
|
21
|
|
55 years & over
|
8
|
9
|
17
|
|
Total
|
45
|
51
|
96
|
|
% of workforce recruited by gender
|
47%
|
53%
|
|
In 2012–13, HRS coordinated a total of 80 corporate training events, 17 more than in 2011–12. There was a total of 864 recorded attendances at these events.
Employee Responsibility training
In 2012–13, this training represented 84 per cent of all corporate training delivered. There were 727 recorded attendees, of which 220 attended WHS awareness training (both staff and supervisor level) and 215 attended bullying and harassment awareness training (both staff and supervisor level).
Leadership Development
Leadership development, targeting middle and senior level employees, remained a part of the DPS Corporate Learning Pathway. Development activities included the following courses:
- Building Team Leadership Skills for PSL4–PEL1s;
- Conversations that Count for PSL5-PEL2s;
- Results through People for PSL6–PEL2s;
- Managing for Improved Performance (PSL5–PEL2); and
- Maximising Staff Attendance (PSL5–PEL2).
A total of 40 employees in management and leadership roles attended corporately sponsored external leadership development training or utilised executive coaching services in 2012–13.
Thirty-four DPS PEL2 section leaders attended Appropriate Workplace Behaviour—The Role of Leaders half-day workshop in November 2012. Following an evaluation of this workshop a similar workshop was held for team leaders and managers in June 2013 with 28 employees at the PSL5–PEL1 classifications attending. This program is continuing in 2013–14.
Studies support
DPS provided studies assistance support for 31 employees in 2012–13. Support included time to attend study activities and exams, and financial assistance toward course costs and books.
Workplace relations
The DPS Consultative Forum, comprising representatives from management, staff and unions, met four times during 2012–13. The objectives of the Consultative Forum are to promote good workplace relations in DPS, improve mutual understanding between management and staff and provide a forum for consultation and open discussion aimed at resolving different points of view in a mutually acceptable manner.
DPS had one ongoing matter before the Fair Work Commission (FWC) during 2012–13 which was awaiting a decision by FWC.
Work health and safety
Work health and safety improvements to Parliament House
In 2012–13, DPS received additional administered funding to improve accessibility to Parliament House for people with a disability. Work included installation of hearing loops in committee rooms; purchase of several portable hearing loops; and purchase and installation of metal detectors which comply with the accessibility requirements of the Disability Discrimination Act 1992.
During 2012–13, DPS undertook a large number of risk assessments to improve chemical safety management across Parliament House and implemented systems to ensure that items of plant and equipment are appropriately maintained and licenced with Comcare.
Consultation within DPS on WHS issues
DPS maintains a high level of consultation on WHS issues. Staff are represented in formal joint management–worker health and safety committees that help monitor and advise on WHS programs.
The DPS Peak WHS Committee met four times during the year. The work of the committee is primarily directed at reviewing WHS policies and procedures and taking a strategic approach to WHS management across DPS.
Individual branches also hold branch WHS committee meetings on a quarterly basis, addressing WHS issues at the local level.
The DPS Contractors' WHS Subcommittee met four times. This forum provides a valuable mechanism to address WHS issues involving the work performed by the large number of contractors at Parliament House.
A key component of DPS's approach to health and safety is the Health and Safety Representatives (HSRs), Deputy HSRs and Harassment Contact Officers (HCOs) network. There are a total of 25 HSRs and Deputies within DPS, and 22 trained HCOs. Most notably, the number of HCOs has increased from nine in 2011–12 as part of DPS's commitment to promoting appropriate workplace behaviour and increasing the level of support available for its employees.
WHS training
A range of WHS-related training was provided to staff throughout the year, including generic induction and refresher sessions. Numbers of attendees have continued to increase over previous financial years. There were 66 staff who attended WHS for DPS Supervisors training (up from 56 in 2011–12), while 154 staff attended DPS WHS Awareness training (up from 63 in 2011–12). DPS also continued bullying and harassment prevention courses, which were attended by 104 supervisors (up from 43 in 2011–12) and 111 staff (up from 80 in 2011–12), while around 150 Parliamentary Security Service officers undertook WHS Awareness and Values, Conduct and Behaviour training as part of their annual revalidation training.
Importantly, DPS has made a concerted effort in 2012–13 to transition from a focus on the prevention of bullying and harassment to a focus on appropriate workplace behaviour. Two pilot programs delivered in 2012–13 were attended by 34 managers and 28 staff.
Occupation-specific WHS training was also provided, including:
- first aid;
- working in confined spaces;
- working at heights;
- manual handling;
- plant and equipment use;
- licences for forklifts and elevated work platforms; and
- defensive tactics.
WHS auditing
In 2012–13, DPS continued to undergo six-monthly surveillance audits of its WHS management system. An external audit found that DPS continued to comply with the requirements of the SafetyMAP Initial Level auditing tool. DPS has continued to maintain certification to Joint Accreditation System of Australia and New Zealand standards since initial certification in November 2009.
As a result of this significant achievement, DPS has agreed to work in partnership with Comcare in both the development of a National WHS Management System Audit Tool, and in promotion of the benefits associated with independent WHS auditing.
Incident reporting and investigation
A total of 65 incident reports were submitted by DPS employees during 2012–13. Two incidents were notified to Comcare in accordance with Section 35 of the Work Health and Safety Act 2011 (WHS Act). Both incidents were examined by DPS and remedial action was taken where necessary. Comcare did not conduct a formal investigation in relation to either reported incident.
There were no Provisional Improvement Notices issued under section 90 of the WHS Act and no notices or enforceable undertakings were issued under Parts 10 or 11 of the WHS Act. Table 5.12 shows the number of WHS incident reports and the number of WHS representatives.
Table 5.12—Staff health and wellbeing
|
Indicator
|
2010–11
|
2011–12
|
2012–13
|
|
Work Health and Safety (WHS) Incident Reports
|
71
|
74
|
65
|
|
Number of Health and Safety Representatives
|
27
|
28
|
25
|
Disability reporting mechanisms
Since 1994, Commonwealth departments and agencies have reported on their performance as policy adviser, purchaser, employer, regulator and provider under the Commonwealth Disability Strategy. In 2007–08, reporting on the employer role was transferred to the Australian Public Service Commission's (APSC) State of the Service Report and the APS Statistical Bulletin. These reports are available at
www.apsc.gov.au. It should be noted that DPS is not subject to the reporting requirements imposed by the Australian Public Service Commission in respect of the provision of data for the State of the Service Report or APS Statistical Bulletin. From 2010–11, departments and agencies were no longer required to report on these functions.
The Commonwealth Disability Strategy has been overtaken by a new National Disability Strategy which sets out a ten-year national policy framework for improving life for Australians with disability, their families and carers. A high-level report to track progress for people with disability at a national level will be produced by the Standing Council on Community, Housing and Disability Services to the Council of Australian Governments and will be available at www.fahcsia.gov.au. The Social Inclusion Measurement and Reporting Strategy agreed by the Government in December 2009 will also include some reporting on disability matters in its regular How Australia is Faring report and, if appropriate, in strategic change indicators in agency annual reports. More detail on social inclusion matters can be found at www.socialinclusion.gov.au.
Purchasing
Overview
Purchasing was managed in accordance with the Commonwealth Procurement Rules (CPRs) and DPS Chief Executive's Instructions (CEIs) and supporting procedures. DPS's primary purchasing objectives are:
- to ensure the principle of value for money is consistently applied through:
- encouraging competition;
- promoting efficient, effective, economical and ethical use of resources; and
- conducting our business in an environment of accountability and transparency;
- to support the business requirements of each branch within the department through a focus on better practice procurement; and
- to involve small-to-medium enterprises wherever practicable.
DPS has a dedicated procurement unit to facilitate and monitor contracting and tendering activity across the department.
Consultants
This report contains information about actual expenditure on contracts for consultancies. Information on the value of contracts and consultancies is available on the AusTender website www.tenders.gov.au.
Consultants are classified as individuals, partnerships or corporations engaged to provide professional, independent and expert advice or services to the department. DPS engages consultants where there is a need for independent research or assessment, or where specialised or professional skills not available in-house are required.
During 2012–13, 87 new consultancy contracts were entered into with total actual expenditure of $1,668,403 (GST inclusive). In addition, 18 ongoing consultancy contracts were active during the 2012–13 year, involving total actual expenditure of $602,575 (GST inclusive).
The largest group of new consultancies (49 per cent) was for engineering and architectural services. A further 10 per cent related to investigations, 9 per cent for management reviews, 7 per cent for financial and audit services, and 7 per cent for information technology and communication services. The remainder related to the provision of miscellaneous legal, procurement and other consultancy services.
DPS had standing offer panel arrangements for the following consultancy services in 2012–13:
- Architectural;
- Engineering; and
- Information Technology.
DPS also has access to consultancy panels and multi-user lists used by other departments and for Whole-of-Government coordinated procurements for the following:
- Legal;
- Human Resources; and
- Information Technology.
Competitive tendering and contracting
During 2012–13, DPS did not conduct any competitive tendering or contracting processes that involved contracting out to another organisation the delivery of activities previously performed by this department.
DPS did not allow provisions in contracts prohibiting the Auditor-General's access.
Exempt contracts
During 2012–13, no DPS contracts or standing offers were exempted by the Secretary from being published via AusTender on the basis that they would disclose exempt matters under the Freedom of Information Act 1982.
Asset Management
DPS provides asset management services to Parliament House, both for the building and for infrastructure supporting the delivery of other services to the Parliament.
Accountability
External Scrutiny
Australian National Audit Office (ANAO) Audits
During 2012–13, DPS was the subject of an external compliance audit by the ANAO in relation to its financial statements for the period ending 30 June 2012, and an interim audit in preparation for the 2012–13 financial statements audit. The audit on the 2011–12 financial statements was unqualified.
There were no other ANAO reports during 2012–13 that directly involved DPS.
Senate Committees
DPS appeared before Senate Finance and Public Administration Legislation Committee Estimates hearings on three occasions during 2012–13:
15 October 2012 (Supplementary Budget Estimates);
11 February 2013 (Additional Estimates); and
27 May 2013 (Budget Estimates).
On 23 June 2011, the Senate referred the performance of the Department of Parliamentary Services to the Senate Finance and Public Administration Legislation Committee for inquiry and report, with an interim report being tabled in June 2012 and the final report containing 23 recommendations being tabled in November 2012.
Other Scrutiny
DPS was not subject to any significant judicial decisions or decisions of administrative tribunals, nor did the Ombudsman report on the activities of DPS in 2012–13.
Freedom of information
On 9 May 2012, the Australian Information Commissioner (AIC) amended the guidelines issued under section 93A of the Freedom of Information Act 1982 (FOI Act) to state that the Department of the House of Representatives, the Department of the Senate and the Department of Parliamentary Services were subject to the FOI Act. Prior to this, the guidelines stated that the FOI Act did not apply to the departments of the Parliament. This change did not result from an amendment to the FOI Act or any other legislation.
The Parliament subsequently amended the Act to confirm the intention of Parliament that all parliamentary departments are excluded from the application of the FOI Act. DPS is excluded from the application of the FOI Act under section 68A of the Act—as are the Department of the House of Representatives and the Department of the Senate (the Parliamentary Budget Office is exempt from the application of the FOI Act under s7(1) and Division 1 of Part I of Schedule 2 of the FOI Act).
The effect of the amended Parliamentary Service legislation is that, from Friday 28 June 2013, the FOI Act is taken not to apply and not to have ever applied to the parliamentary departments and persons who hold, or perform duties of, an office established under the Act.
During 2012–13, DPS received 11 FOI requests. Of these:
- six requests were refused (DPS did not hold the information);
- one request was deemed withdrawn;
- one request had information partially provided and the remainder of the request was deemed withdrawn;
- two requests had the information provided; and
- one request had some information provided (after third-party consultation).
DPS continues to respond where it can to requests for information, within the spirit of the FOI Act. Further information is available at the Department of Parliamentary Services part of the APH website (www.aph.gov.au).
Discretionary grants
DPS does not administer any discretionary grant programs.
Advertising and market research
All Commonwealth departments and agencies are required, under section 311A of the Commonwealth Electoral Act 1918, to provide a statement setting out particulars of amounts paid to:
- advertising agencies;
- market research organisations;
- polling organisations;
- direct mail organisations; and
- media advertising organisations.
Table 5.13 sets out amounts over $12,100 (GST inclusive) paid by DPS during 2012–13. No money was paid to any organisation covered in paragraph (b), (c) or (d).
No advertising campaigns were undertaken by the department in 2012–13.
Table 5.13—Advertising costs
|
Supplier
|
Item
|
Amount (GST inclusive)
|
|
Adcorp Australia
|
Recruitment advertisements
|
$12,202
|
Legal services expenditure
The Legal Services Directions 2005 (paragraph 11.1(ba)) require FMA Act agencies to make their expenditure on legal services publicly available. Until early 2013, DPS had no in-house providers of legal services and therefore requirements for legal advice were outsourced. DPS set up a Legal Services section in February 2013.
For most of 2012–13, DPS sourced any external legal advice via a panel of legal service providers, using a Deed of Standing Offer put in place by DoFD. After this Deed of Standing Offer expired in early May 2013, DPS transferred to using the Legal Services Multi-Use List put in place by the Attorney-General's Department.
In 2012–13, DPS's legal services expenditure covered issues relating to workplace arrangements, public liability, disability access, moral rights, contracts and licences, freedom of information and legislative drafting.
Table 5.14 shows the amount DPS spent on legal services during 2012–13.
Table 5.14—Legal services expenditure
|
Services
|
Amount (GST inclusive)
|
|
External expenditure on professional fees
|
$86,042
|
|
Internal expenditure on legal services
|
$89,068
|
|
Administrative disbursements on external legal services
|
nil
|
|
Total (legal services expenditure—internal and external)
|
$175,110
|
Environment
Overview
DPS reports annually on elements of environmental performance in line with the Environment Protection and Biodiversity Conservation Act 1999 (EPBC Act) on its own behalf and on behalf of the other three parliamentary departments for elements under DPS management.
DPS also reports under:
- the Energy Efficiency in Government Operations (EEGO) policy;
- the National Environment Protection Measures (Implementation) Act 1998;
- the National Pollution Inventory (NPI); and
- the Australian Packaging Covenant (NPC).
Ecologically sustainable development
The objective of Ecologically Sustainable Development (ESD) is defined as 'development that improves the total quality of life, both now and in the future, in a way that maintains the ecological processes on which life depends'.
DPS reports annually on ESD through this report. Sub-program 1.3 in DPS PBS sets energy and water consumption, greenhouse gas emissions and recycling targets.
Identification, management and monitoring of environmental impacts
DPS aims to ensure that the vital functions of Parliament House operate effectively, while minimising resource consumption and waste production by:
- monitoring environmental performance;
- implementing programs and projects to improve environmental performance; and
- developing forward plans to improve environmental performance.
DPS works to improve outcomes in these areas in a number of ways. In 2012–13, actions included:
- replacement of equipment with more efficient technology;
- new software installed to monitor and track energy and water performance; and
- trial of an organic waste recycling scheme.
DPS also emphasises environmental improvements when undertaking the planning and delivery of infrastructure projects.
Project activities adhere to an environmental checklist that includes consideration of:
- whole-of-life principles;
- reuse and recycling of materials where possible; and
- energy, water and waste minimisation.
Communication and promotion
DPS provides information on its environmental performance and initiatives through its website, internal circulars and newsletters. (http://www.aph.gov.au/Visit_Parliament/About_the_Building/Environmental_Management).
DPS also participated in several activities to assist in educating building occupants on environmental initiatives in Parliament House, including promotion of the following:
- National Ride to Work Day;
- World Environment Day;
- National Recycling Week; and
- Earth Hour
In 2012–13, DPS hosted two significant site tours for international delegations to showcase important environmental aspects of Parliament House and its operations, including:
- US delegates for the 'Australian Alliance to Save Energy Summer Study'; and
- United Nations Development Programme (UNDP) 'Pacific Parliaments Climate Change Study'.
Environmental performance
Water consumption
Total water consumption for 2012–13 was 204,547kL representing an increase of 30 per cent on 156,853kL consumed the previous year.
Landscape water consumption increased from 69,015kL in 2011–12 to 113,114kL in 2012–13, representing an increase of 64 per cent. The landscape water increase came as a result of very dry weather between December 2012 and February 2013 when water evaporation levels were 2.7 times higher than the previous year, requiring a large quantity of replacement water in turfed areas.
Figure 8 shows a breakdown of water use during 2012–13.
Building water consumption in 2012–13 was 91,433kL, an increase of 4 per cent on 87,748kL consumed the previous year. The increase was mainly attributable to a water leakage in the forecourt pond. DPS has installed a 45,000-litre tank below the Forecourt pond to capture the majority of leaking water and is seeking further specialist advice on actions required to rectify the leakage.
To reduce potable water use, the Forecourt pond is partly supplied with recycled water discarded by the cooling tower as a result of a water efficiency project completed in 2010.
Energy
In 2012–13, energy improvement initiatives included:
- upgrades to lighting systems;
- optimisation of heating and cooling equipment; and
- installation of energy monitoring software
In 2012–13, building energy use was 142,226 GJ, representing an increase of 2 per cent from the previous year. Electricity consumption increased by 1.6 per cent and natural gas consumption increased by 2.4 per cent from 2011–12. Table 5.15 shows energy consumption at Parliament House and by DPS vehicles.
Gas is used for heating, general hot water and in kitchens. Electricity powers a variety of services including office lighting, mechanical services, lifts, chillers, computer equipment and boosted hot water heating. Building energy consumption includes of a small amount of diesel used for testing the emergency backup generators.
Figure 8—Water use during 2012–13
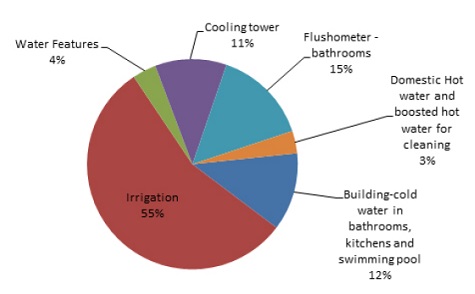
Water use during text description
Table 5.15—Energy consumed at Parliament House and by transport
|
Indicator
|
Energy Consumption (GJ)
|
|
2010–11
|
2011–12
|
2012–13
|
|
Parliament House building28
|
139,595
|
139,56329
|
142,226
|
|
Passenger vehicles
|
1,694
|
1,625
|
64430
|
|
Other transport31
|
377
|
441
|
424
|
|
Total energy consumption
|
141,665
|
141,629
|
143,294
|
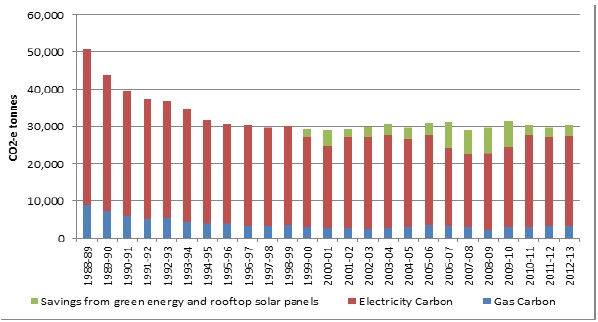
Figure 9 shows annual electricity and gas consumption since 1988.
Energy consumption trends
Although energy efficiency projects are ongoing, Parliament House energy consumption has been gradually increasing each year as a result of:
- building operational requirements;
- pressures on space; and
- competing priorities within the DPS budget to effect significant new improvements.
Figure 9—Annual electricity and gas consumption
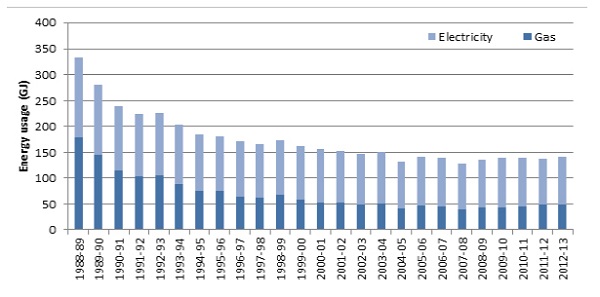
Annual electricity and gas consumption text description
Energy-saving initiatives
Lighting
During 2012–13, lighting efficiency projects included:
- ongoing upgrade of corridor and general circulation lighting to more energy-efficient lighting—some 600 lights (equal to 20 per cent of all corridor lights) now incorporate energy efficient LED technology;
- further upgrade of internal office lights—total of 900 office lights (equal to 15 per cent of all office lights) upgraded to type that requires less than half the energy; and
- preparation to upgrade the four large flagpole lights to more energy-efficient LED technology—250 watt LED lamps will replace existing 1000 watt lamps
Optimisation of heating and cooling equipment
In February 2013, three newly installed chillers were reprogrammed and optimised to better meet the building's cooling requirements and reduce energy. The result from this work has reduced the energy consumption of the chillers by more than half.
Energy management software
In June 2013, DPS purchased a new Energy Management System (EMS) to effectively monitor and manage energy consumption. The new system will allow DPS to:
- analyse energy usage patterns;
- identify and reduce wastage; and
- optimise equipment operating times.
Solar panels
There are 234 solar panels—with a maximum capacity of 43kW and covering an area of 300m�² (the equivalent of 20 average home installations)—on the roof of the Senate wing and the Gardeners Compound. During 2012–13, these panels produced 64,707 kWh of clean electricity for the building, representing a 9 per cent increase compared with 2011–12.
The solar panels provide the equivalent electricity that would be needed to illuminate both the Senate and House of Representatives Chambers during sittings each year.
Sustainable transport
DPS provides bike storage, shower and change room facilities for people who cycle to Parliament House. DPS promoted the 2012 annual Ride to Work Day to building occupants and a number of DPS staff and other building occupants took part in a Ride to Work Day breakfast event hosted by the National Library of Australia.
Vehicles
The DPS passenger vehicle fleet consisted of 15 leased vehicles in 2012–13. Eleven vehicles achieved a score of 10.5 or higher in the Green Vehicle Guide, representing 73 per cent of the DPS fleet, against the Australian Government fleet average of 59 per cent.32
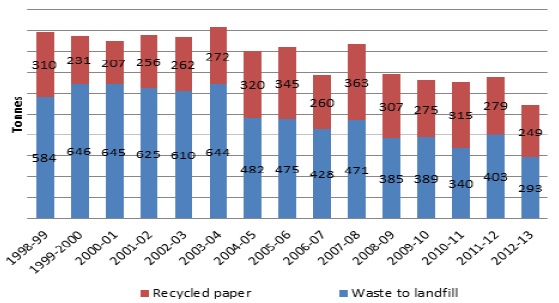
Recycling and waste management
DPS provides facilities to recycle paper, cardboard, printer cartridges, lamps, used oil, grease, batteries, landscape, metal, polystyrene, organic material and co-mingled waste.
In 2012–13, DPS achieved the lowest amount of general waste (excluding construction waste) sent to landfill(293 tonnes) since the building opened in 1988. A key contributor to the decrease was the trial of an organic waste recycling scheme.
Construction waste is managed under project contracts and through instructions provided in the Parliament House Site Book. Where appropriate, construction materials are reused, recycled or disposed of in an environmentally friendly manner.
Figure 10 shows annual waste disposed to landfill or recycled. Figure 11 shows annual trends in landscape waste and recycling rates.
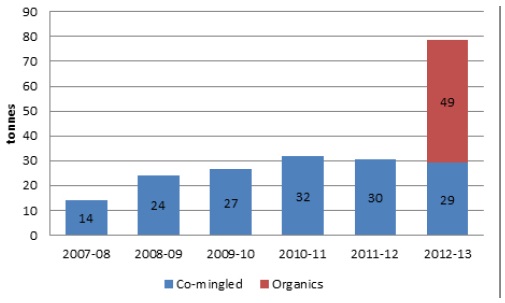
Co-mingled and organic waste recycling
Co-mingled waste includes metal cans, glass bottles, milk cartons and plastic which are collected in a common bin. During 2012–13, 29 tonnes of co-mingled waste was collected, compared to 30 tonnes collected in 2011–12.
Organic waste
From July 2012, in line with the ACT Waste Management Strategy 2011–2025—Towards a sustainable Canberra, DPS collected organic food waste from catering operations in the building for recycling at a local worm farm and compost facility.
During 2012–13, 49 tonnes of organic waste was diverted from landfill and converted into useable garden compost material.
Figure 10—Annual waste disposed to landfill and recycled
Annual waste disposed to landfill and recycled text description
Figure 11—Annual quantity of landscape waste (tonnes)
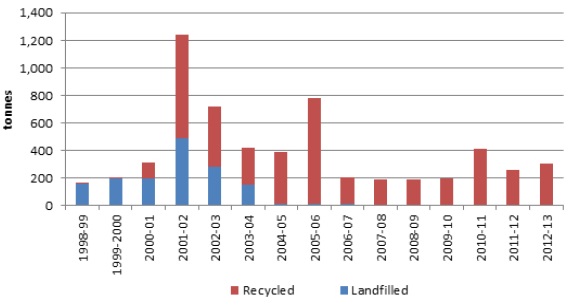
Annual quantity of landscape waste (tonnes) text description
Figure 12 illustrates annual co-mingled and organic recycling rates.
Emissions and effluents
Greenhouse gas emissions
In 2012–13, emission offsets included 2,701 tonnes CO2e from 10 per cent accredited green power purchased through the whole-of-government electricity contract, and a further 69 tonnes CO2e from clean electricity generated on site from solar panels at Parliament House.
Table 5.16 shows the breakdown of emissions within various categories.
Figure 13 shows annual greenhouse gas emissions since Parliament House opened in 1988.
Figure 12—Annual co-mingled and organic recycling waste (tonnes)
Annual co-mingled and organic recycling waste (tonnes) text description
Figure 13—Annual greenhouse gas emissions from electricity and gas
Annual greenhouse gas emissions from electricity and gas text description
Table 5.16—Parliament House emissions
|
Emission Category
|
Comment
|
2010–11
(tonnes CO2e)
|
2011–12
(tonnes CO2e)
|
2012–13
(tonnes CO2e)
|
|
Scope 1
|
Emissions at the source of the activity (for example, emitted from gas and fuels used at Parliament House and by vehicles)
|
2,557
|
2,688
|
2,684
|
|
Scope 2
|
Emissions generated elsewhere (for example, by the power plants that produce the electricity used at Parliament House)
|
20,745
|
20,04633
|
20,371
|
|
Scope 3
|
Indirect emissions, meaning emissions generated during the delivery of electricity, gas and fuel to Parliament House, over which DPS has little control.
|
4,678
|
4,593
|
4,665
|
|
Scopes 1 & 2
|
DPS has direct responsibility for these emissions.
|
23,302
|
22,734
|
23,055
|
|
Total net emissions
(Scopes 1,2 and 3)34
|
Direct and indirect emissions.
|
27,980
|
27,327
|
27,720
|
Ozone-depleting substances
Parliament House uses refrigerants that contain ozone-depleting substances. These are used for chillers, cool rooms and refrigerators. DPS is reducing the requirement for ozone-depleting gases through timely replacement of older equipment with equipment that uses environmentally safer refrigerants.
The year 2012–13 was the first year that DPS did not purchase any ozone depleting refrigerants, due to the reduction in older equipment.
Air pollutants—NOx, SOx and particulates
The combustion of natural gas for heating, hot water and cooking purposes generates oxides of nitrogen (NOx), oxides of sulphur (SOx) and other air pollutants. Each year, DPS reports on these emissions to the National Pollution Inventory (www.npi.gov.au). Table 5.17 lists these emissions for 2012–13.
Table 5.17—Emissions of air pollutants from natural gas consumption35
|
Air pollutants
|
2010–11 (kg)
|
2011–12 (kg)
|
2012–13 (kg)
|
|
Carbon monoxide
|
1,912
|
2,009
|
2,057
|
|
Oxides of nitrogen
|
2270
|
2,389
|
2,448
|
|
Particulate matter (PM10)
|
168
|
177
|
181
|
|
Particulate matter (PM2.5)
|
168
|
176
|
180
|
|
Total volatile organic compounds
|
125
|
131
|
134
|
|
Sulphur dioxide
|
25
|
26
|
27
|
|
Polycyclic aromatic hydrocarbons
|
<1(0.015)
|
<1(0.015)
|
<1(0.016)
|
Discharges to water
Sewage from Parliament House is required, under a trade waste agreement, to be equivalent to domestic strength.36 To ensure these requirements are met, the following facilities are in place:
- a grease trap on each kitchen drain;
- a coalescing plate filter on the vehicle wash-down bay (to prevent oil from entering the sewer); and
- a system to remove paint solids from paint brush washing facilities before they enter the sewer.
Significant spills of chemicals, oils and fuels
In 2012–13, there were no significant spills of chemicals, oils or fuels from Parliament House.
Footnotes
15. 2011–12 financial data has been changed, but is not considered a material error. Refer to note 1.22 on page 120.
16. Workforce diversity data relies on self-identification. These figures are likely under-reported due to a loss of disability data in the transfer of HR information systems from PeopleSoft to Chris 21 in 2010.
17. Office Tenant Light and Power is not metered separately in the building. All office energy use is included in Base/Central Building energy consumption.
18. Base/Central Building energy consumption includes Office Tenant Light and Power and diesel fuel consumption (diesel is used during testing of emergency backup generators).
19. Greenhouse emissions in 2011–12 were incorrectly reported as 29,834 T CO2e, due to the reduction in emissions from green power being excluded.
20. 'Green power purchased' includes 10 per cent accredited green power purchased through the electricity contract and solar power (<1 per cent) produced on site by DPS.
21. DPS only—excludes agency specific data of other parliamentary departments, which was previously reported by DPS (relates to vehicle fleets, air travel and paper purchased).
22. DPS only—excludes agency specific data of other parliamentary departments, which was previously reported by DPS (relates to vehicle fleets, air travel and paper purchased).
23. FTE numbers comprise staff of the four parliamentary departments (DPS, Parliamentary Budget Office, Senate and House of Representatives). Building occupants impacting environmental performance and not represented in FTE figures include: Senators, Members and their staff; media personnel; licensees and tenants; contractors; and visitors to the building.
24. Office paper recycled is not measured separately. Figures represent all paper products recycled at Parliament House including non-office areas. Office paper represents approximately 20–30 per cent of all paper products recycled.
25. Total waste produced includes landfill waste, paper products, co-mingled recycling and organic food waste.
26. Total waste produced in 2011–12 was incorrectly reported as 403 tonnes, due to exclusion of paper and co-mingled waste (ie landfill waste only reported).
27. 'Top Down' is the third point on a five-point maturity scale devised by Comcover for its annual risk management benchmarking survey. See http://www.finance.gov.au/comcover/docs/risk-management-maturity-statements.pdf for more detail.
28. Includes electricity, natural gas and diesel (non-transport).
29. Parliament House building energy use in 2011–12 was 139,563GJ, not 139,349GJ as previously reported.
30. Excludes agency-specific data (vehicles) of other parliamentary departments previously reported by DPS.
31. Includes LPG, Diesel and Petrol used in Maintenance and Loading Dock vehicles.
32. Reported by the Australian Nation Audit Office (excludes Defence vehicles).
33. Scope 2 and 3 emissions for 2011–12 have been revised to reflect change to Energy Consumption—see footnote 29 Table 5.15.
34. Total net emissions include offsets from accredited green power purchased and solar power generated on site (solar power generated from June 2011).
35. Air pollutants reported comply with EN21 of the Global Reporting Initiative and are calculated using the National Pollution Inventory (NPI) online reporting tool. Air pollutants are from single-point sources such as vents or pipes (kg/year).
36. A domestic equivalent is a concentration or level the same as would be found in household waste water.